| Param | Original file | Final file |
|---|---|---|
| Filename | modeM0/AS1A13_031T01_9000006462_51685cztM0_level2.fits | modeM0/AS1A13_031T01_9000006462_51685cztM0_level2_quad_clean.evt |
| Size (bytes) | 505,105,920 | 99,167,040 |
| Size | 481.7 MB | 94.6 MB |
| Events in quadrant A | 3,769,254 | 651,322 |
| Events in quadrant B | 4,215,708 | 708,378 |
| Events in quadrant C | 5,929,958 | 583,888 |
| Events in quadrant D | 4,250,675 | 581,894 |
| Mode M9 | |||
|---|---|---|---|
| Quadrant | BADHDUFLAG | Total packets | Discarded packets |
| A | 0 | 12 | 0 |
| B | 0 | 13 | 0 |
| C | 0 | 13 | 0 |
| D | 0 | 13 | 0 |
| Mode M0 | |||
|---|---|---|---|
| Quadrant | BADHDUFLAG | Total packets | Discarded packets |
| A | 0 | 15645 | 2 |
| B | 0 | 17126 | 2 |
| C | 0 | 22421 | 2 |
| D | 0 | 17418 | 3 |
| Mode SS | |||
|---|---|---|---|
| Quadrant | BADHDUFLAG | Total packets | Discarded packets |
| A | 0 | 140 | 0 |
| B | 0 | 140 | 0 |
| C | 0 | 140 | 0 |
| D | 0 | 140 | 0 |
| Quadrant | Total seconds | Saturated seconds | Saturation percentage |
|---|---|---|---|
| A | 6846 | 209 | 3.052878% |
| B | 6846 | 273 | 3.987730% |
| C | 6846 | 822 | 12.007011% |
| D | 6845 | 290 | 4.236669% |
Noise dominated data is calculated using 1-second bins in cleaned event files. If a bin has >2000 counts, and if more than 50% of those come from <1% of pixels, then it is considered to be noise-dominated and hence unusable.
| Quadrant | # 1 sec bins | Bins with >0 counts | Bins with >2000 counts | High rate bins dominated by noise | Noise dominated (total time) | Noise dominated (detector-on time) | Marked lightcurve |
|---|---|---|---|---|---|---|---|
| A | 7881 | 6847 | 57 | 57 | 0.72% | 0.83% | 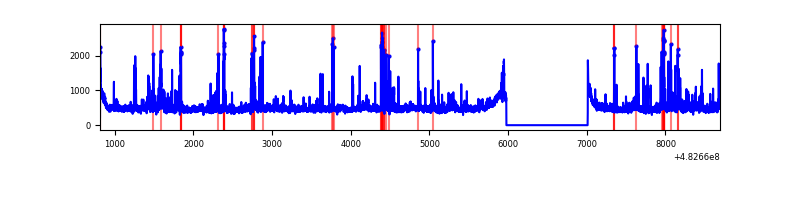 |
| B | 7881 | 6847 | 95 | 95 | 1.21% | 1.39% | 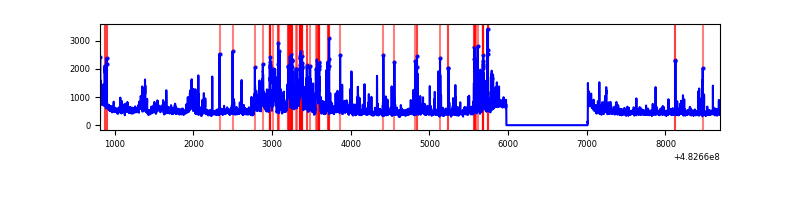 |
| C | 7881 | 6847 | 681 | 681 | 8.64% | 9.95% | 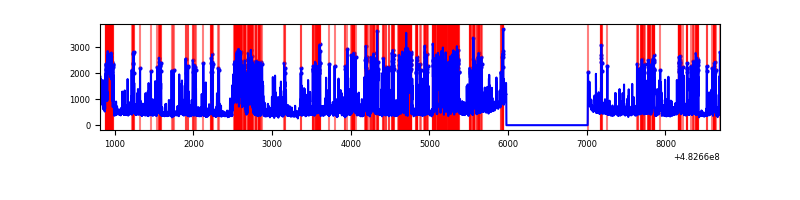 |
| D | 7880 | 6846 | 184 | 184 | 2.34% | 2.69% | 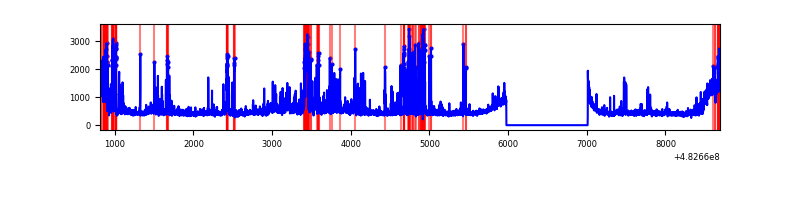 |
Top three noisy pixels from each quadrant. If the there are fewer than three noisy pixels in the level2.evt file, extra rows are filled as -1
| Pixel properties | Quadrant properties | ||||||
|---|---|---|---|---|---|---|---|
| Quadrant | DetID | PixID | Counts | Sigma | Mean | Median | Sigma |
| A | 3 | 14 | 159211 | 864.23 | 751 | 736 | 183.4 |
| A | 8 | 47 | 93260 | 504.57 | 751 | 736 | 183.4 |
| A | 8 | 63 | 85889 | 464.38 | 751 | 736 | 183.4 |
| B | 10 | 44 | 478763 | 3019.03 | 741 | 715 | 158.3 |
| B | 12 | 32 | 163972 | 1031.02 | 741 | 715 | 158.3 |
| B | 0 | 171 | 112864 | 708.26 | 741 | 715 | 158.3 |
| C | 15 | 189 | 1027932 | 5499.48 | 695 | 691 | 186.8 |
| C | 12 | 254 | 518442 | 2771.85 | 695 | 691 | 186.8 |
| C | 0 | 192 | 449244 | 2401.39 | 695 | 691 | 186.8 |
| D | 15 | 94 | 435564 | 2174.47 | 719 | 693 | 200.0 |
| D | 6 | 42 | 308278 | 1538.01 | 719 | 693 | 200.0 |
| D | 10 | 172 | 288347 | 1438.35 | 719 | 693 | 200.0 |
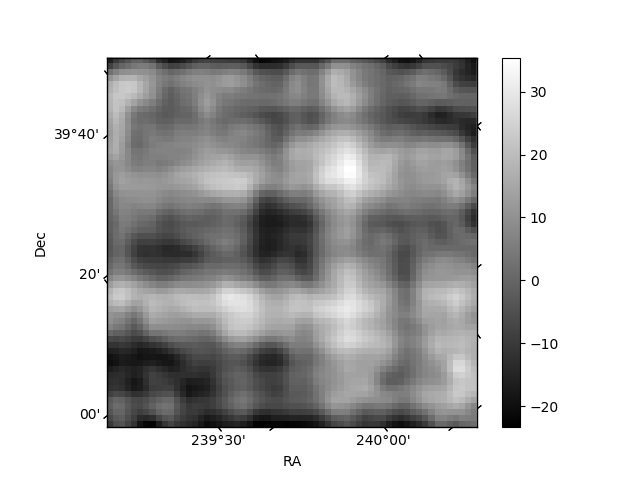
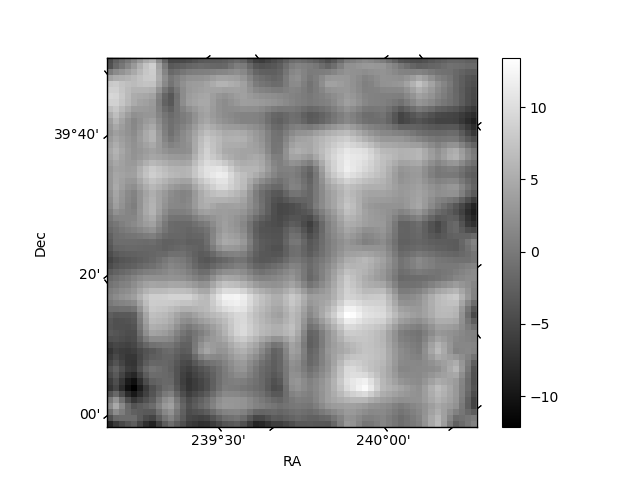
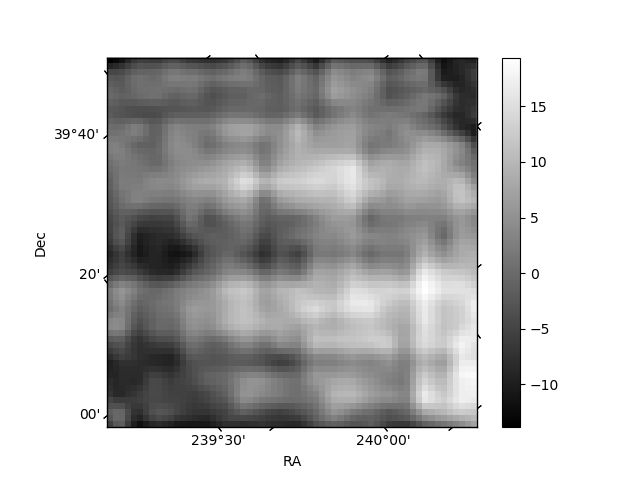
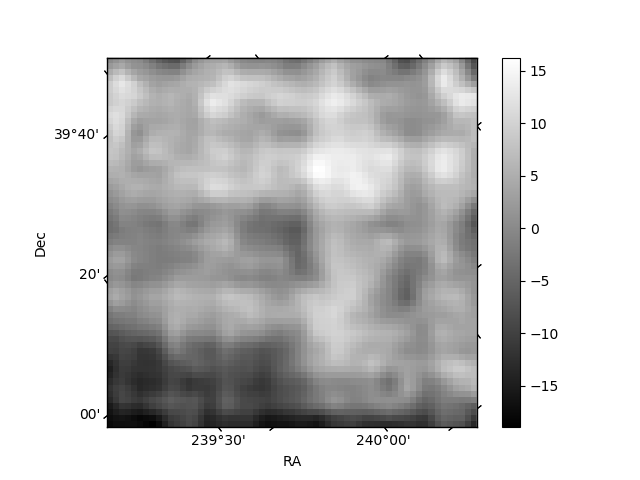
Histogram calculated using DETX and DETY for each event in the final _common_clean file
| Quadrant A | 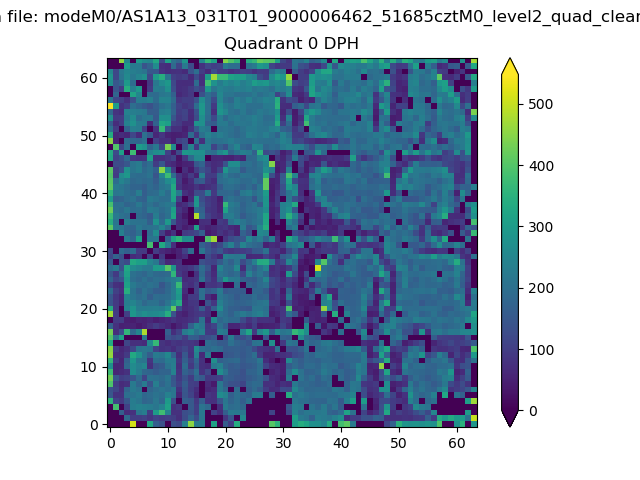 |
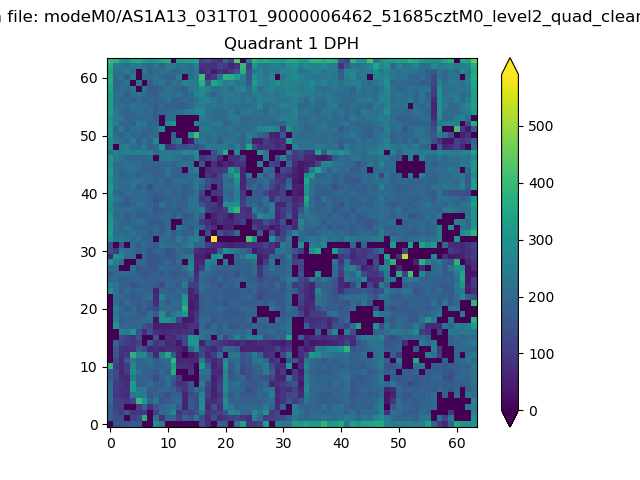 |
Quadrant B |
|---|---|---|---|
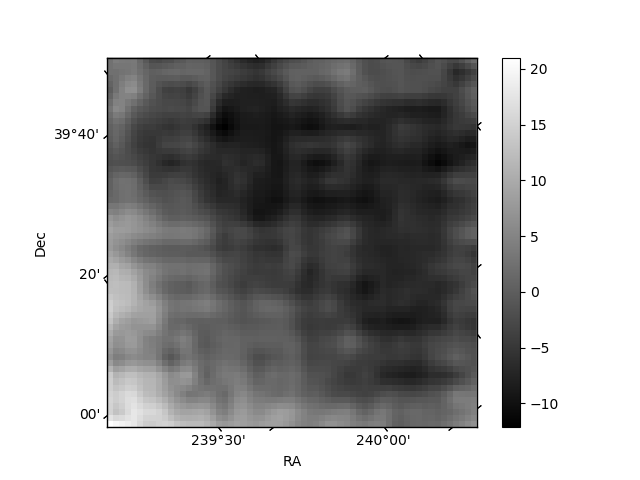
| Quadrant D | 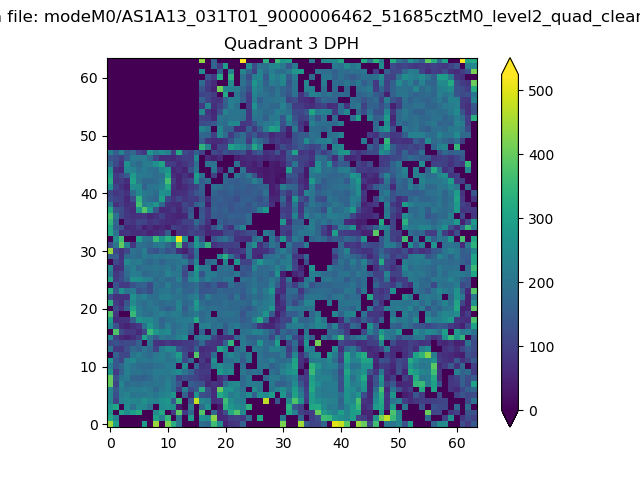 |
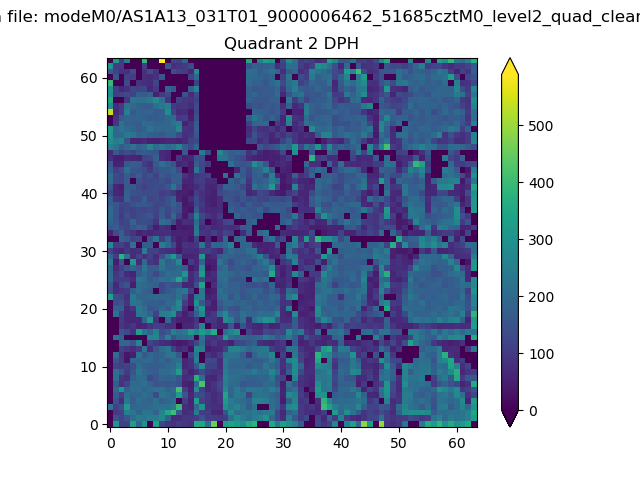 |
Quadrant C |
| Plot type | Count rate plots | Images |
|---|---|---|
| Comparison with Poisson distribution Blue bars denote a histogram of data divided into 1 sec bins. Red curve is a Poisson curve with rate = median count rate of data. |
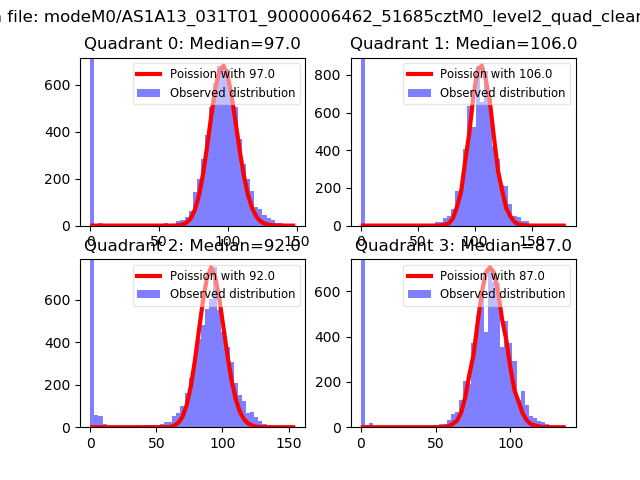 |
 |
| Quadrant-wise count rates Data is divided into 100 sec bins |
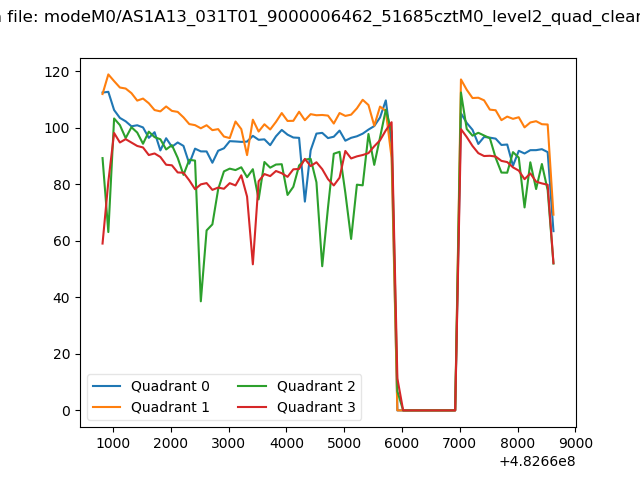 |
|
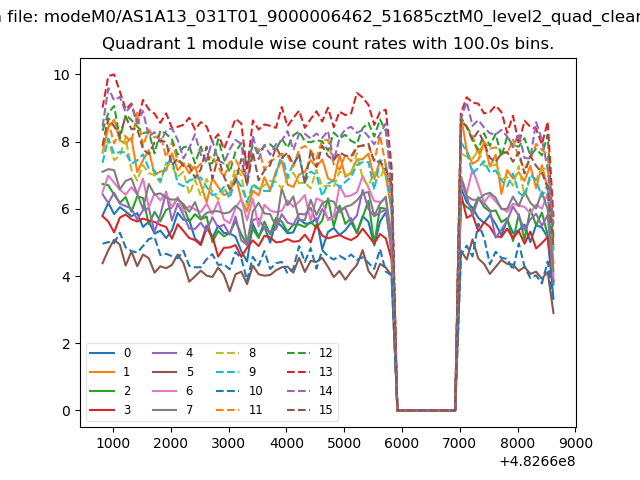
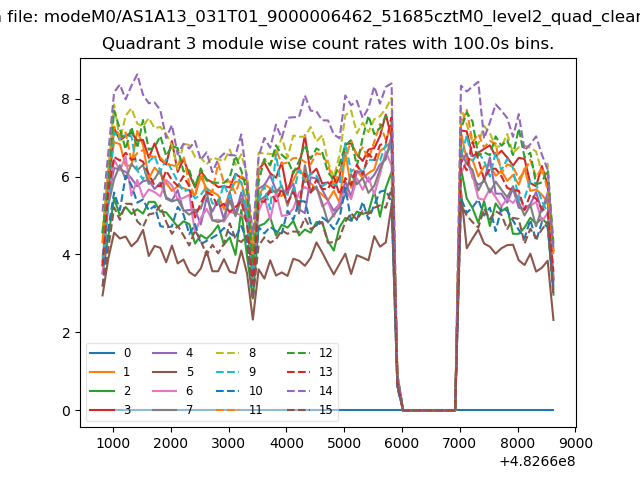
| Module-wise count rates for Quadrant A Data is divided into 100 sec bins |
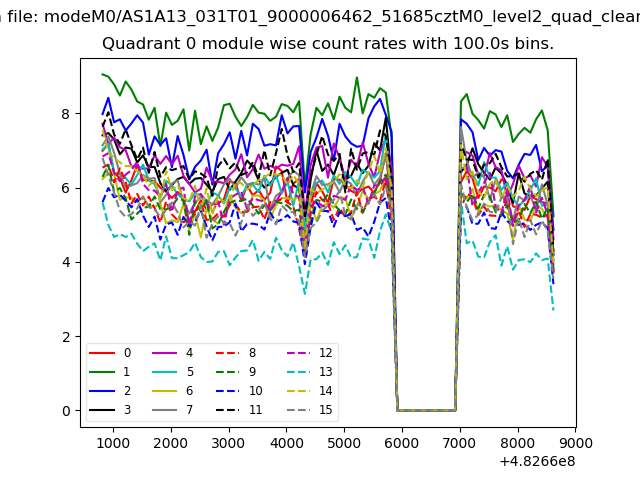 |
 |
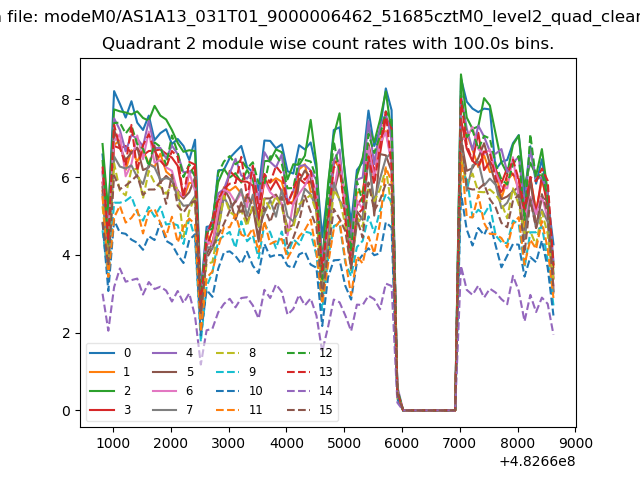
| Module-wise count rates for Quadrant B Data is divided into 100 sec bins |
 |
 |
| Module-wise count rates for Quadrant C Data is divided into 100 sec bins |
 |
 |
| Module-wise count rates for Quadrant D Data is divided into 100 sec bins |
 |
 |
| Parameter | Plot |
|---|---|
| CZT HV Monitor | 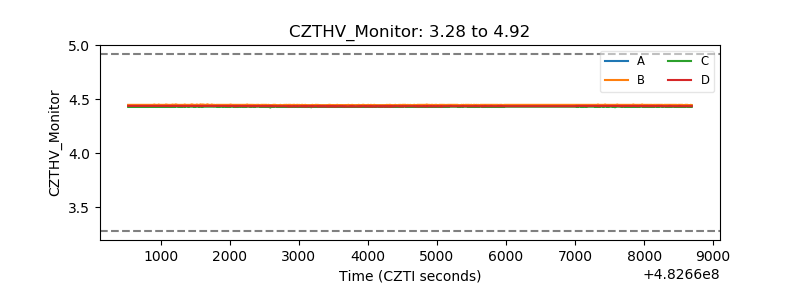 |
| D_VDD | 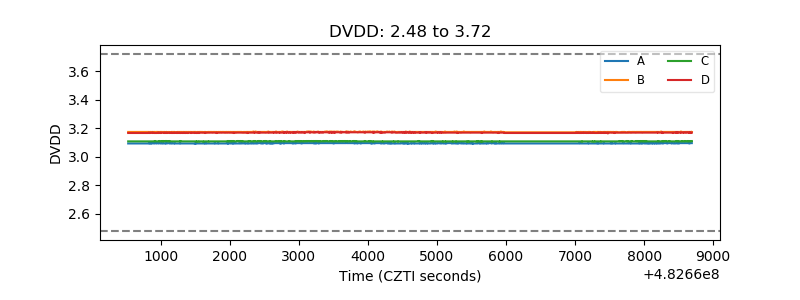 |
| Temperature 1 | 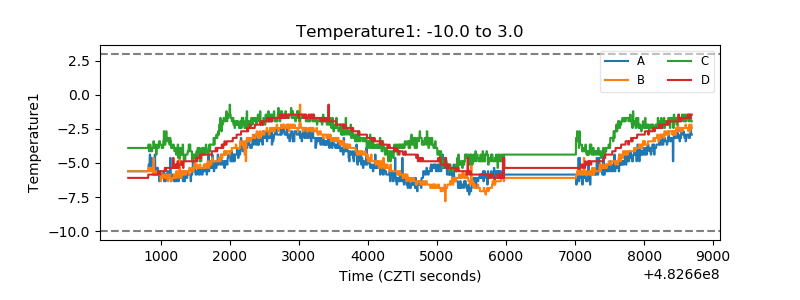 |
| Veto HV Monitor | 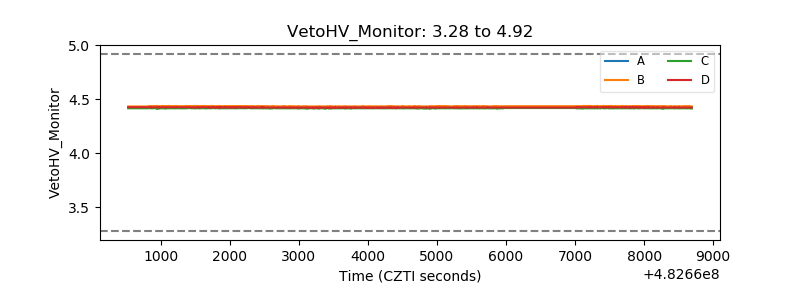 |
| Veto LLD | 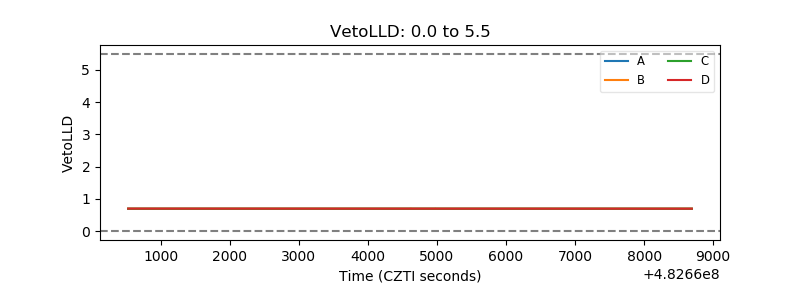 |
| Alpha Counter | 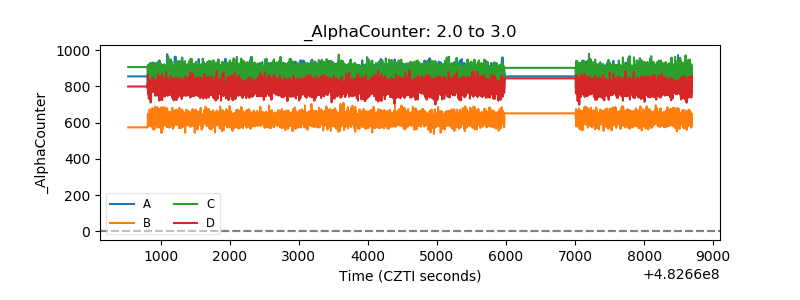 |
| _CPM_Rate | 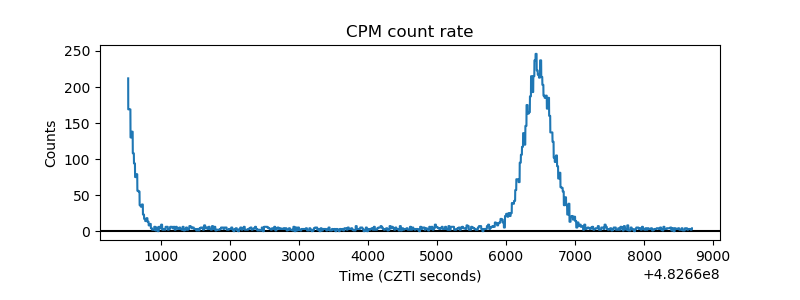 |
| CZT Counter | 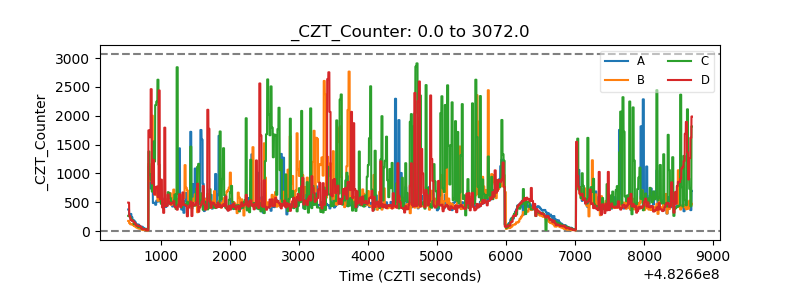 |
| +2.5 Volts monitor | 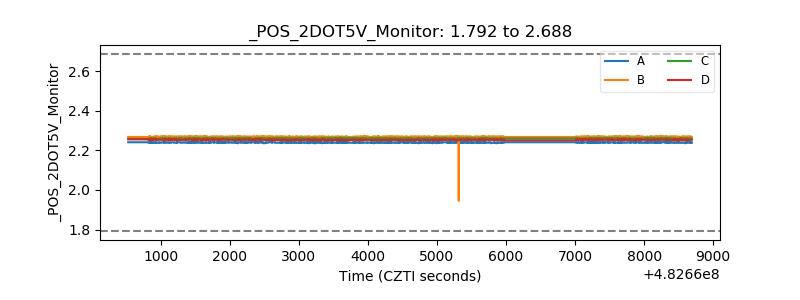 |
| +5 Volts monitor | 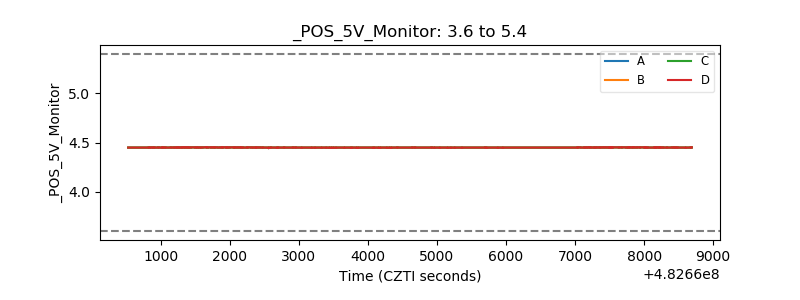 |
| _ROLL_ROT | 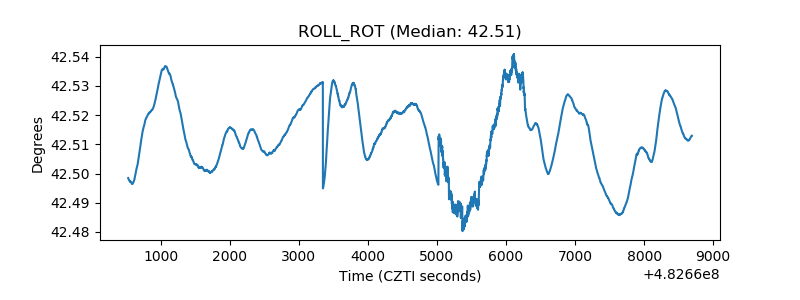 |
| _Roll_DEC | 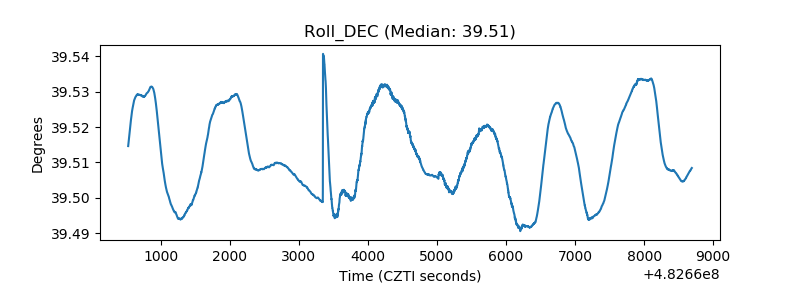 |
| _Roll_RA | 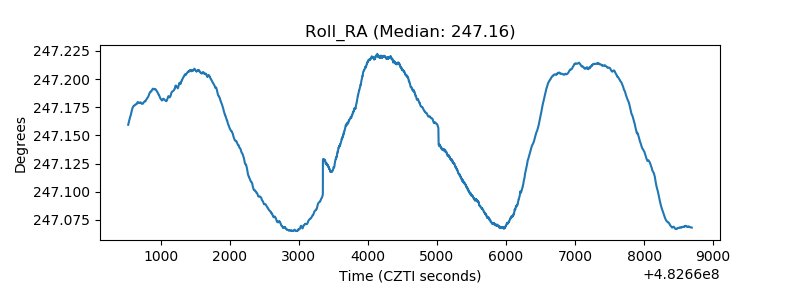 |
| Veto Counter | 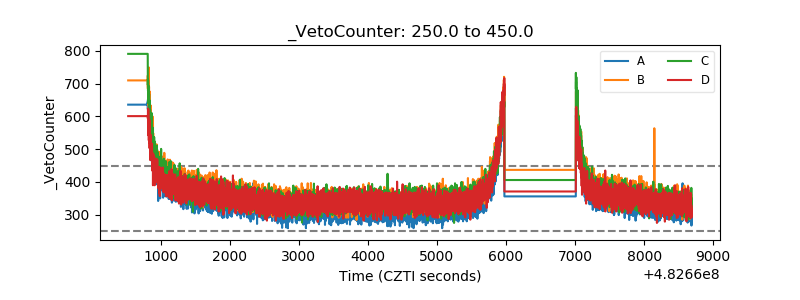 |