| Param | Original file | Final file |
|---|---|---|
| Filename | modeM0/AS1A13_031T01_9000006462_51686cztM0_level2.fits | modeM0/AS1A13_031T01_9000006462_51686cztM0_level2_quad_clean.evt |
| Size (bytes) | 504,768,960 | 98,392,320 |
| Size | 481.4 MB | 93.8 MB |
| Events in quadrant A | 3,795,788 | 644,989 |
| Events in quadrant B | 3,696,179 | 697,928 |
| Events in quadrant C | 5,807,289 | 577,898 |
| Events in quadrant D | 4,846,167 | 574,890 |
| Mode M9 | |||
|---|---|---|---|
| Quadrant | BADHDUFLAG | Total packets | Discarded packets |
| A | 0 | 8 | 0 |
| B | 0 | 8 | 0 |
| C | 0 | 8 | 0 |
| D | 0 | 8 | 0 |
| Mode M0 | |||
|---|---|---|---|
| Quadrant | BADHDUFLAG | Total packets | Discarded packets |
| A | 0 | 15980 | 1 |
| B | 0 | 15801 | 1 |
| C | 0 | 22116 | 1 |
| D | 0 | 19233 | 1 |
| Mode SS | |||
|---|---|---|---|
| Quadrant | BADHDUFLAG | Total packets | Discarded packets |
| A | 0 | 140 | 0 |
| B | 0 | 140 | 0 |
| C | 0 | 140 | 0 |
| D | 0 | 140 | 0 |
| Quadrant | Total seconds | Saturated seconds | Saturation percentage |
|---|---|---|---|
| A | 6943 | 216 | 3.111047% |
| B | 6943 | 244 | 3.514331% |
| C | 6943 | 848 | 12.213740% |
| D | 6943 | 352 | 5.069855% |
Noise dominated data is calculated using 1-second bins in cleaned event files. If a bin has >2000 counts, and if more than 50% of those come from <1% of pixels, then it is considered to be noise-dominated and hence unusable.
| Quadrant | # 1 sec bins | Bins with >0 counts | Bins with >2000 counts | High rate bins dominated by noise | Noise dominated (total time) | Noise dominated (detector-on time) | Marked lightcurve |
|---|---|---|---|---|---|---|---|
| A | 7713 | 6944 | 49 | 49 | 0.64% | 0.71% | 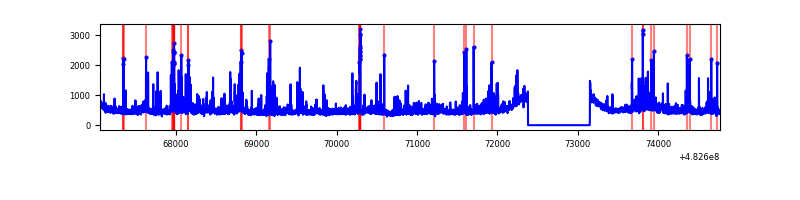 |
| B | 7713 | 6944 | 54 | 54 | 0.70% | 0.78% |  |
| C | 7713 | 6944 | 649 | 649 | 8.41% | 9.35% |  |
| D | 7713 | 6944 | 248 | 248 | 3.22% | 3.57% | 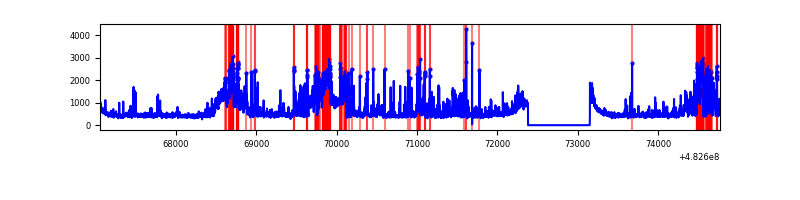 |
Top three noisy pixels from each quadrant. If the there are fewer than three noisy pixels in the level2.evt file, extra rows are filled as -1
| Pixel properties | Quadrant properties | ||||||
|---|---|---|---|---|---|---|---|
| Quadrant | DetID | PixID | Counts | Sigma | Mean | Median | Sigma |
| A | 3 | 14 | 109762 | 584.45 | 763 | 743 | 186.5 |
| A | 5 | 240 | 102094 | 543.34 | 763 | 743 | 186.5 |
| A | 10 | 223 | 85104 | 452.26 | 763 | 743 | 186.5 |
| B | 5 | 185 | 174190 | 1080.82 | 750 | 724 | 160.5 |
| B | 0 | 171 | 93781 | 579.81 | 750 | 724 | 160.5 |
| B | 1 | 223 | 65099 | 401.1 | 750 | 724 | 160.5 |
| C | 15 | 189 | 1894476 | 9810.54 | 707 | 701 | 193.0 |
| C | 0 | 176 | 360109 | 1861.88 | 707 | 701 | 193.0 |
| C | 13 | 3 | 256435 | 1324.81 | 707 | 701 | 193.0 |
| D | 10 | 172 | 784508 | 3921.7 | 730 | 705 | 199.9 |
| D | 15 | 94 | 532702 | 2661.81 | 730 | 705 | 199.9 |
| D | 3 | 12 | 174101 | 867.57 | 730 | 705 | 199.9 |
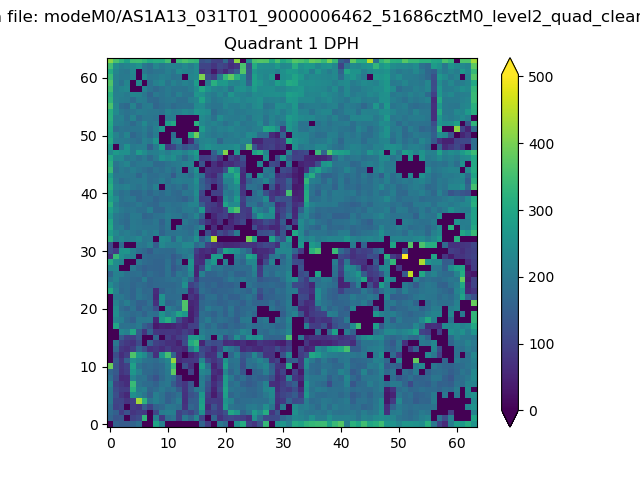
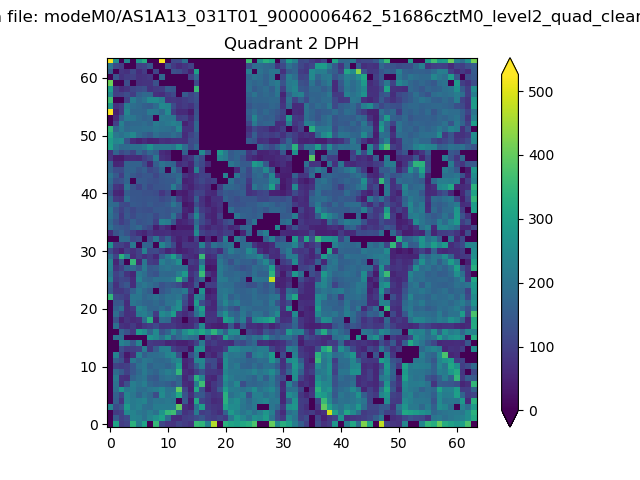
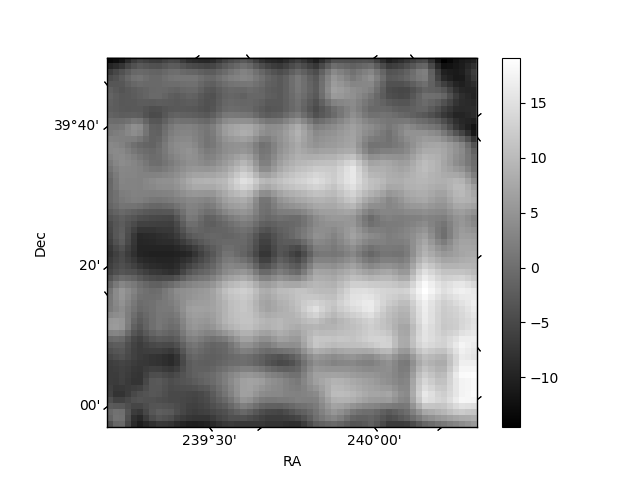
Histogram calculated using DETX and DETY for each event in the final _common_clean file
| Quadrant A |  |
 |
Quadrant B |
|---|---|---|---|
| Quadrant D | 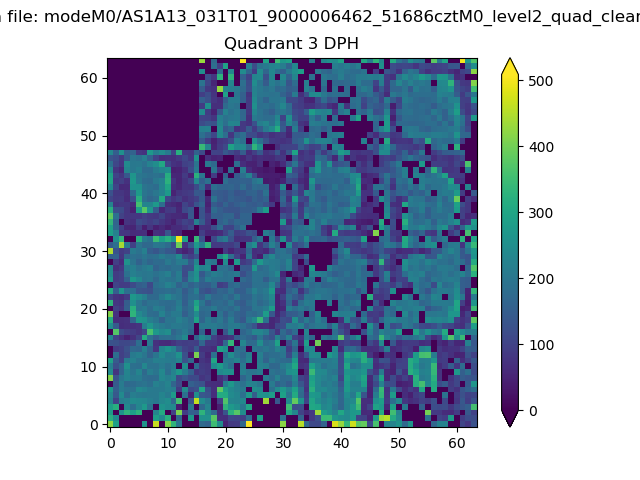 |
 |
Quadrant C |
| Plot type | Count rate plots | Images |
|---|---|---|
| Comparison with Poisson distribution Blue bars denote a histogram of data divided into 1 sec bins. Red curve is a Poisson curve with rate = median count rate of data. |
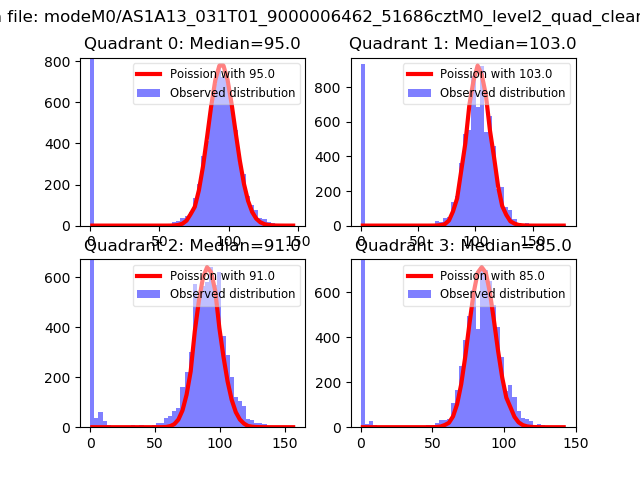 |
 |
| Quadrant-wise count rates Data is divided into 100 sec bins |
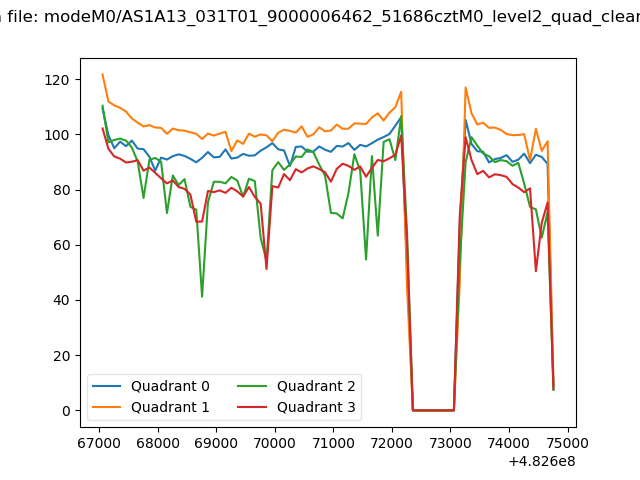 |
|
| Module-wise count rates for Quadrant A Data is divided into 100 sec bins |
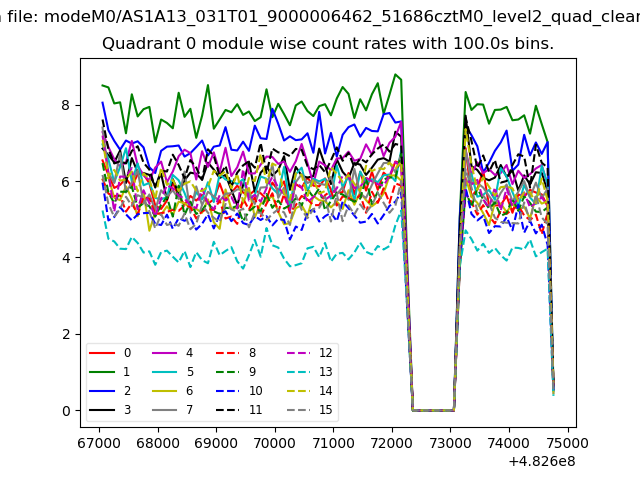 |
 |
| Module-wise count rates for Quadrant B Data is divided into 100 sec bins |
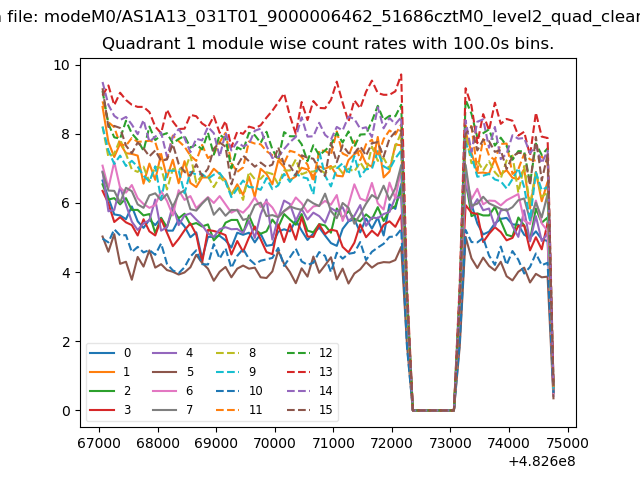 |
 |
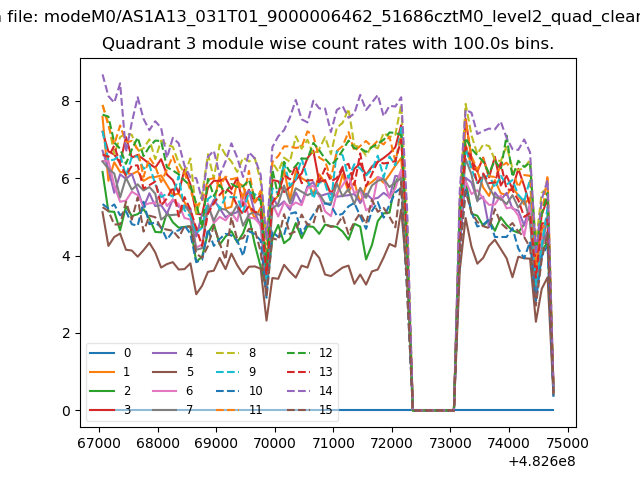
| Module-wise count rates for Quadrant C Data is divided into 100 sec bins |
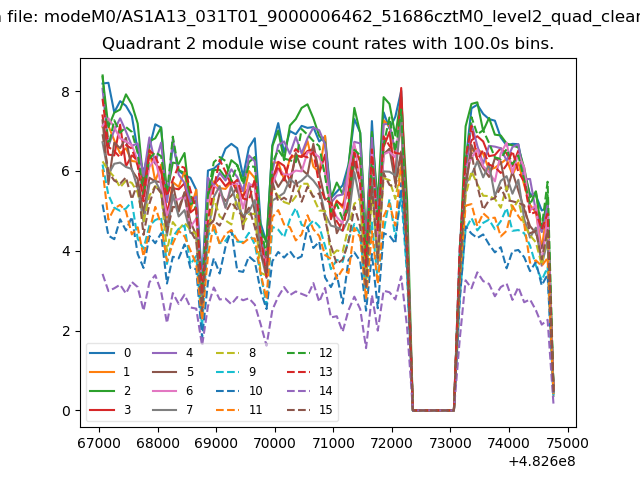 |
 |
| Module-wise count rates for Quadrant D Data is divided into 100 sec bins |
 |
 |
| Parameter | Plot |
|---|---|
| CZT HV Monitor | 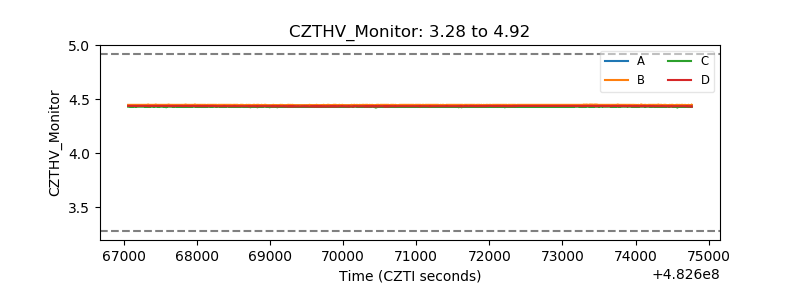 |
| D_VDD | 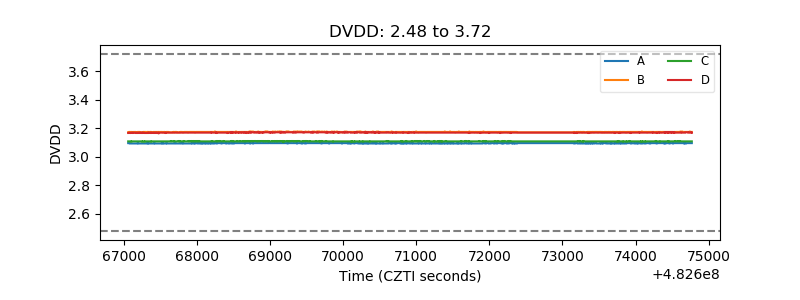 |
| Temperature 1 | 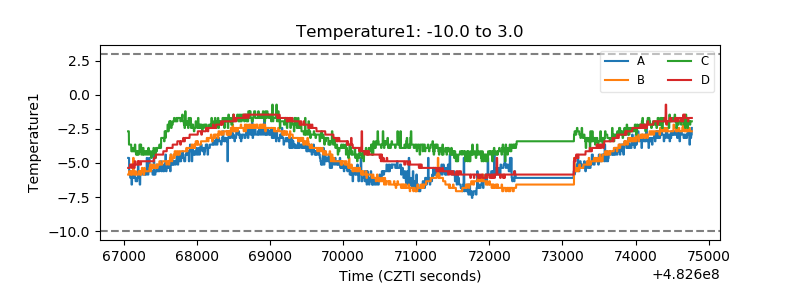 |
| Veto HV Monitor | 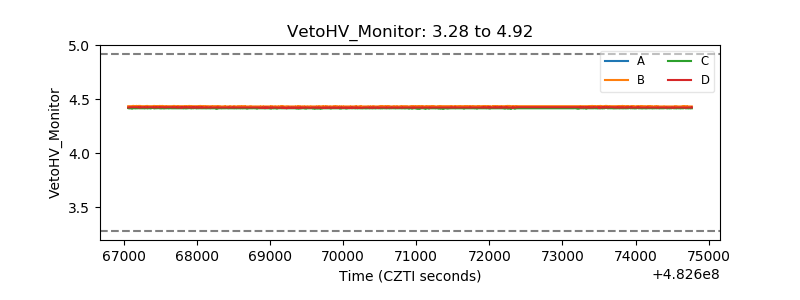 |
| Veto LLD | 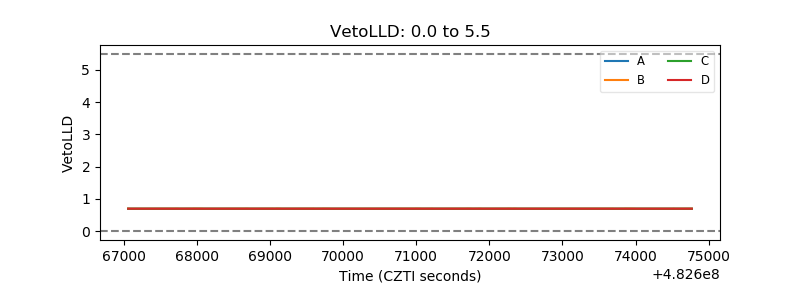 |
| Alpha Counter | 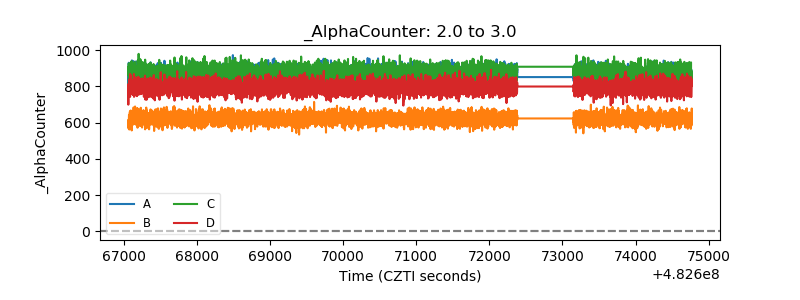 |
| _CPM_Rate | 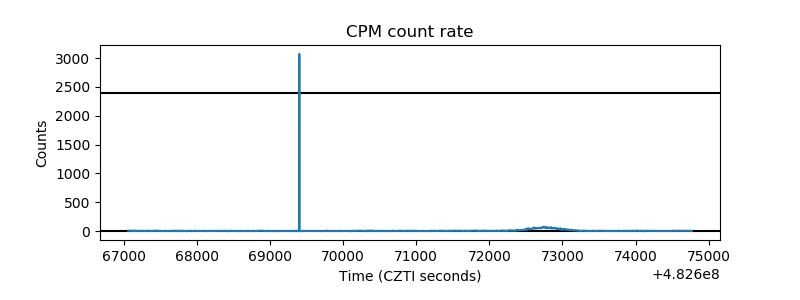 |
| CZT Counter | 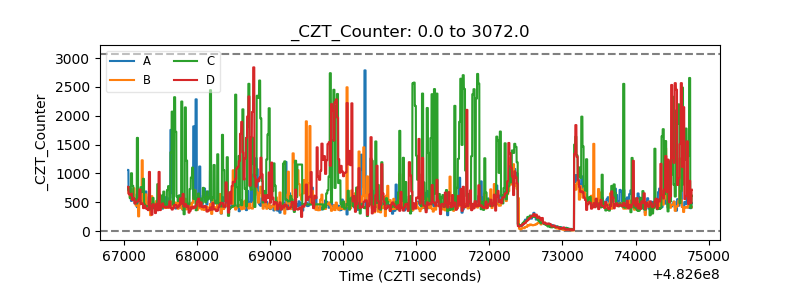 |
| +2.5 Volts monitor | 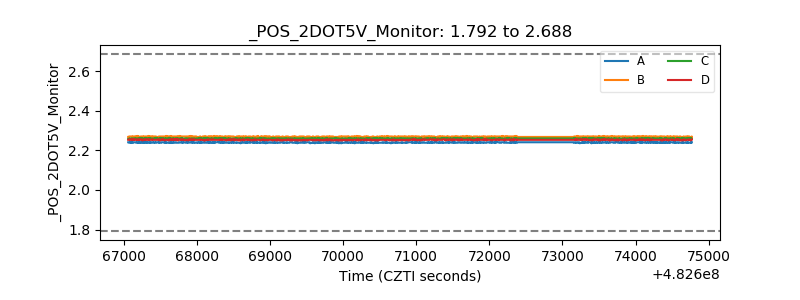 |
| +5 Volts monitor | 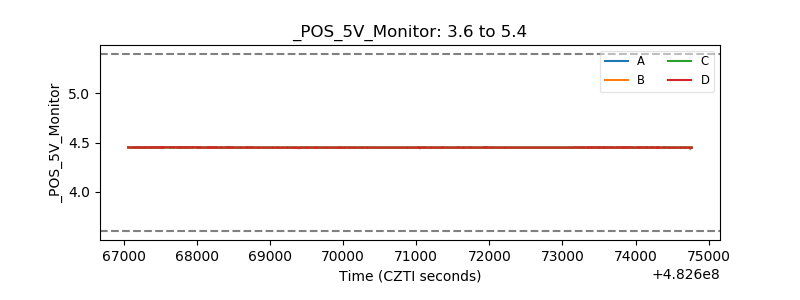 |
| _ROLL_ROT | 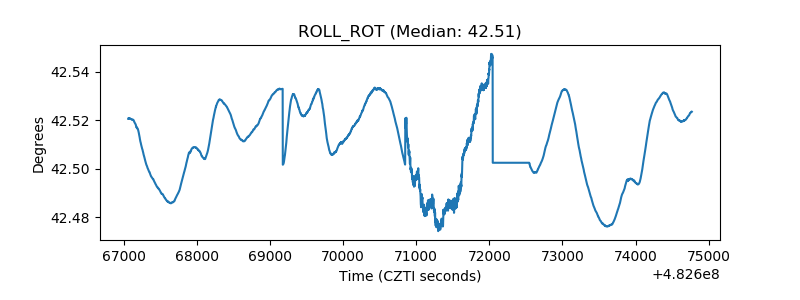 |
| _Roll_DEC | 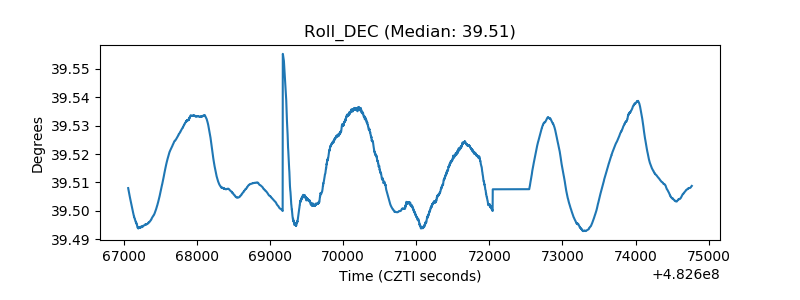 |
| _Roll_RA | 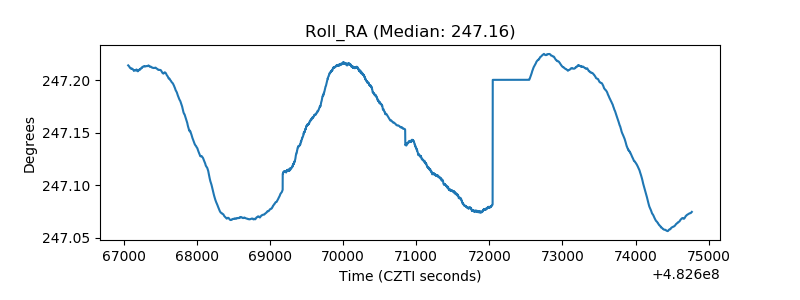 |
| Veto Counter | 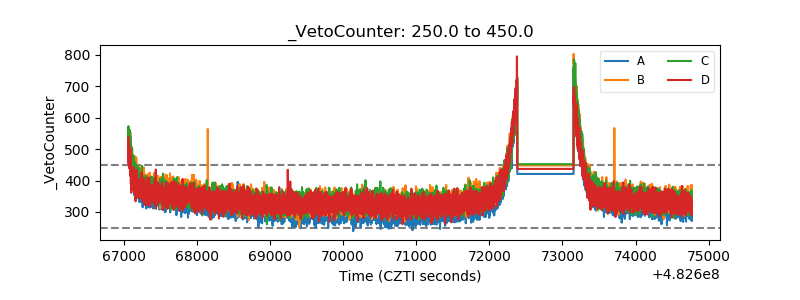 |