| Param | Original file | Final file |
|---|---|---|
| Filename | modeM0/AS1A13_031T01_9000006462_51687cztM0_level2.fits | modeM0/AS1A13_031T01_9000006462_51687cztM0_level2_quad_clean.evt |
| Size (bytes) | 644,978,880 | 103,769,280 |
| Size | 615.1 MB | 99.0 MB |
| Events in quadrant A | 4,275,448 | 701,316 |
| Events in quadrant B | 4,516,897 | 749,184 |
| Events in quadrant C | 9,170,313 | 514,460 |
| Events in quadrant D | 5,304,823 | 633,366 |
| Mode M9 | |||
|---|---|---|---|
| Quadrant | BADHDUFLAG | Total packets | Discarded packets |
| A | 0 | 6 | 0 |
| B | 0 | 7 | 0 |
| C | 0 | 7 | 0 |
| D | 0 | 7 | 0 |
| Mode M0 | |||
|---|---|---|---|
| Quadrant | BADHDUFLAG | Total packets | Discarded packets |
| A | 0 | 17902 | 2 |
| B | 0 | 18766 | 2 |
| C | 0 | 32774 | 2 |
| D | 0 | 21188 | 2 |
| Mode SS | |||
|---|---|---|---|
| Quadrant | BADHDUFLAG | Total packets | Discarded packets |
| A | 0 | 158 | 0 |
| B | 0 | 158 | 0 |
| C | 0 | 158 | 0 |
| D | 0 | 158 | 0 |
| Quadrant | Total seconds | Saturated seconds | Saturation percentage |
|---|---|---|---|
| A | 7819 | 475 | 6.074946% |
| B | 7819 | 589 | 7.532933% |
| C | 7819 | 2373 | 30.349150% |
| D | 7819 | 559 | 7.149252% |
Noise dominated data is calculated using 1-second bins in cleaned event files. If a bin has >2000 counts, and if more than 50% of those come from <1% of pixels, then it is considered to be noise-dominated and hence unusable.
| Quadrant | # 1 sec bins | Bins with >0 counts | Bins with >2000 counts | High rate bins dominated by noise | Noise dominated (total time) | Noise dominated (detector-on time) | Marked lightcurve |
|---|---|---|---|---|---|---|---|
| A | 7934 | 7820 | 61 | 61 | 0.77% | 0.78% | 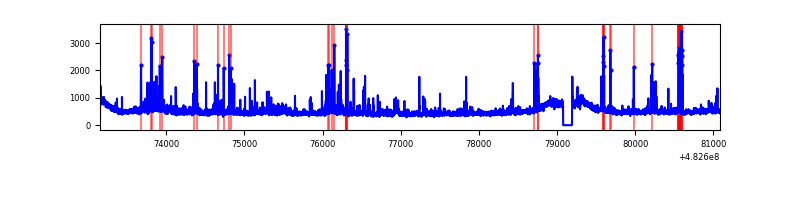 |
| B | 7934 | 7820 | 97 | 97 | 1.22% | 1.24% | 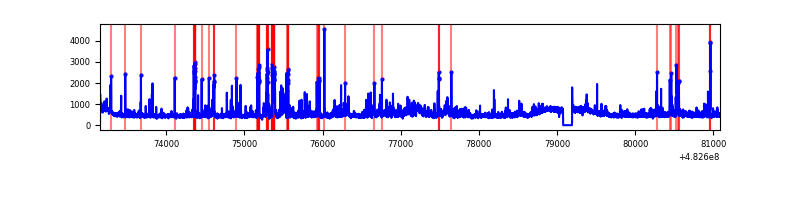 |
| C | 7934 | 7820 | 1688 | 1688 | 21.28% | 21.59% | 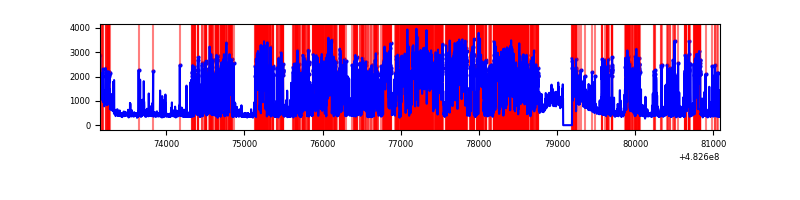 |
| D | 7934 | 7820 | 227 | 227 | 2.86% | 2.90% | 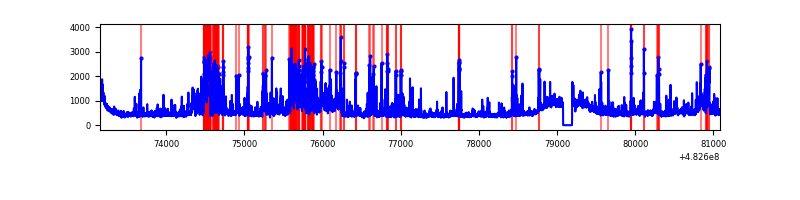 |
Top three noisy pixels from each quadrant. If the there are fewer than three noisy pixels in the level2.evt file, extra rows are filled as -1
| Pixel properties | Quadrant properties | ||||||
|---|---|---|---|---|---|---|---|
| Quadrant | DetID | PixID | Counts | Sigma | Mean | Median | Sigma |
| A | 3 | 14 | 155629 | 729.36 | 879 | 857 | 212.2 |
| A | 5 | 240 | 146328 | 685.53 | 879 | 857 | 212.2 |
| A | 13 | 248 | 100030 | 467.35 | 879 | 857 | 212.2 |
| B | 10 | 254 | 195250 | 1054.25 | 861 | 831 | 184.4 |
| B | 5 | 185 | 167794 | 905.37 | 861 | 831 | 184.4 |
| B | 0 | 171 | 127283 | 685.69 | 861 | 831 | 184.4 |
| C | 15 | 189 | 4572522 | 22639.15 | 750 | 741 | 201.9 |
| C | 0 | 192 | 459323 | 2270.87 | 750 | 741 | 201.9 |
| C | 13 | 3 | 422488 | 2088.46 | 750 | 741 | 201.9 |
| D | 10 | 172 | 605873 | 2590.7 | 852 | 820 | 233.5 |
| D | 3 | 12 | 433591 | 1853.02 | 852 | 820 | 233.5 |
| D | 15 | 94 | 408580 | 1745.93 | 852 | 820 | 233.5 |
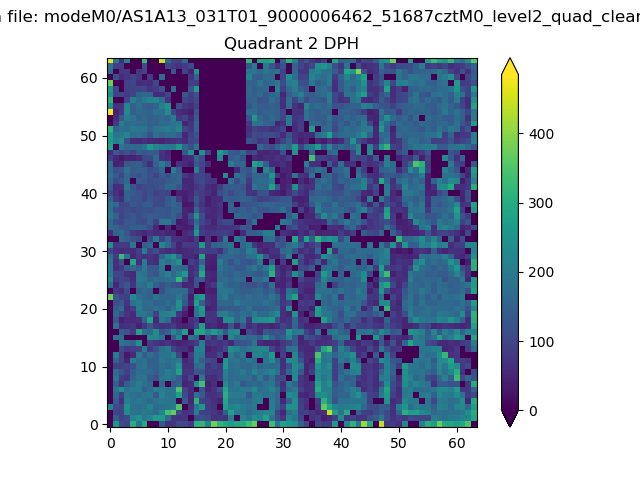
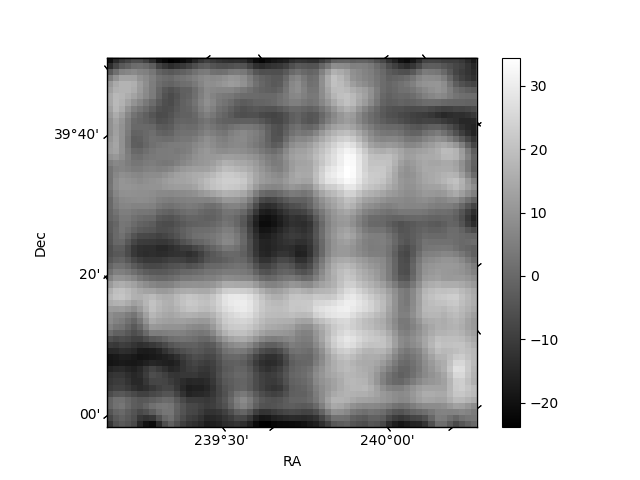
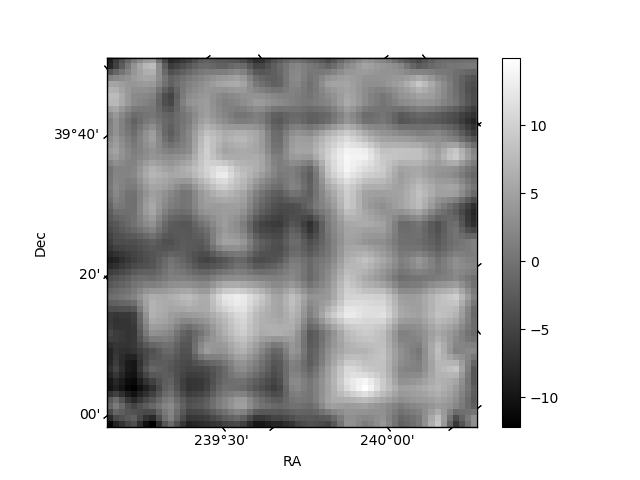
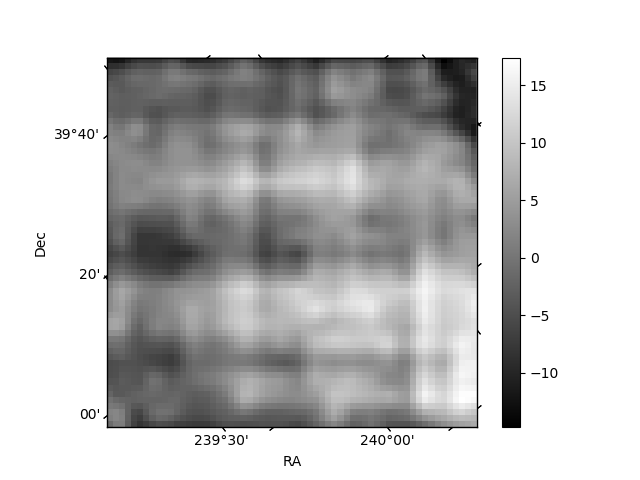
Histogram calculated using DETX and DETY for each event in the final _common_clean file
| Quadrant A | 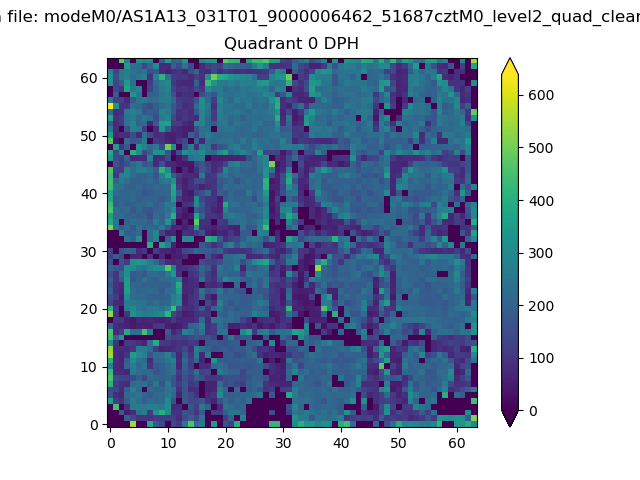 |
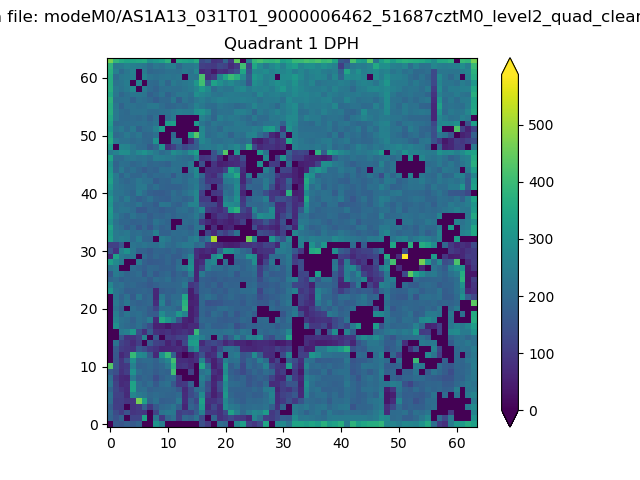 |
Quadrant B |
|---|---|---|---|
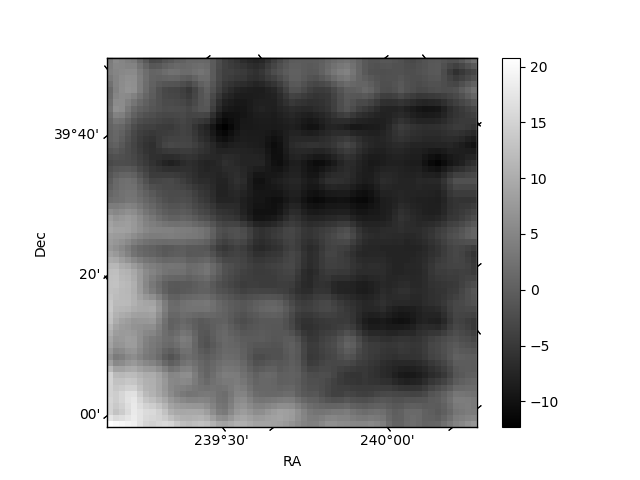
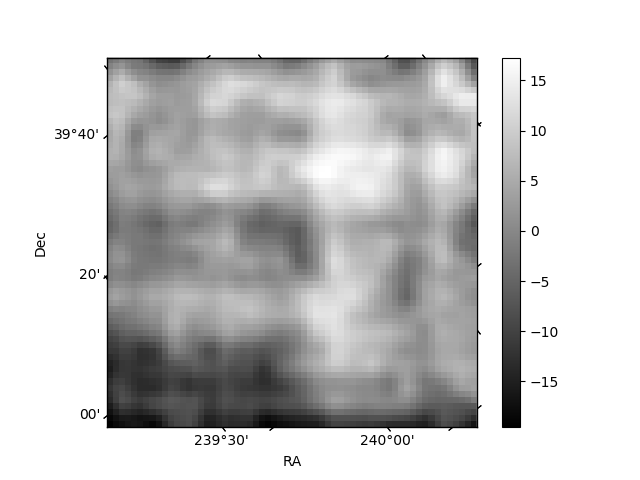
| Quadrant D | 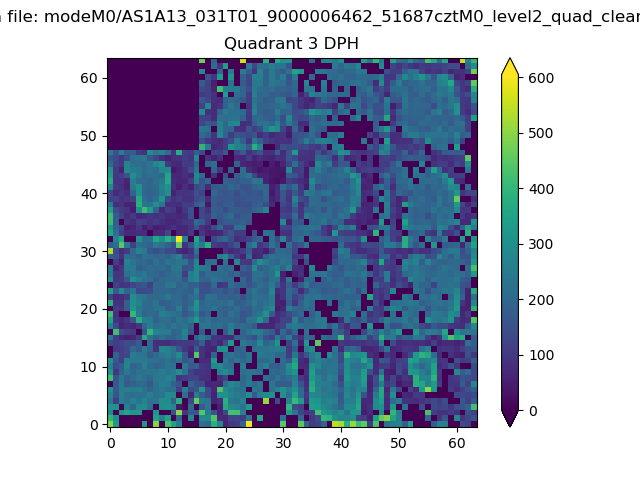 |
 |
Quadrant C |
| Plot type | Count rate plots | Images |
|---|---|---|
| Comparison with Poisson distribution Blue bars denote a histogram of data divided into 1 sec bins. Red curve is a Poisson curve with rate = median count rate of data. |
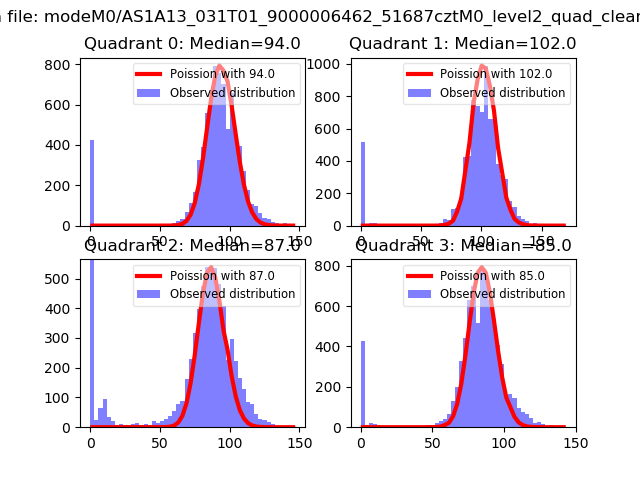 |
 |
| Quadrant-wise count rates Data is divided into 100 sec bins |
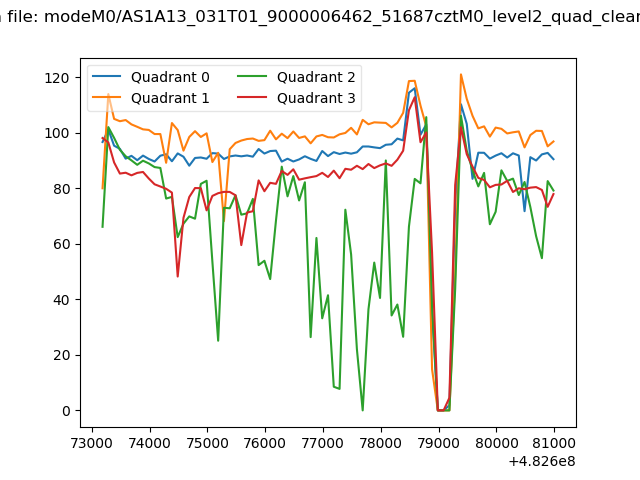 |
|
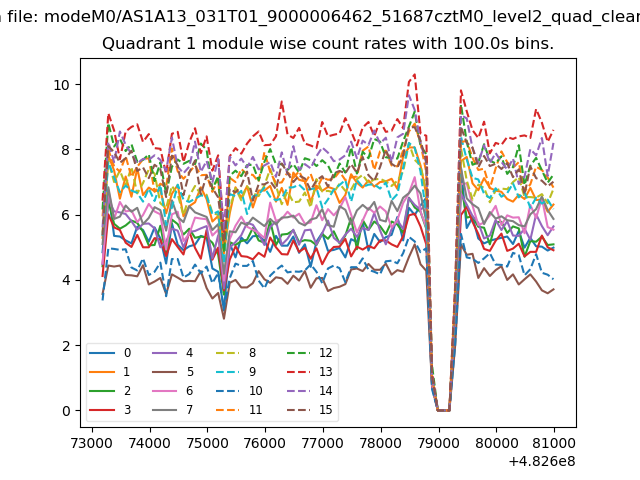
| Module-wise count rates for Quadrant A Data is divided into 100 sec bins |
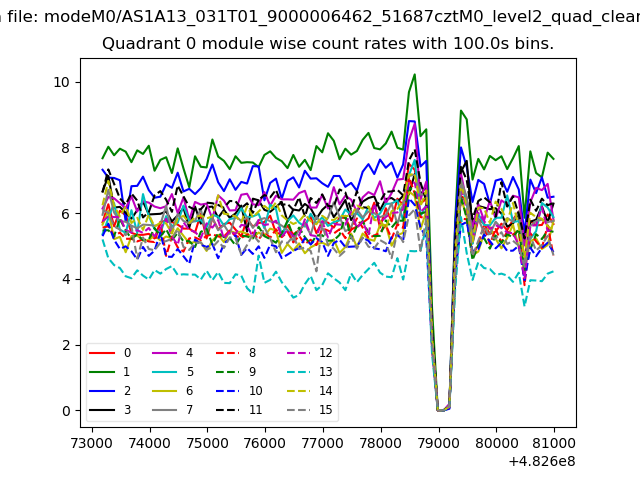 |
 |
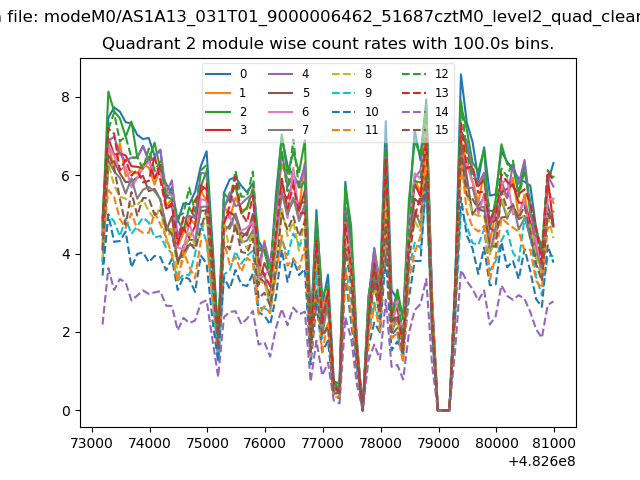
| Module-wise count rates for Quadrant B Data is divided into 100 sec bins |
 |
 |
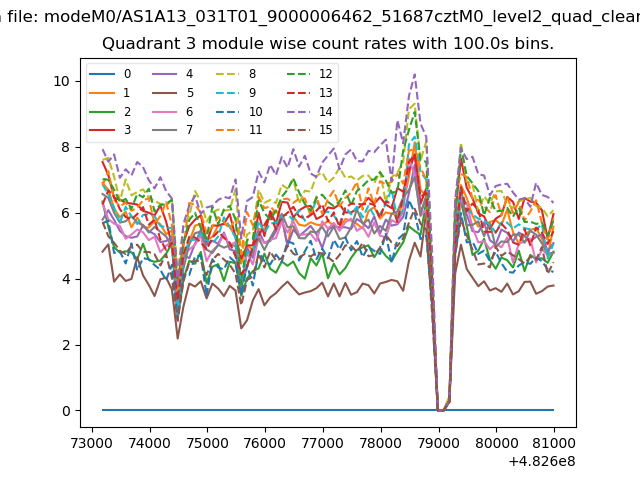
| Module-wise count rates for Quadrant C Data is divided into 100 sec bins |
 |
 |
| Module-wise count rates for Quadrant D Data is divided into 100 sec bins |
 |
 |
| Parameter | Plot |
|---|---|
| CZT HV Monitor | 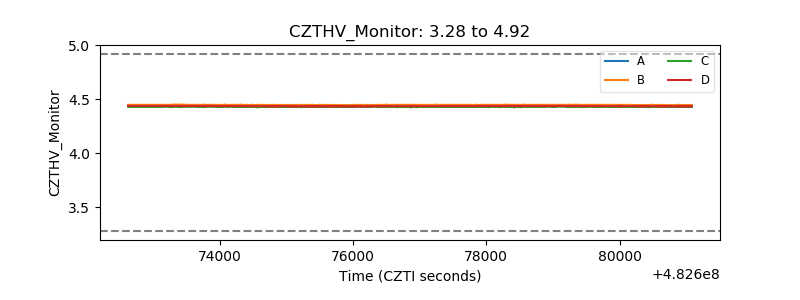 |
| D_VDD | 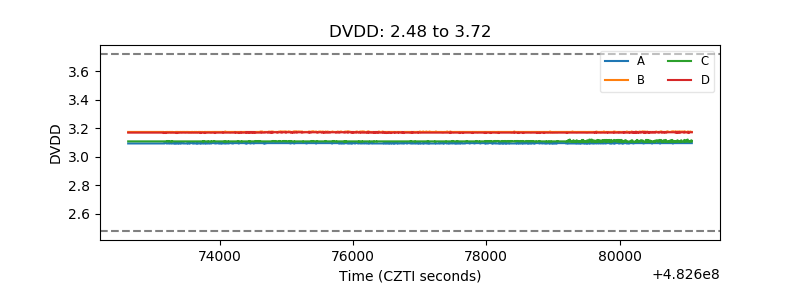 |
| Temperature 1 | 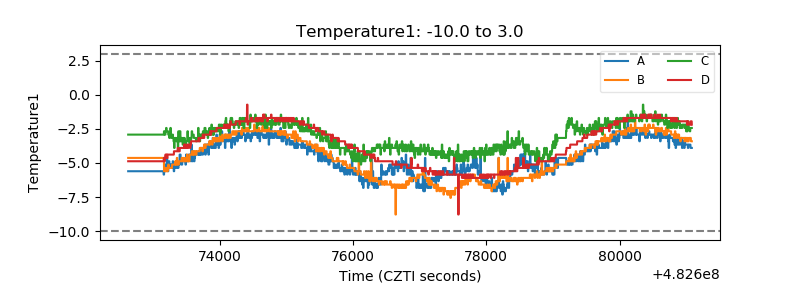 |
| Veto HV Monitor | 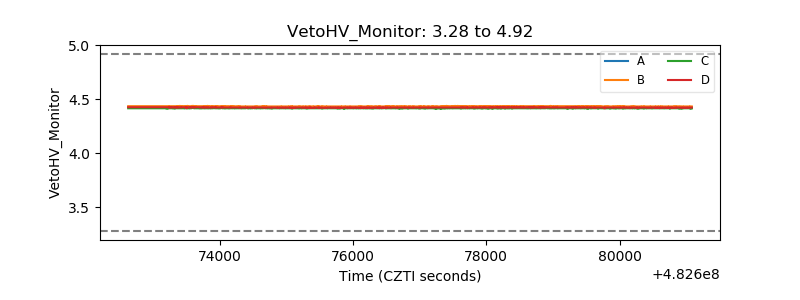 |
| Veto LLD | 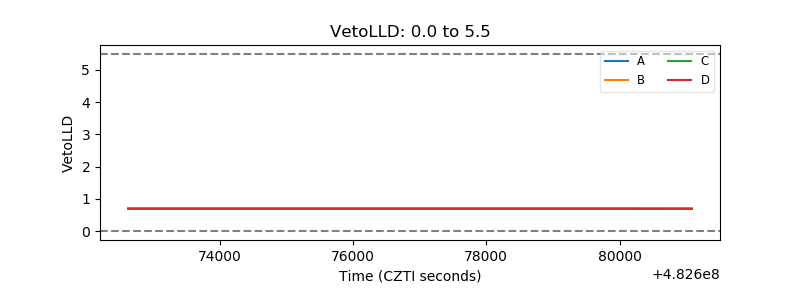 |
| Alpha Counter | 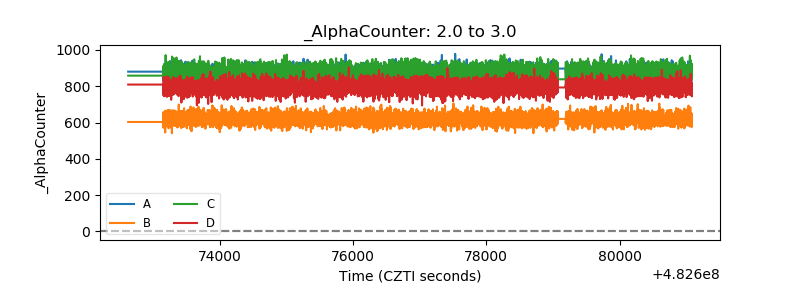 |
| _CPM_Rate | 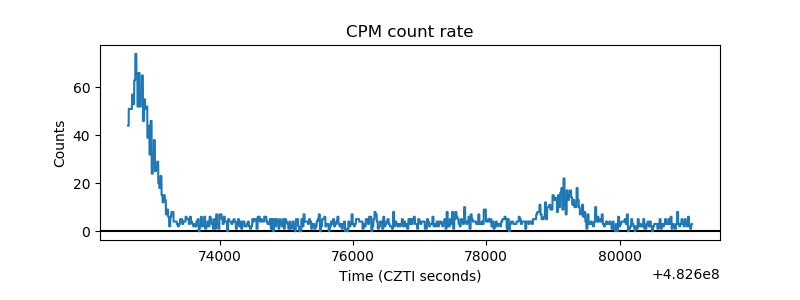 |
| CZT Counter | 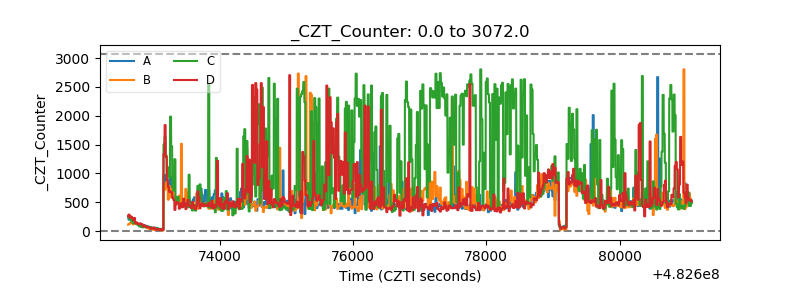 |
| +2.5 Volts monitor | 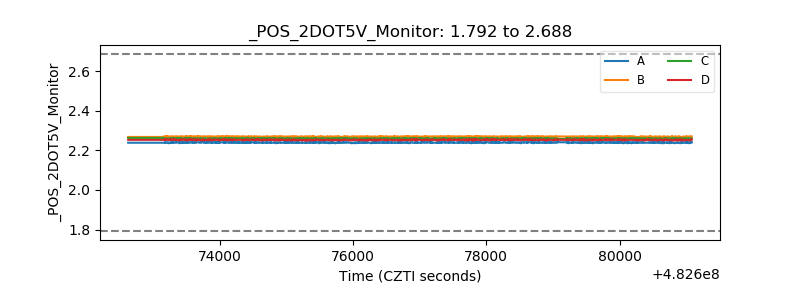 |
| +5 Volts monitor | 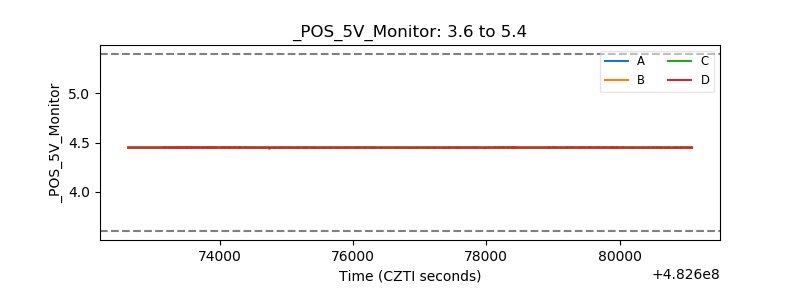 |
| _ROLL_ROT | 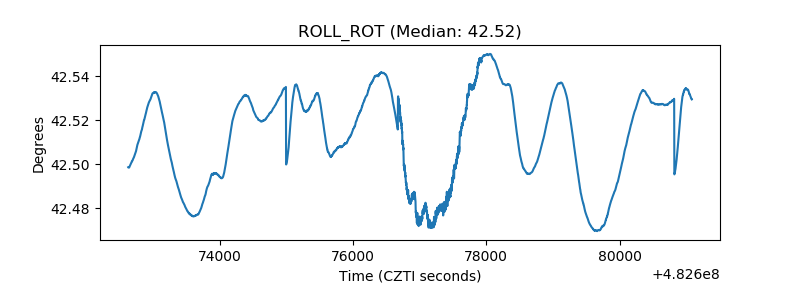 |
| _Roll_DEC | 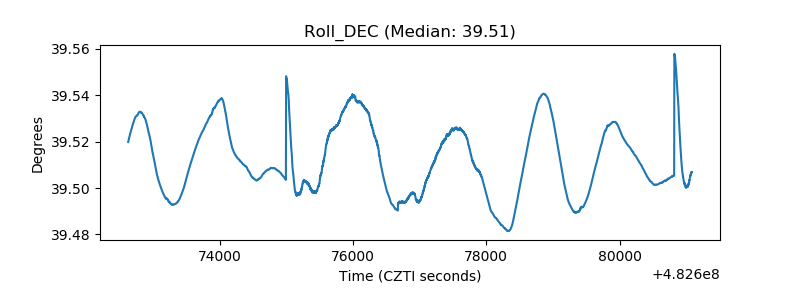 |
| _Roll_RA | 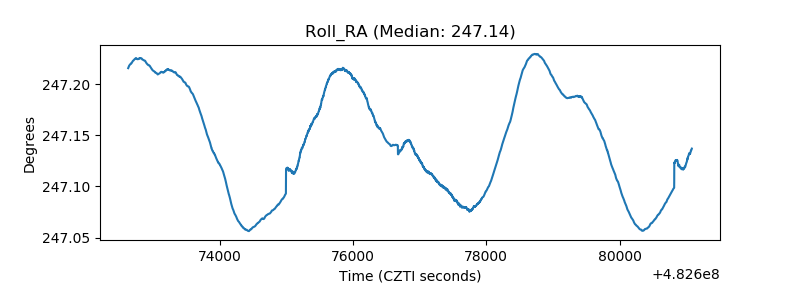 |
| Veto Counter | 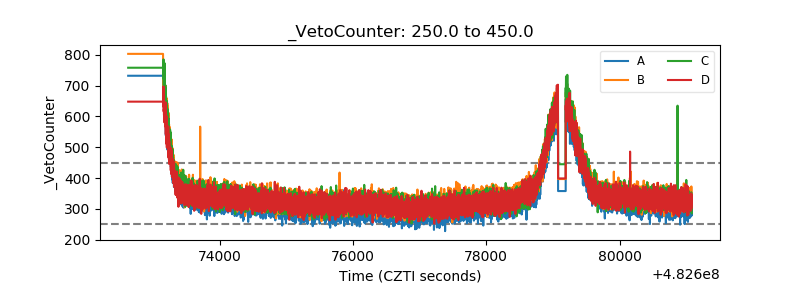 |