| Param | Original file | Final file |
|---|---|---|
| Filename | modeM0/AS1A13_031T01_9000006462_51688cztM0_level2.fits | modeM0/AS1A13_031T01_9000006462_51688cztM0_level2_quad_clean.evt |
| Size (bytes) | 661,855,680 | 112,383,360 |
| Size | 631.2 MB | 107.2 MB |
| Events in quadrant A | 4,867,200 | 751,508 |
| Events in quadrant B | 4,447,525 | 809,741 |
| Events in quadrant C | 9,566,053 | 574,582 |
| Events in quadrant D | 4,970,031 | 686,092 |
| Mode M9 | |||
|---|---|---|---|
| Quadrant | BADHDUFLAG | Total packets | Discarded packets |
| A | 0 | 1 | 0 |
| B | 0 | 1 | 0 |
| C | 0 | 1 | 0 |
| D | 0 | 1 | 0 |
| Mode M0 | |||
|---|---|---|---|
| Quadrant | BADHDUFLAG | Total packets | Discarded packets |
| A | 0 | 20162 | 1 |
| B | 0 | 18982 | 1 |
| C | 0 | 34252 | 1 |
| D | 0 | 20524 | 1 |
| Mode SS | |||
|---|---|---|---|
| Quadrant | BADHDUFLAG | Total packets | Discarded packets |
| A | 0 | 170 | 0 |
| B | 0 | 170 | 0 |
| C | 0 | 170 | 0 |
| D | 0 | 170 | 0 |
| Quadrant | Total seconds | Saturated seconds | Saturation percentage |
|---|---|---|---|
| A | 8355 | 449 | 5.374028% |
| B | 8356 | 462 | 5.528961% |
| C | 8356 | 2258 | 27.022499% |
| D | 8356 | 368 | 4.404021% |
Noise dominated data is calculated using 1-second bins in cleaned event files. If a bin has >2000 counts, and if more than 50% of those come from <1% of pixels, then it is considered to be noise-dominated and hence unusable.
| Quadrant | # 1 sec bins | Bins with >0 counts | Bins with >2000 counts | High rate bins dominated by noise | Noise dominated (total time) | Noise dominated (detector-on time) | Marked lightcurve |
|---|---|---|---|---|---|---|---|
| A | 8470 | 8356 | 77 | 77 | 0.91% | 0.92% | 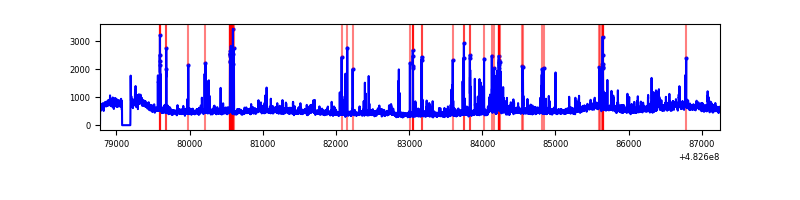 |
| B | 8471 | 8357 | 40 | 40 | 0.47% | 0.48% | 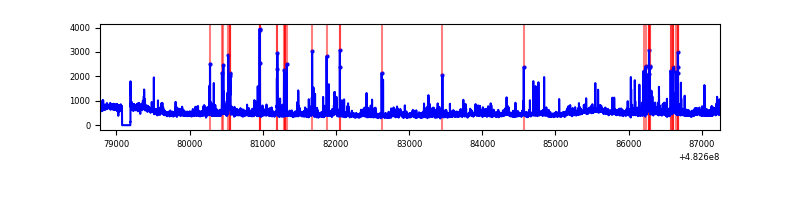 |
| C | 8471 | 8357 | 1639 | 1639 | 19.35% | 19.61% | 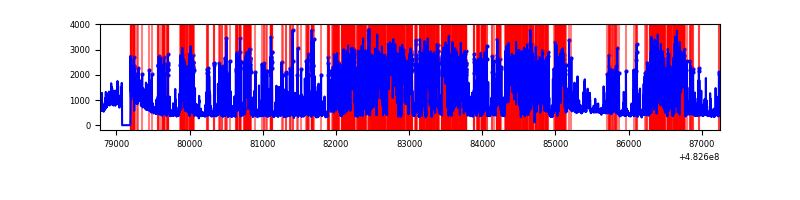 |
| D | 8471 | 8357 | 63 | 63 | 0.74% | 0.75% | 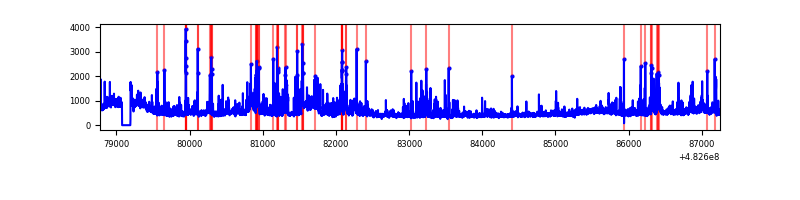 |
Top three noisy pixels from each quadrant. If the there are fewer than three noisy pixels in the level2.evt file, extra rows are filled as -1
| Pixel properties | Quadrant properties | ||||||
|---|---|---|---|---|---|---|---|
| Quadrant | DetID | PixID | Counts | Sigma | Mean | Median | Sigma |
| A | 3 | 14 | 458756 | 2037.56 | 934 | 909 | 224.7 |
| A | 12 | 250 | 257985 | 1144.07 | 934 | 909 | 224.7 |
| A | 5 | 240 | 127853 | 564.94 | 934 | 909 | 224.7 |
| B | 0 | 171 | 207170 | 1044.46 | 922 | 888 | 197.5 |
| B | 8 | 128 | 142538 | 717.21 | 922 | 888 | 197.5 |
| B | 5 | 185 | 87994 | 441.04 | 922 | 888 | 197.5 |
| C | 15 | 189 | 4278843 | 19588.0 | 817 | 811 | 218.4 |
| C | 0 | 192 | 756064 | 3458.11 | 817 | 811 | 218.4 |
| C | 13 | 3 | 507958 | 2322.09 | 817 | 811 | 218.4 |
| D | 10 | 172 | 381397 | 1514.21 | 914 | 882 | 251.3 |
| D | 3 | 12 | 327147 | 1298.33 | 914 | 882 | 251.3 |
| D | 2 | 249 | 146282 | 578.6 | 914 | 882 | 251.3 |
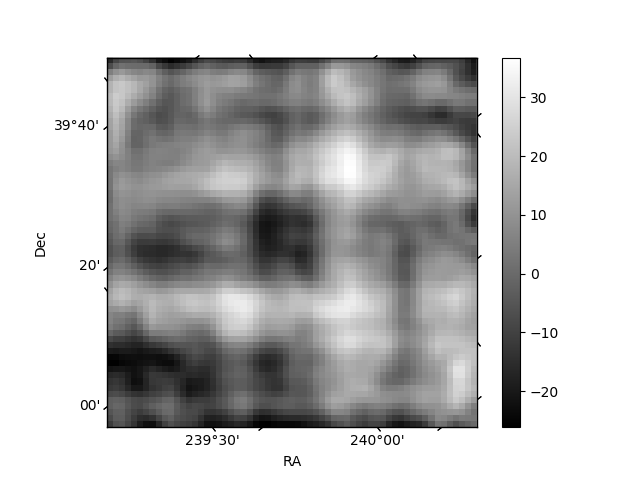
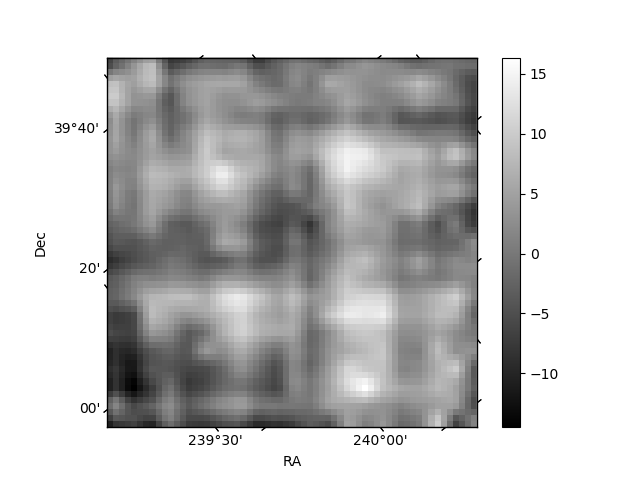
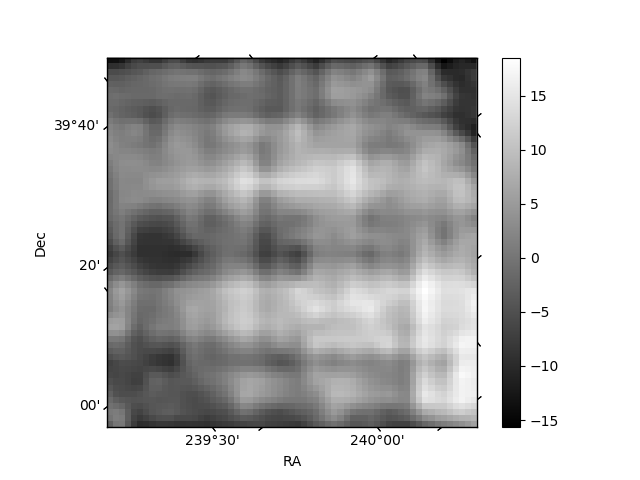
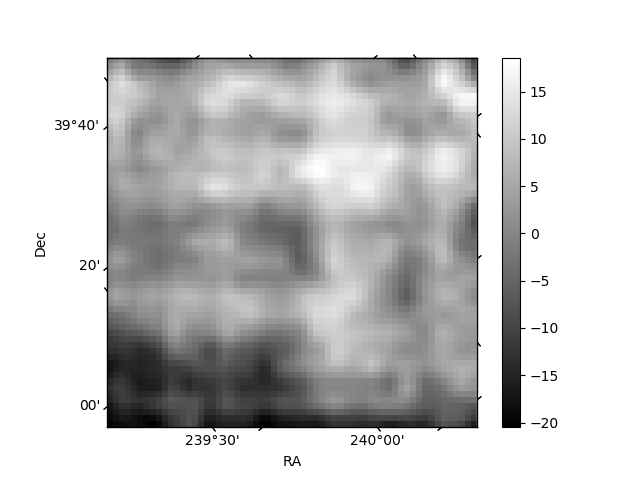
Histogram calculated using DETX and DETY for each event in the final _common_clean file
| Quadrant A | 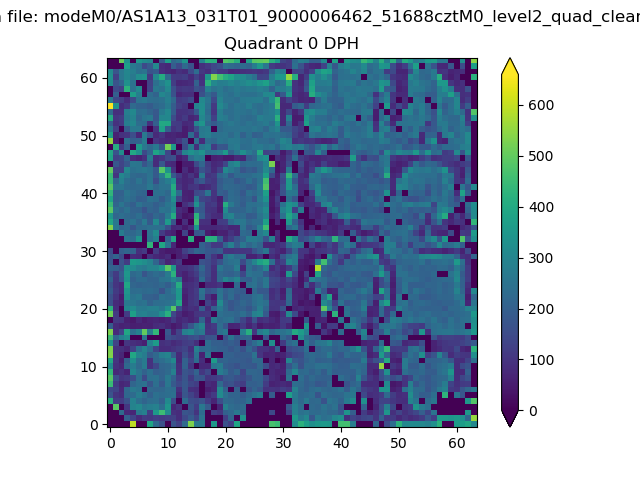 |
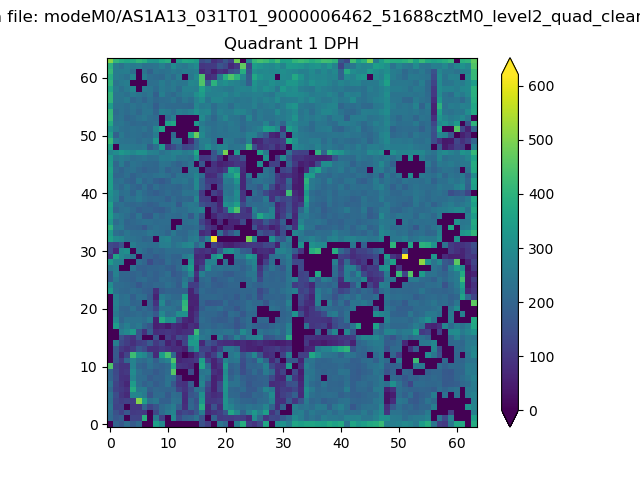 |
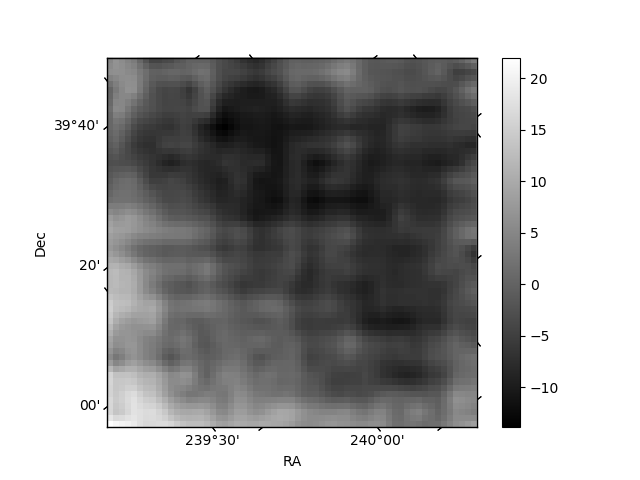
Quadrant B |
|---|---|---|---|
| Quadrant D | 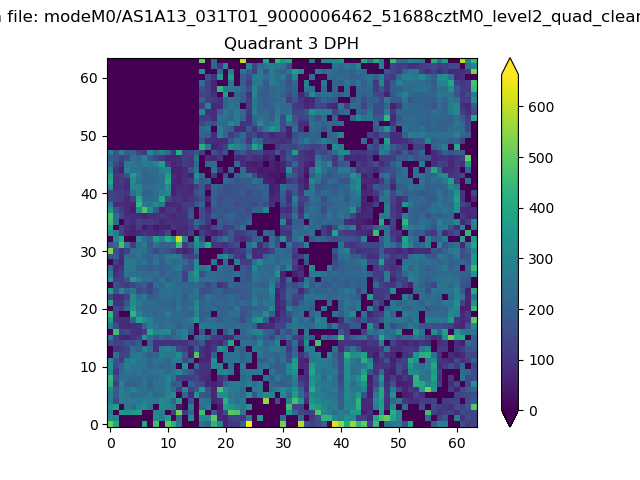 |
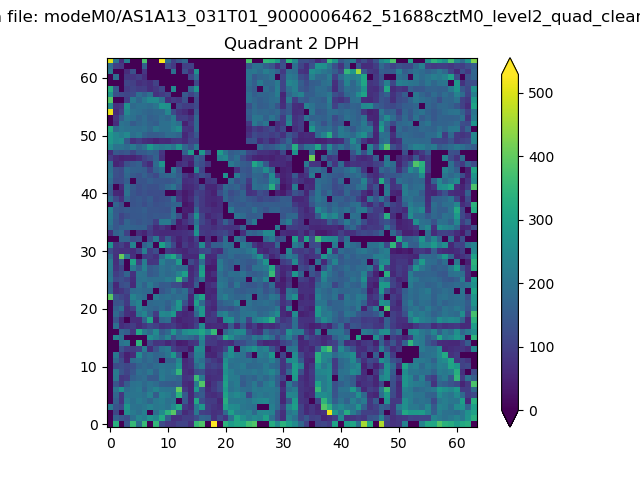 |
Quadrant C |
| Plot type | Count rate plots | Images |
|---|---|---|
| Comparison with Poisson distribution Blue bars denote a histogram of data divided into 1 sec bins. Red curve is a Poisson curve with rate = median count rate of data. |
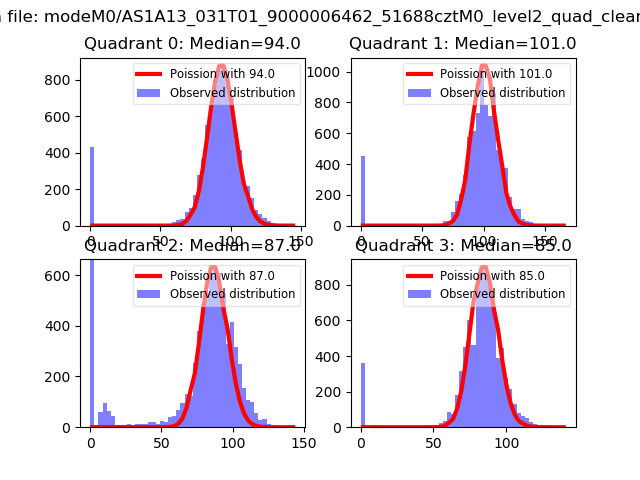 |
 |
| Quadrant-wise count rates Data is divided into 100 sec bins |
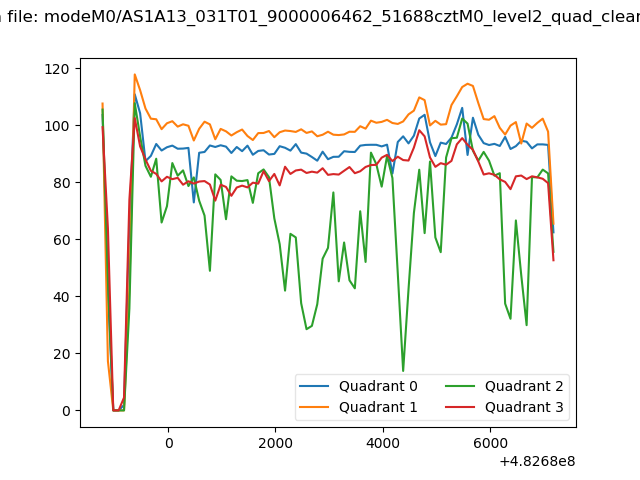 |
|
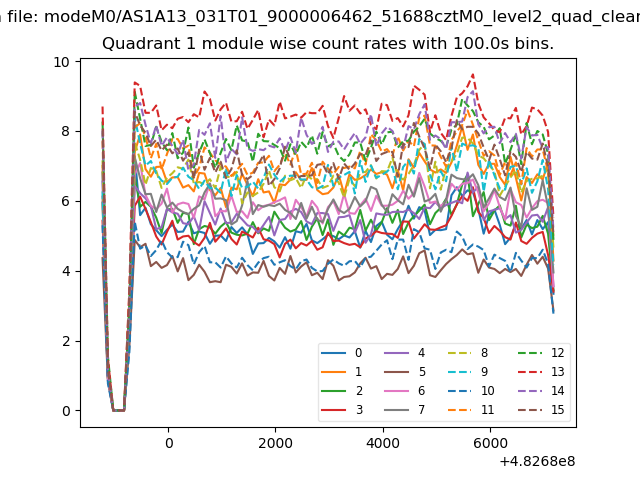
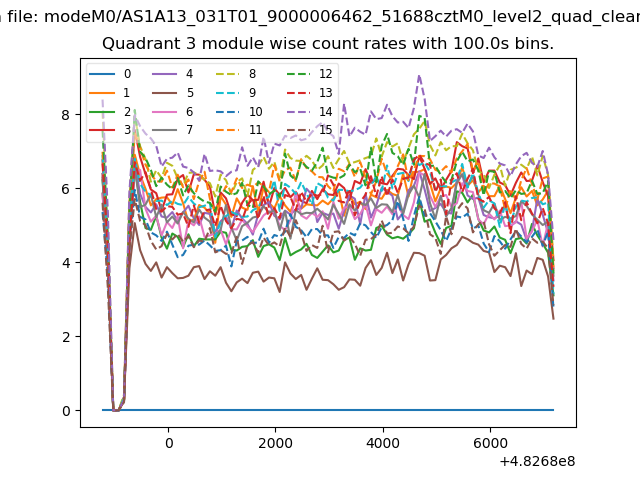
| Module-wise count rates for Quadrant A Data is divided into 100 sec bins |
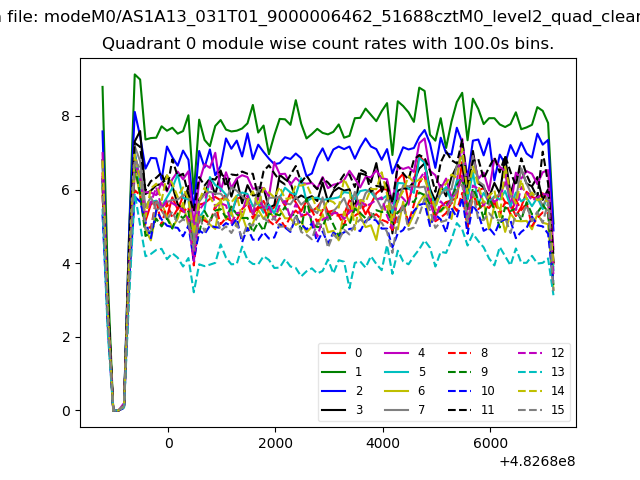 |
 |
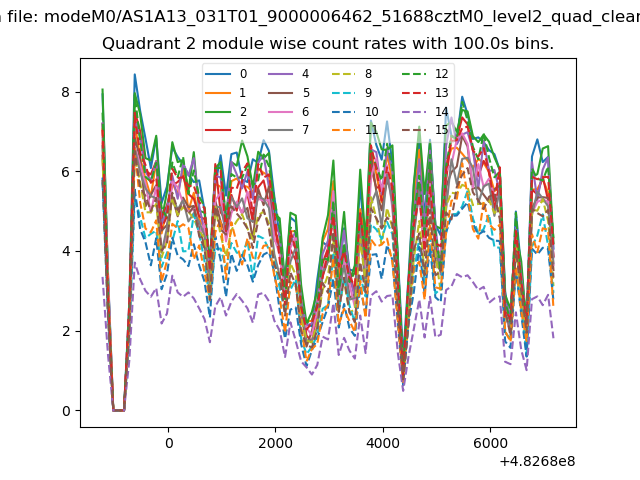
| Module-wise count rates for Quadrant B Data is divided into 100 sec bins |
 |
 |
| Module-wise count rates for Quadrant C Data is divided into 100 sec bins |
 |
 |
| Module-wise count rates for Quadrant D Data is divided into 100 sec bins |
 |
 |
| Parameter | Plot |
|---|---|
| CZT HV Monitor |  |
| D_VDD | 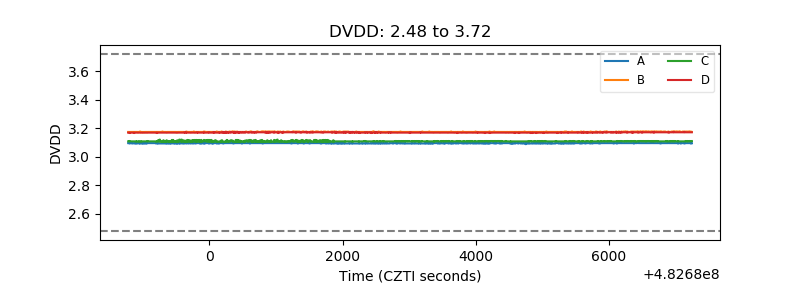 |
| Temperature 1 |  |
| Veto HV Monitor | 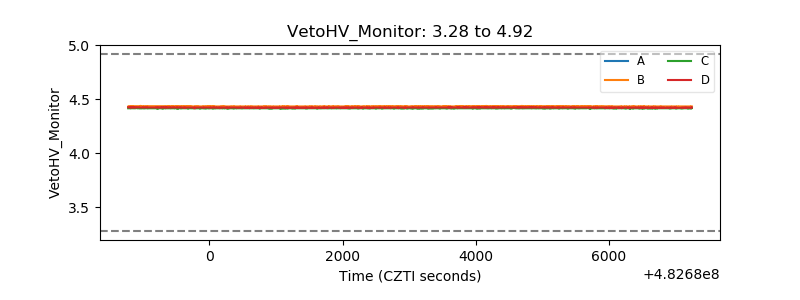 |
| Veto LLD | 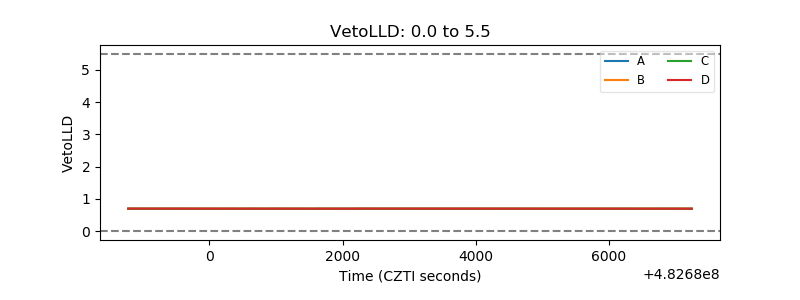 |
| Alpha Counter | 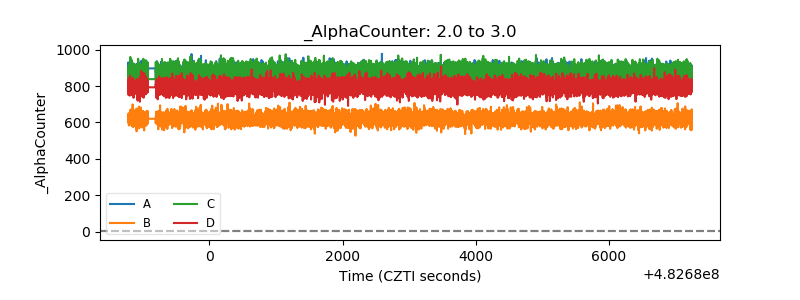 |
| _CPM_Rate | 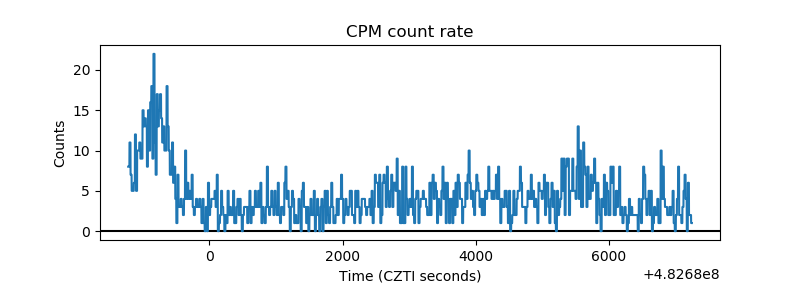 |
| CZT Counter | 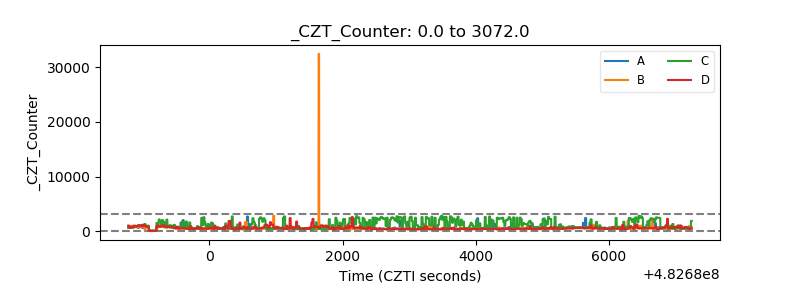 |
| +2.5 Volts monitor | 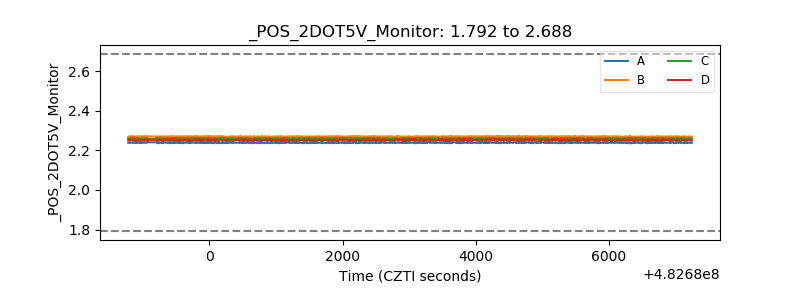 |
| +5 Volts monitor | 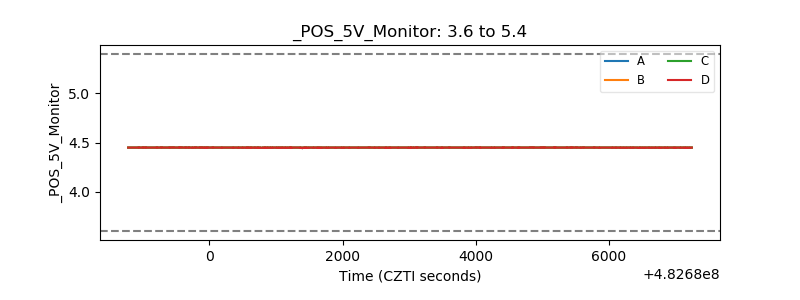 |
| _ROLL_ROT | 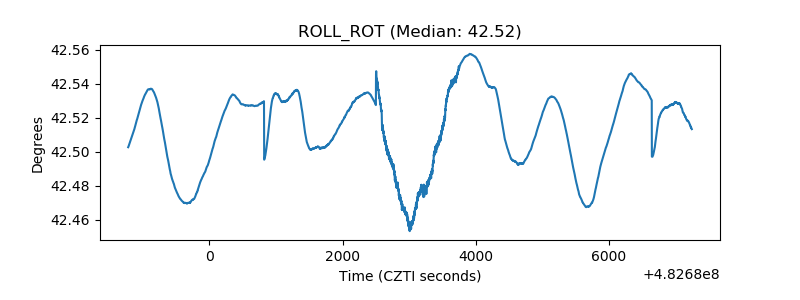 |
| _Roll_DEC | 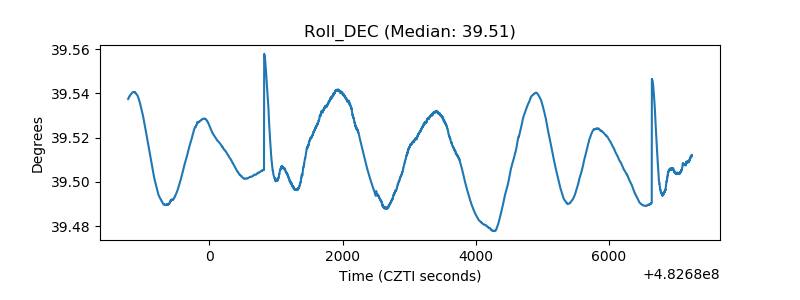 |
| _Roll_RA | 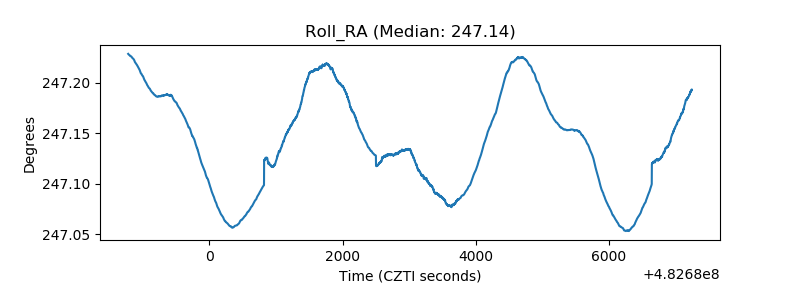 |
| Veto Counter | 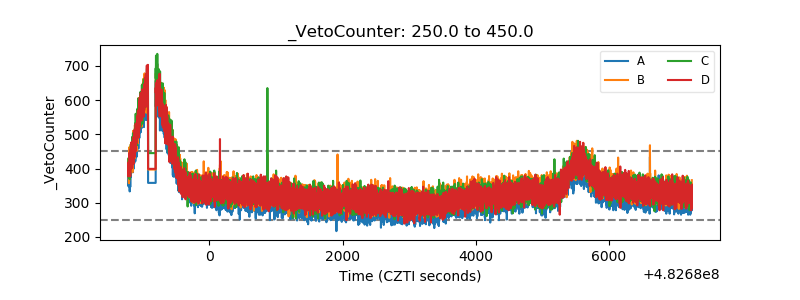 |