| Param | Original file | Final file |
|---|---|---|
| Filename | modeM0/AS1A13_031T01_9000006462_51689cztM0_level2.fits | modeM0/AS1A13_031T01_9000006462_51689cztM0_level2_quad_clean.evt |
| Size (bytes) | 705,078,720 | 119,050,560 |
| Size | 672.4 MB | 113.5 MB |
| Events in quadrant A | 6,653,544 | 788,802 |
| Events in quadrant B | 4,657,613 | 865,412 |
| Events in quadrant C | 7,590,560 | 684,745 |
| Events in quadrant D | 6,533,495 | 669,846 |
| Mode M0 | |||
|---|---|---|---|
| Quadrant | BADHDUFLAG | Total packets | Discarded packets |
| A | 0 | 25658 | 2 |
| B | 0 | 19738 | 0 |
| C | 0 | 28555 | 0 |
| D | 0 | 25448 | 0 |
| Mode SS | |||
|---|---|---|---|
| Quadrant | BADHDUFLAG | Total packets | Discarded packets |
| A | 0 | 172 | 0 |
| B | 0 | 172 | 0 |
| C | 0 | 172 | 0 |
| D | 0 | 172 | 0 |
| Quadrant | Total seconds | Saturated seconds | Saturation percentage |
|---|---|---|---|
| A | 8575 | 295 | 3.440233% |
| B | 8576 | 99 | 1.154384% |
| C | 8576 | 1222 | 14.249067% |
| D | 8576 | 738 | 8.605410% |
Noise dominated data is calculated using 1-second bins in cleaned event files. If a bin has >2000 counts, and if more than 50% of those come from <1% of pixels, then it is considered to be noise-dominated and hence unusable.
| Quadrant | # 1 sec bins | Bins with >0 counts | Bins with >2000 counts | High rate bins dominated by noise | Noise dominated (total time) | Noise dominated (detector-on time) | Marked lightcurve |
|---|---|---|---|---|---|---|---|
| A | 8575 | 8575 | 208 | 208 | 2.43% | 2.43% | 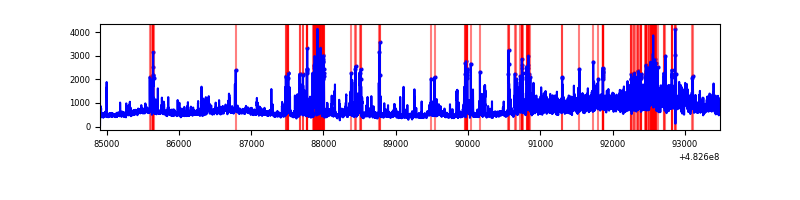 |
| B | 8576 | 8576 | 39 | 39 | 0.45% | 0.45% | 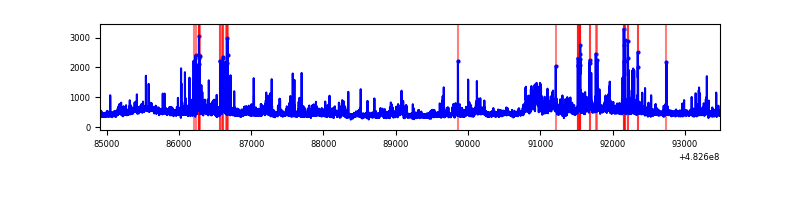 |
| C | 8576 | 8576 | 929 | 929 | 10.83% | 10.83% | 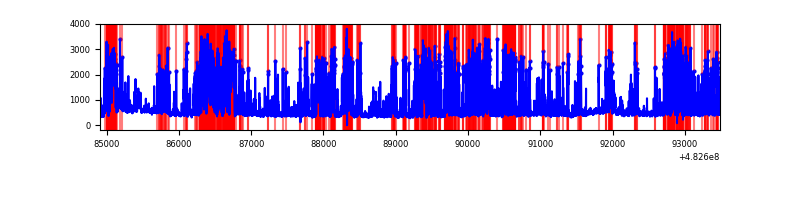 |
| D | 8576 | 8576 | 668 | 668 | 7.79% | 7.79% | 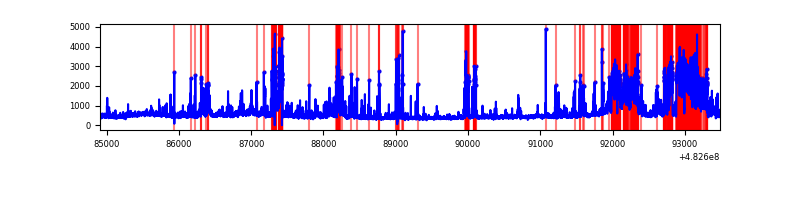 |
Top three noisy pixels from each quadrant. If the there are fewer than three noisy pixels in the level2.evt file, extra rows are filled as -1
| Pixel properties | Quadrant properties | ||||||
|---|---|---|---|---|---|---|---|
| Quadrant | DetID | PixID | Counts | Sigma | Mean | Median | Sigma |
| A | 3 | 14 | 1642455 | 7310.82 | 915 | 894 | 224.5 |
| A | 12 | 250 | 329021 | 1461.34 | 915 | 894 | 224.5 |
| A | 7 | 206 | 276954 | 1229.45 | 915 | 894 | 224.5 |
| B | 10 | 254 | 281132 | 1426.66 | 917 | 884 | 196.4 |
| B | 0 | 171 | 197799 | 1002.44 | 917 | 884 | 196.4 |
| B | 5 | 185 | 86457 | 435.63 | 917 | 884 | 196.4 |
| C | 15 | 189 | 3213701 | 14134.09 | 843 | 837 | 227.3 |
| C | 13 | 3 | 404342 | 1775.11 | 843 | 837 | 227.3 |
| C | 15 | 231 | 181593 | 795.19 | 843 | 837 | 227.3 |
| D | 3 | 12 | 1157462 | 4896.39 | 855 | 824 | 236.2 |
| D | 7 | 60 | 446460 | 1886.51 | 855 | 824 | 236.2 |
| D | 7 | 159 | 299097 | 1262.68 | 855 | 824 | 236.2 |
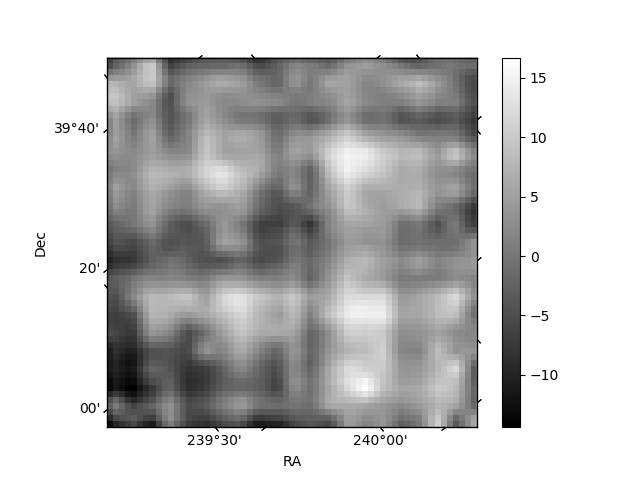
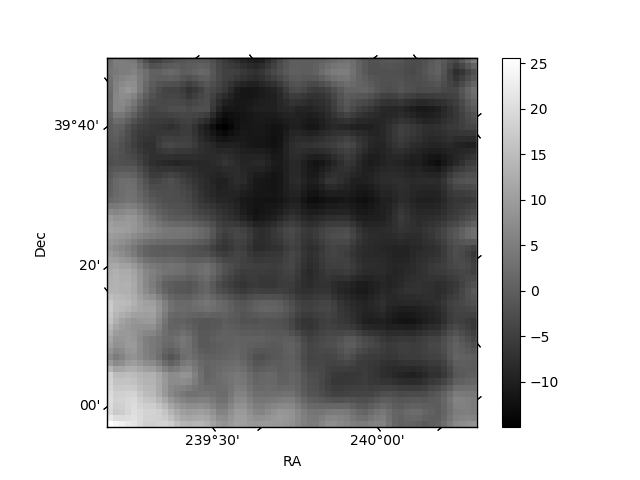
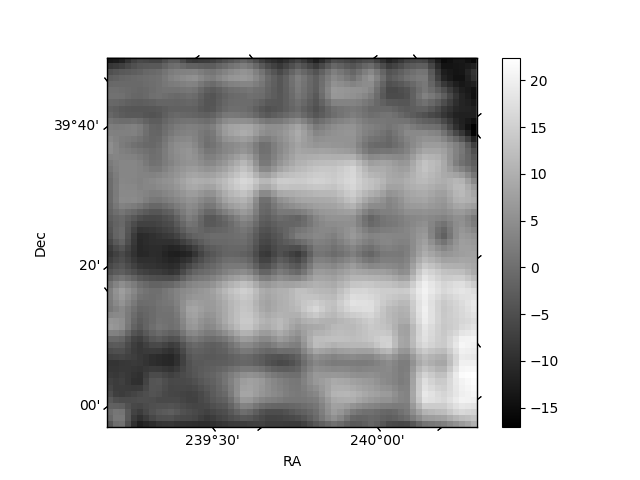
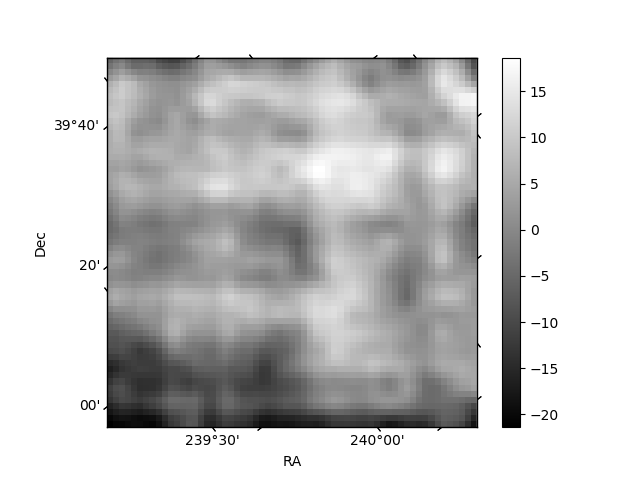
Histogram calculated using DETX and DETY for each event in the final _common_clean file
| Quadrant A | 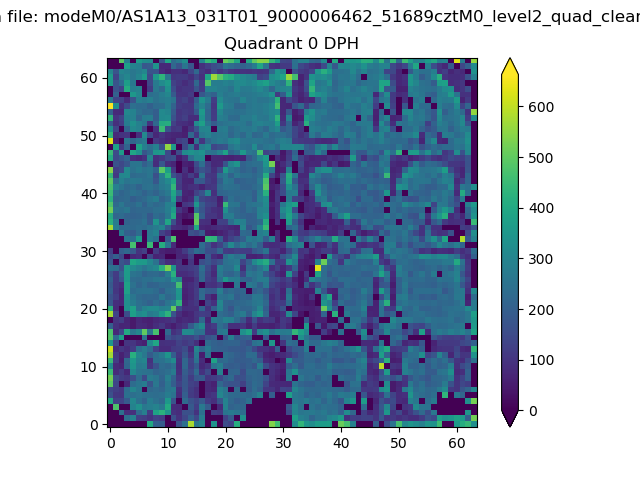 |
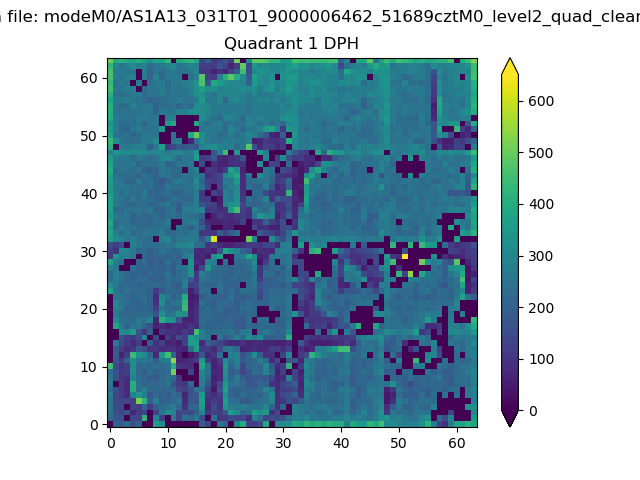 |
Quadrant B |
|---|---|---|---|
| Quadrant D | 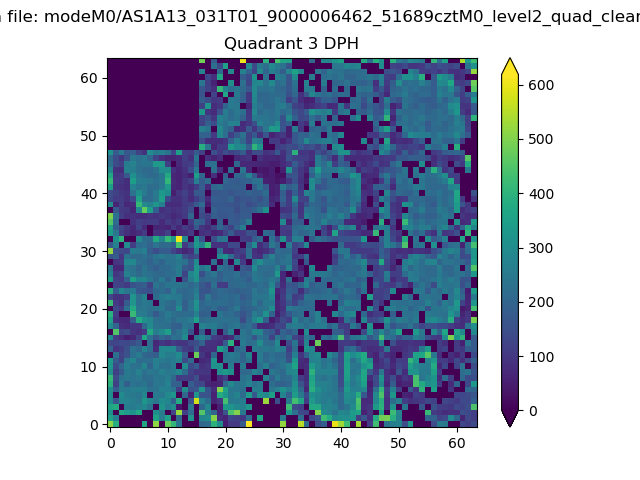 |
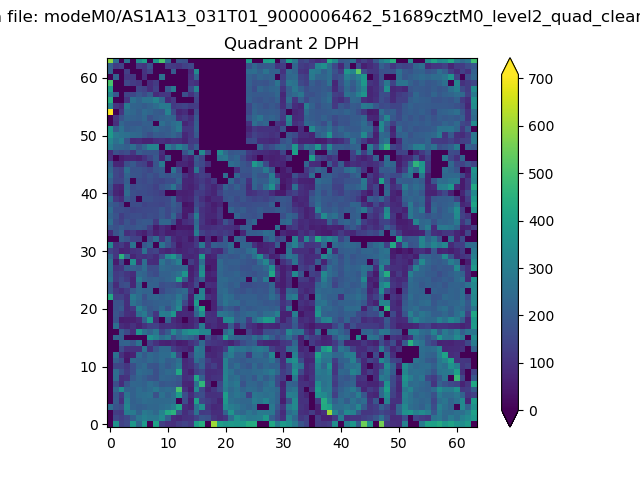 |
Quadrant C |
| Plot type | Count rate plots | Images |
|---|---|---|
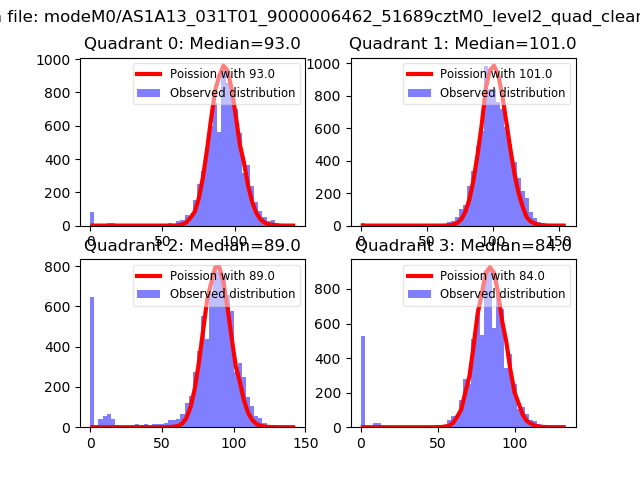
| Comparison with Poisson distribution Blue bars denote a histogram of data divided into 1 sec bins. Red curve is a Poisson curve with rate = median count rate of data. |
 |
 |
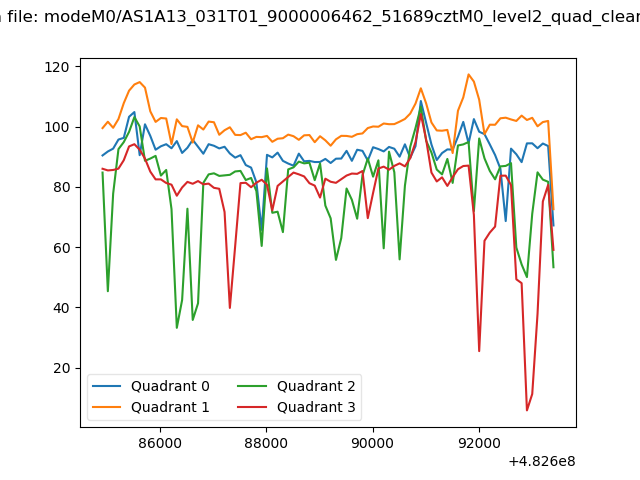
| Quadrant-wise count rates Data is divided into 100 sec bins |
 |
|
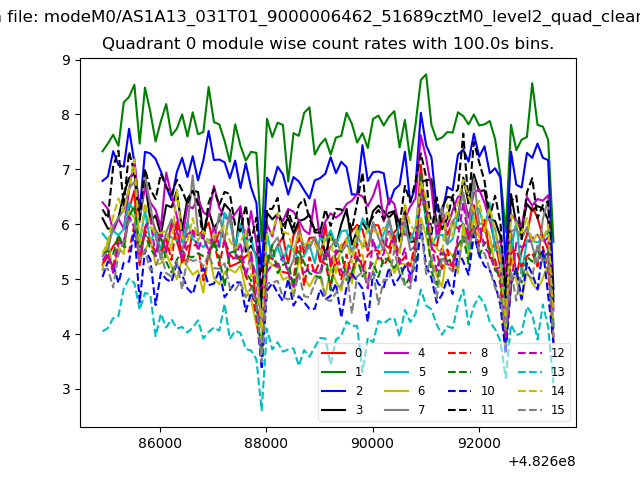
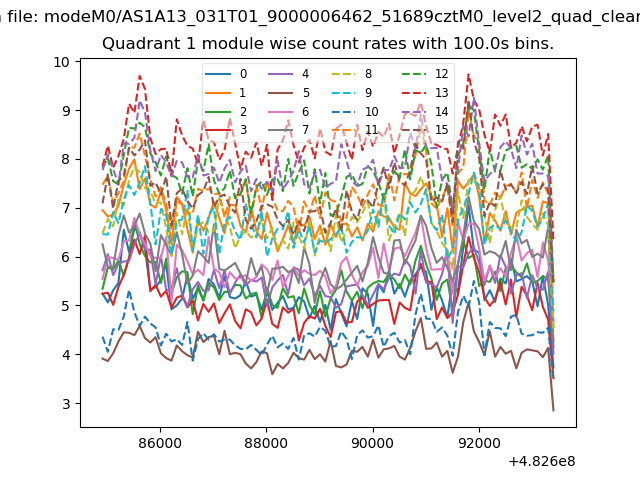
| Module-wise count rates for Quadrant A Data is divided into 100 sec bins |
 |
 |
| Module-wise count rates for Quadrant B Data is divided into 100 sec bins |
 |
 |
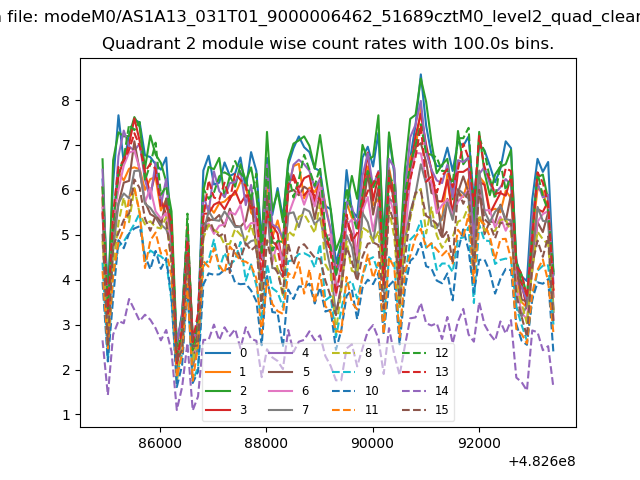
| Module-wise count rates for Quadrant C Data is divided into 100 sec bins |
 |
 |
| Module-wise count rates for Quadrant D Data is divided into 100 sec bins |
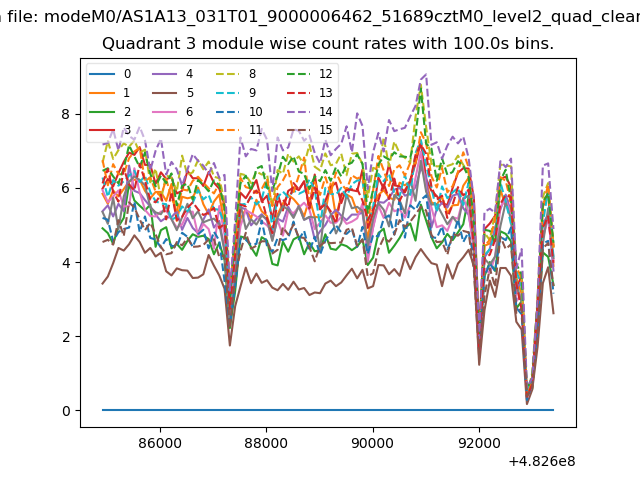 |
 |
| Parameter | Plot |
|---|---|
| CZT HV Monitor |  |
| D_VDD | 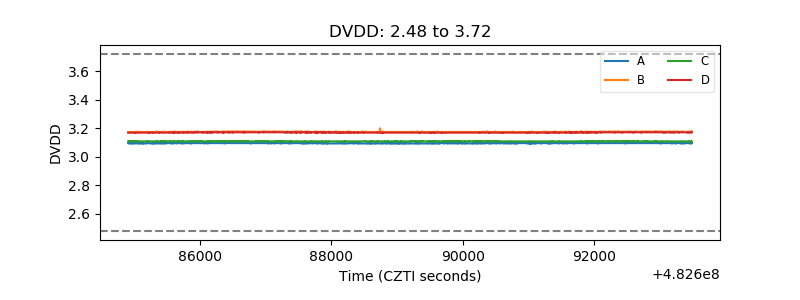 |
| Temperature 1 | 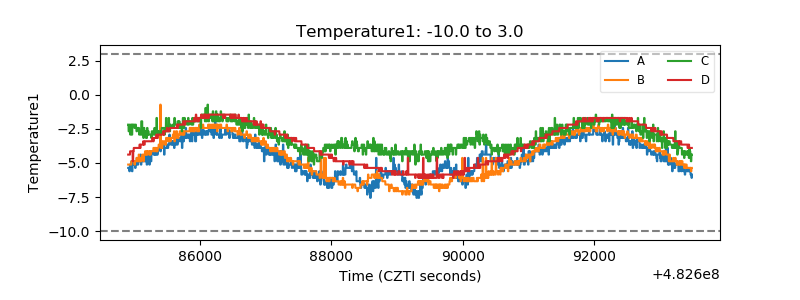 |
| Veto HV Monitor | 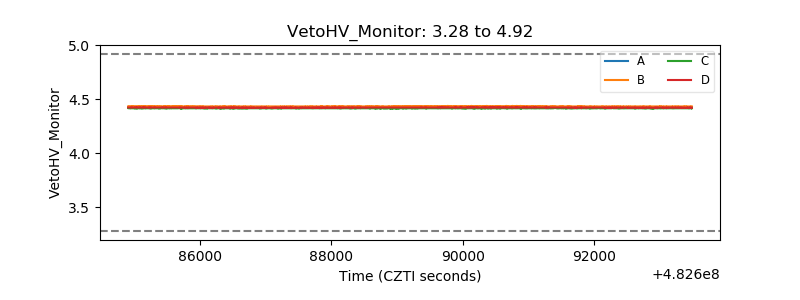 |
| Veto LLD | 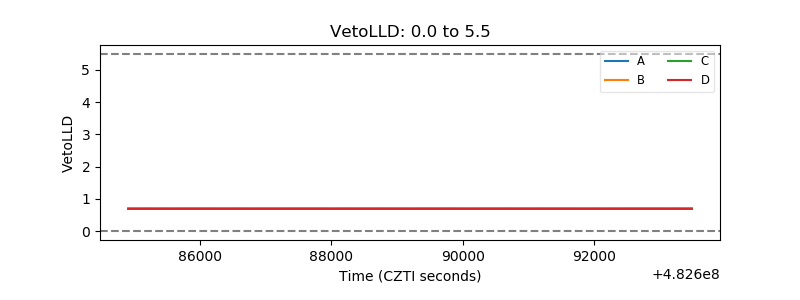 |
| Alpha Counter | 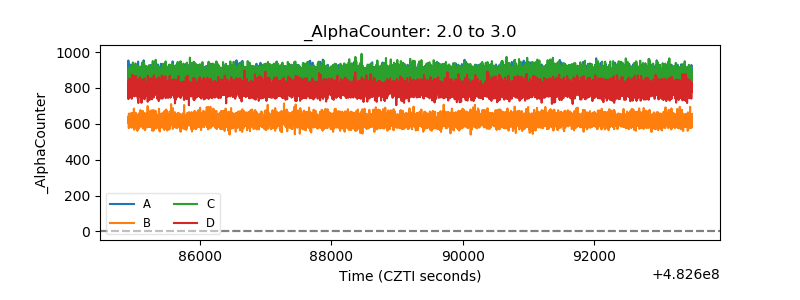 |
| _CPM_Rate | 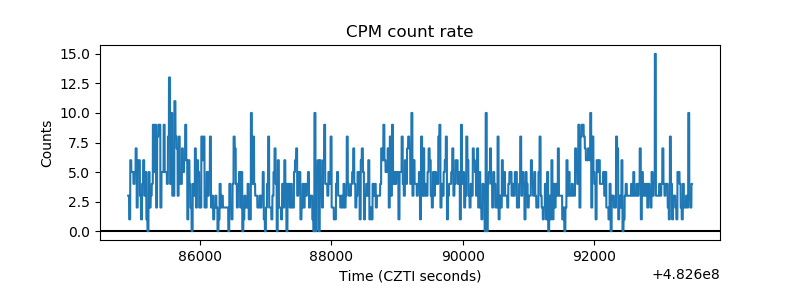 |
| CZT Counter | 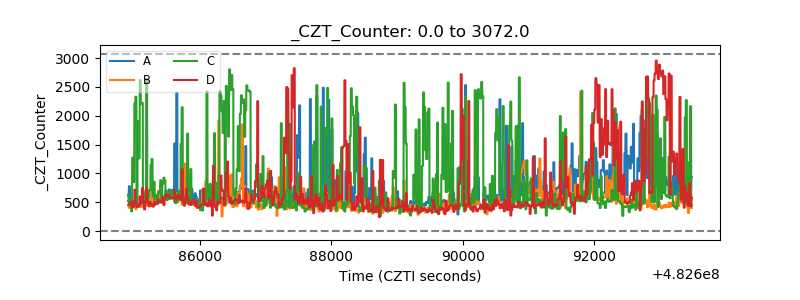 |
| +2.5 Volts monitor | 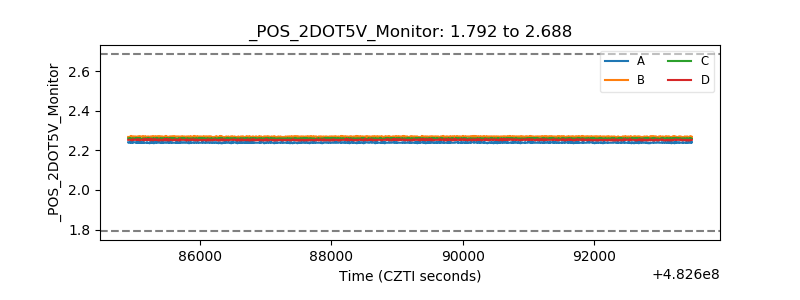 |
| +5 Volts monitor | 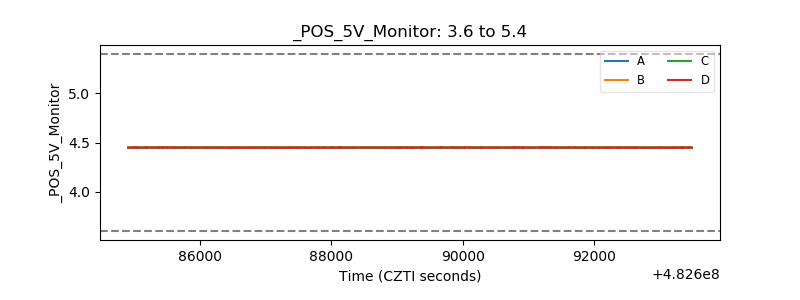 |
| _ROLL_ROT | 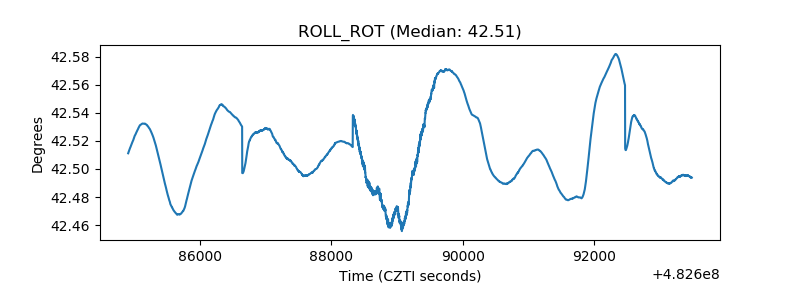 |
| _Roll_DEC | 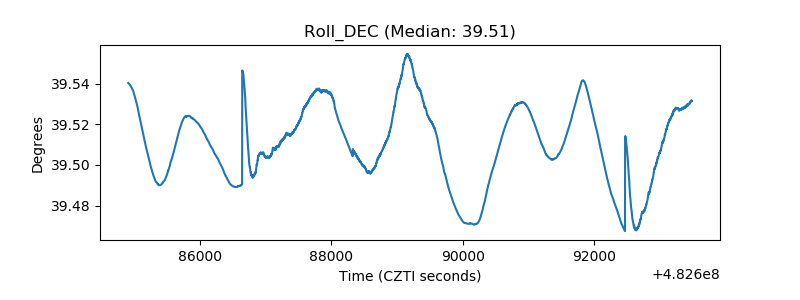 |
| _Roll_RA | 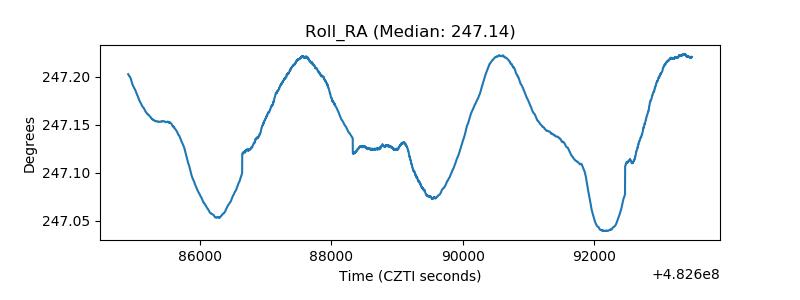 |
| Veto Counter | 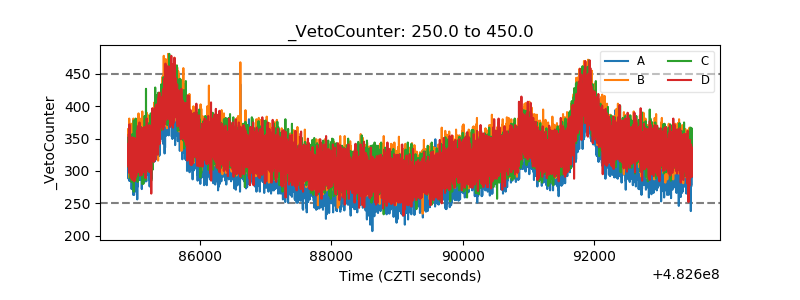 |