| Param | Original file | Final file |
|---|---|---|
| Filename | modeM0/AS1A13_031T01_9000006462_51692cztM0_level2.fits | modeM0/AS1A13_031T01_9000006462_51692cztM0_level2_quad_clean.evt |
| Size (bytes) | 1,642,968,000 | 277,295,040 |
| Size | 1.5 GB | 264.4 MB |
| Events in quadrant A | 14,976,362 | 1,833,693 |
| Events in quadrant B | 11,498,716 | 2,011,805 |
| Events in quadrant C | 18,412,377 | 1,547,755 |
| Events in quadrant D | 14,365,228 | 1,607,176 |
| Mode M9 | |||
|---|---|---|---|
| Quadrant | BADHDUFLAG | Total packets | Discarded packets |
| A | 0 | 10 | 0 |
| B | 0 | 10 | 0 |
| C | 0 | 10 | 0 |
| D | 0 | 10 | 0 |
| Mode M0 | |||
|---|---|---|---|
| Quadrant | BADHDUFLAG | Total packets | Discarded packets |
| A | 0 | 58765 | 4 |
| B | 0 | 48311 | 3 |
| C | 0 | 69119 | 3 |
| D | 0 | 57296 | 3 |
| Mode SS | |||
|---|---|---|---|
| Quadrant | BADHDUFLAG | Total packets | Discarded packets |
| A | 0 | 408 | 0 |
| B | 0 | 408 | 0 |
| C | 0 | 408 | 0 |
| D | 0 | 408 | 0 |
| Quadrant | Total seconds | Saturated seconds | Saturation percentage |
|---|---|---|---|
| A | 20259 | 545 | 2.690162% |
| B | 20259 | 425 | 2.097833% |
| C | 20259 | 3150 | 15.548645% |
| D | 20259 | 1164 | 5.745595% |
Noise dominated data is calculated using 1-second bins in cleaned event files. If a bin has >2000 counts, and if more than 50% of those come from <1% of pixels, then it is considered to be noise-dominated and hence unusable.
| Quadrant | # 1 sec bins | Bins with >0 counts | Bins with >2000 counts | High rate bins dominated by noise | Noise dominated (total time) | Noise dominated (detector-on time) | Marked lightcurve |
|---|---|---|---|---|---|---|---|
| A | 21154 | 20262 | 225 | 225 | 1.06% | 1.11% | 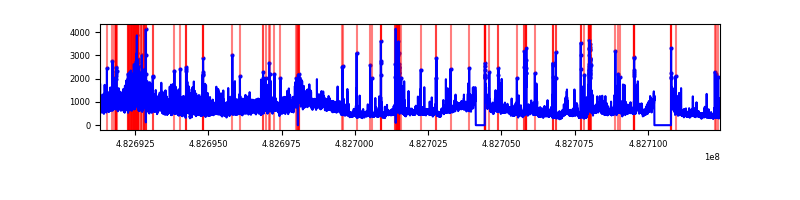 |
| B | 21154 | 20262 | 257 | 257 | 1.21% | 1.27% | 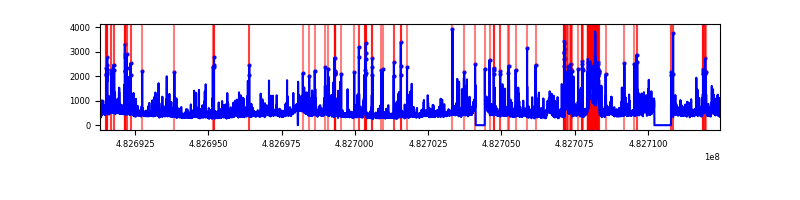 |
| C | 21154 | 20261 | 2357 | 2357 | 11.14% | 11.63% | 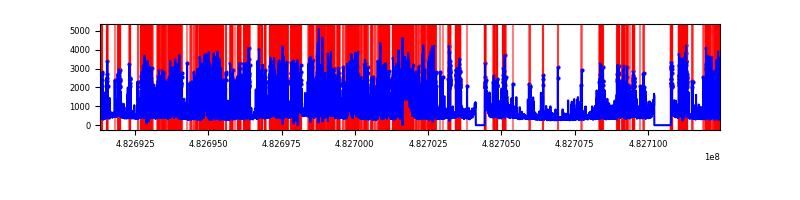 |
| D | 21154 | 20262 | 1003 | 1003 | 4.74% | 4.95% | 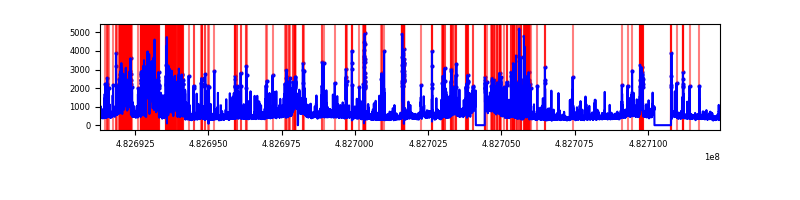 |
Top three noisy pixels from each quadrant. If the there are fewer than three noisy pixels in the level2.evt file, extra rows are filled as -1
| Pixel properties | Quadrant properties | ||||||
|---|---|---|---|---|---|---|---|
| Quadrant | DetID | PixID | Counts | Sigma | Mean | Median | Sigma |
| A | 3 | 14 | 4687193 | 8986.37 | 2128 | 2081 | 521.4 |
| A | 15 | 174 | 363784 | 693.77 | 2128 | 2081 | 521.4 |
| A | 4 | 3 | 266529 | 507.23 | 2128 | 2081 | 521.4 |
| B | 10 | 254 | 714780 | 1570.18 | 2130 | 2055 | 453.9 |
| B | 8 | 128 | 624849 | 1372.05 | 2130 | 2055 | 453.9 |
| B | 0 | 213 | 243951 | 532.91 | 2130 | 2055 | 453.9 |
| C | 15 | 189 | 4973649 | 9356.49 | 1966 | 1955 | 531.4 |
| C | 12 | 254 | 1491742 | 2803.71 | 1966 | 1955 | 531.4 |
| C | 15 | 147 | 1168284 | 2194.98 | 1966 | 1955 | 531.4 |
| D | 3 | 12 | 1757693 | 3155.88 | 2028 | 1953 | 556.3 |
| D | 7 | 60 | 1008495 | 1809.22 | 2028 | 1953 | 556.3 |
| D | 6 | 228 | 807303 | 1447.59 | 2028 | 1953 | 556.3 |
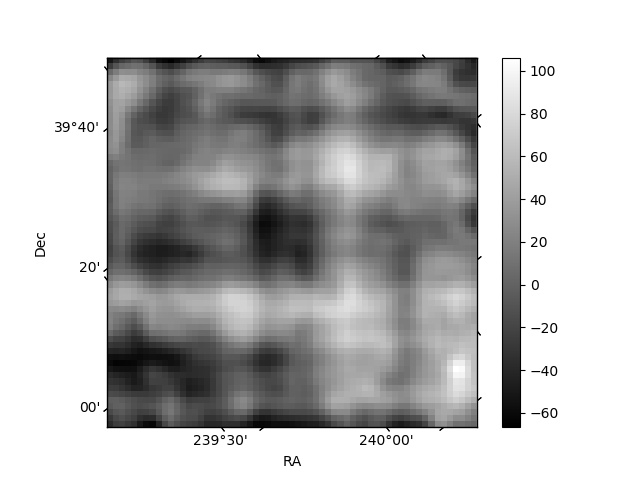
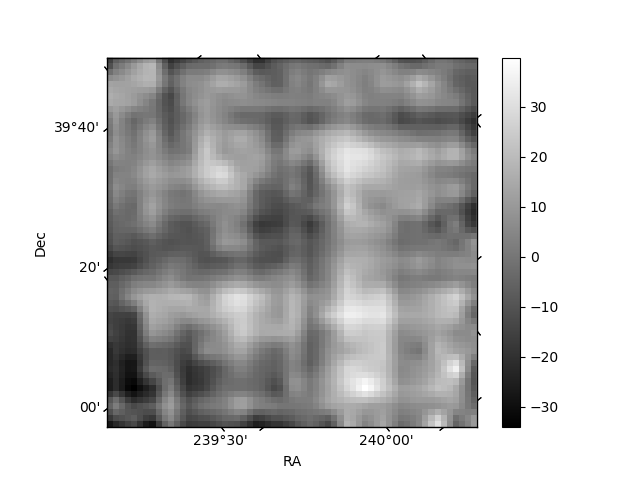
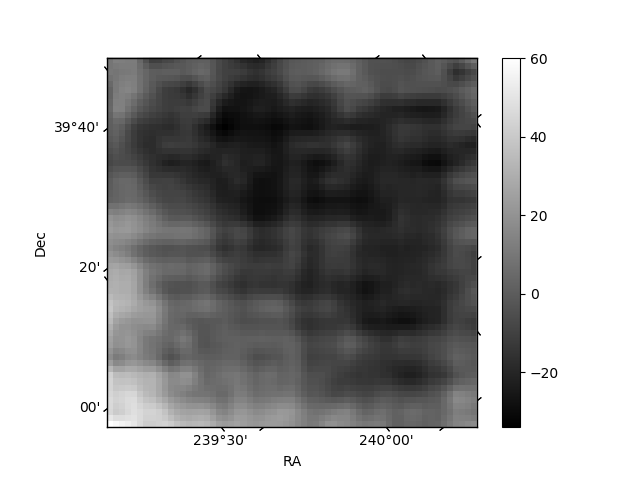
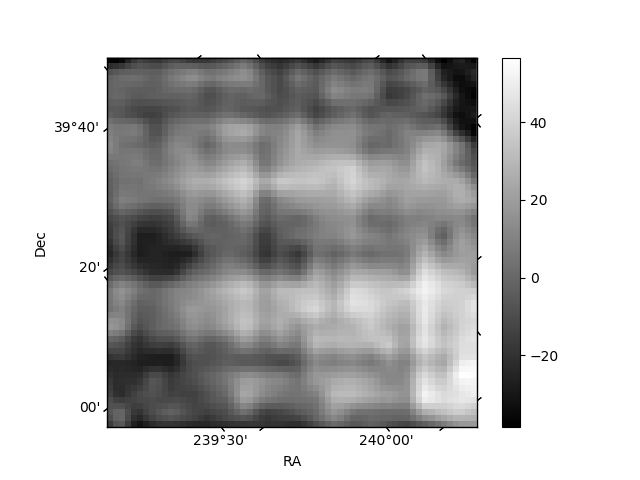
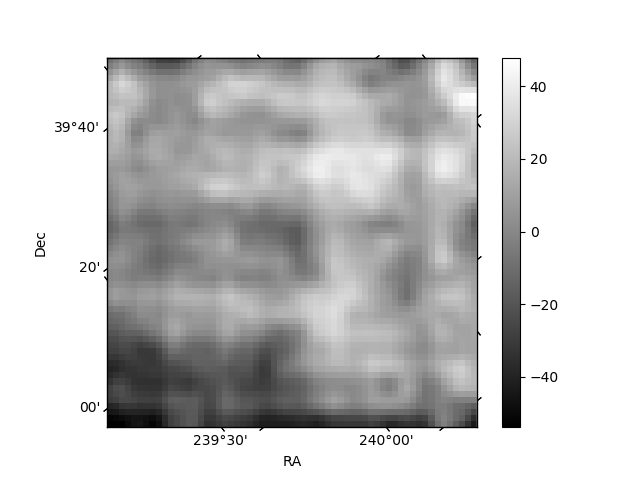
Histogram calculated using DETX and DETY for each event in the final _common_clean file
| Quadrant A | 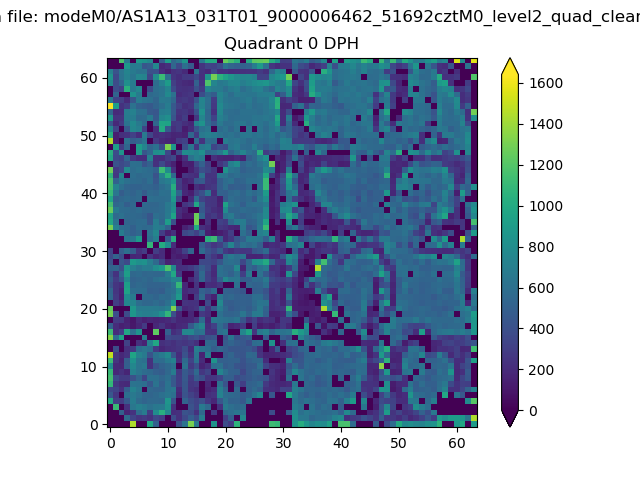 |
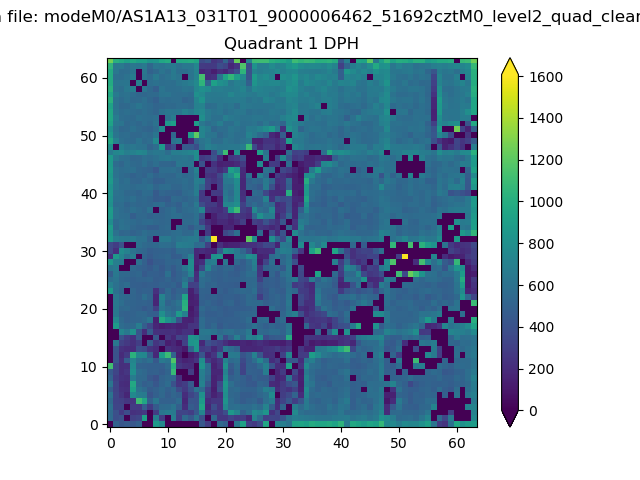 |
Quadrant B |
|---|---|---|---|
| Quadrant D | 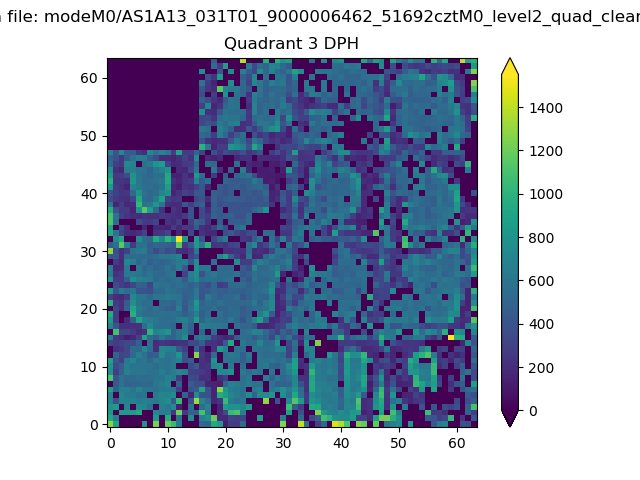 |
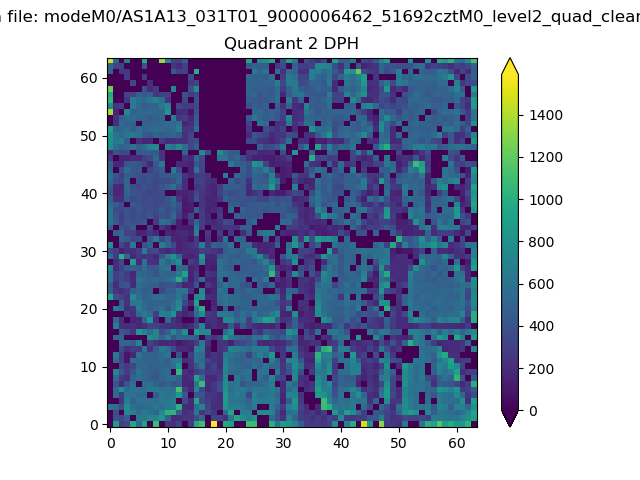 |
Quadrant C |
| Plot type | Count rate plots | Images |
|---|---|---|
| Comparison with Poisson distribution Blue bars denote a histogram of data divided into 1 sec bins. Red curve is a Poisson curve with rate = median count rate of data. |
 |
 |
| Quadrant-wise count rates Data is divided into 100 sec bins |
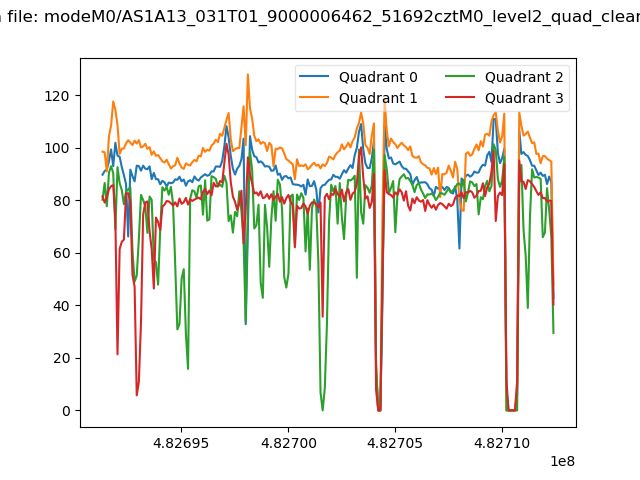 |
|
| Module-wise count rates for Quadrant A Data is divided into 100 sec bins |
 |
 |
| Module-wise count rates for Quadrant B Data is divided into 100 sec bins |
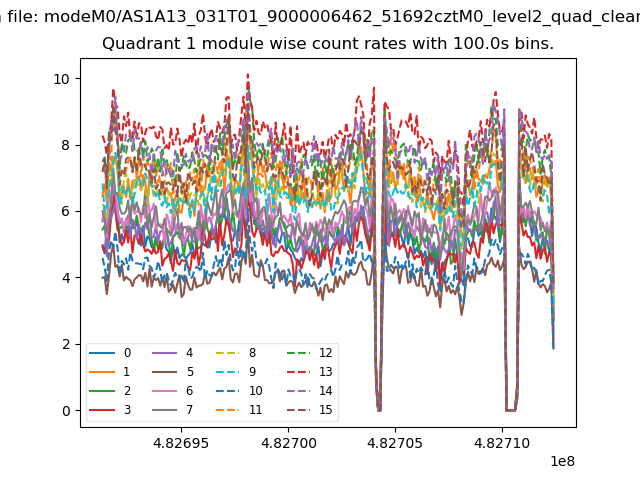 |
 |
| Module-wise count rates for Quadrant C Data is divided into 100 sec bins |
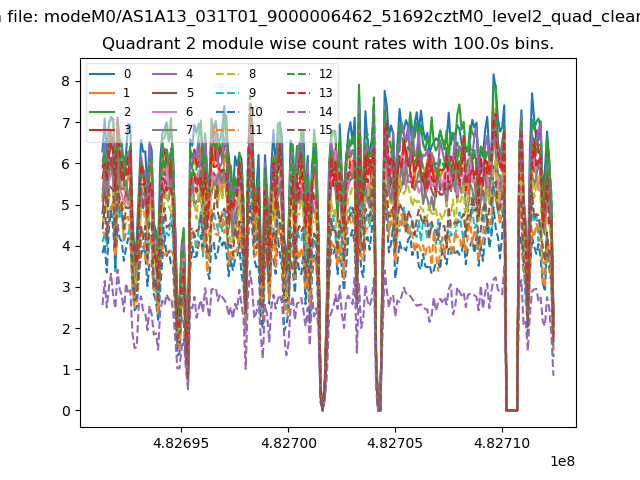 |
 |
| Module-wise count rates for Quadrant D Data is divided into 100 sec bins |
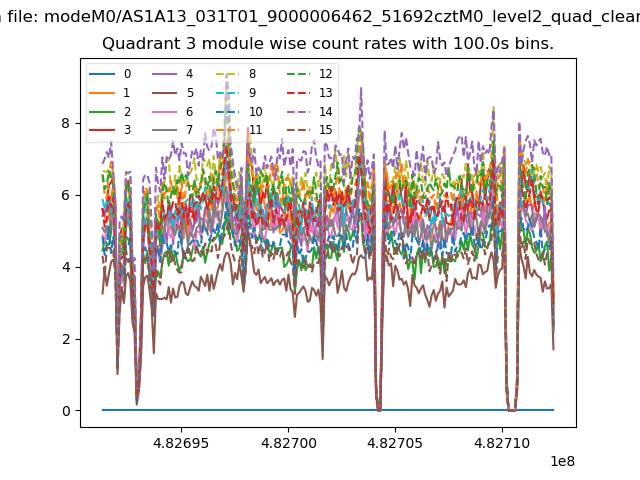 |
 |
| Parameter | Plot |
|---|---|
| CZT HV Monitor | 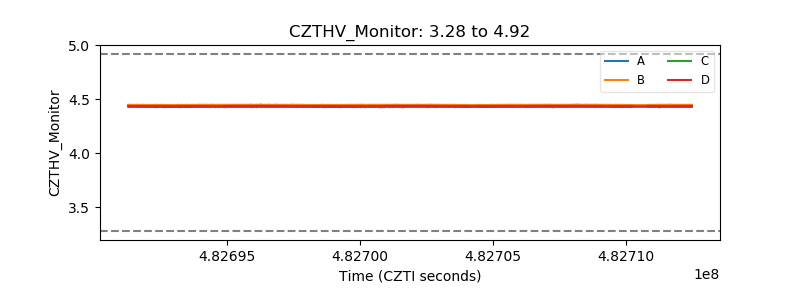 |
| D_VDD | 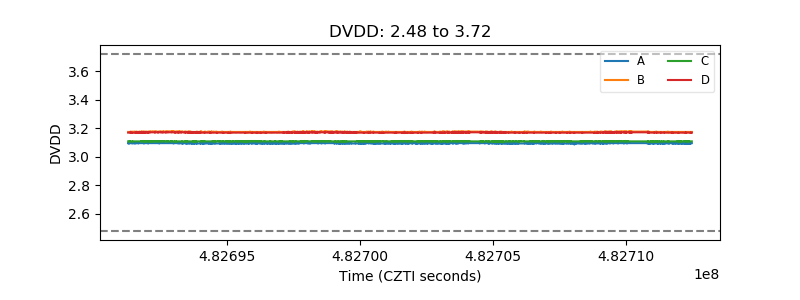 |
| Temperature 1 | 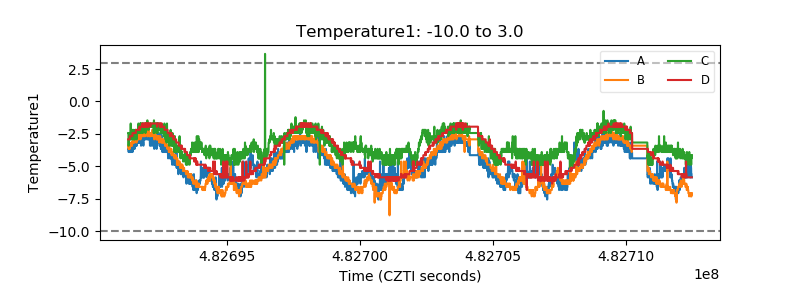 |
| Veto HV Monitor | 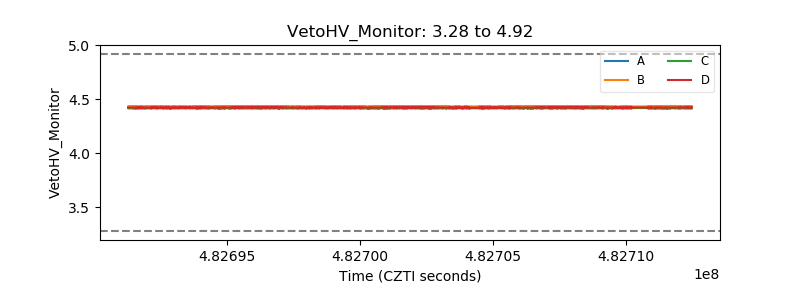 |
| Veto LLD | 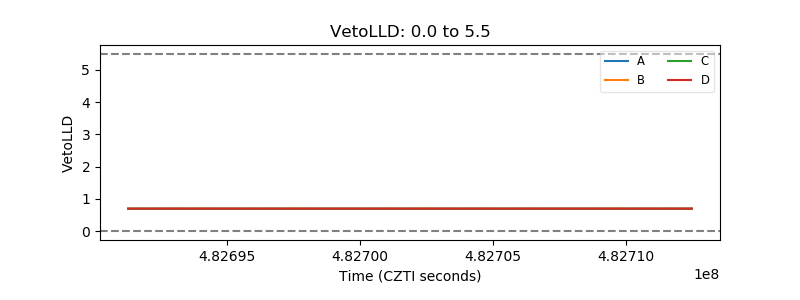 |
| Alpha Counter | 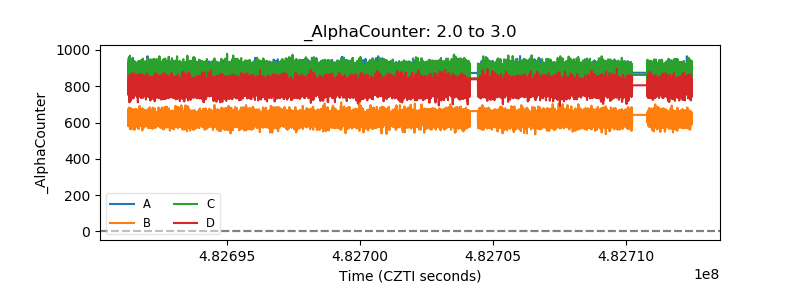 |
| _CPM_Rate | 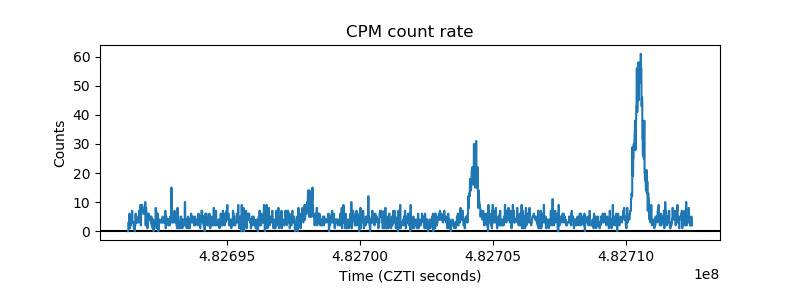 |
| CZT Counter | 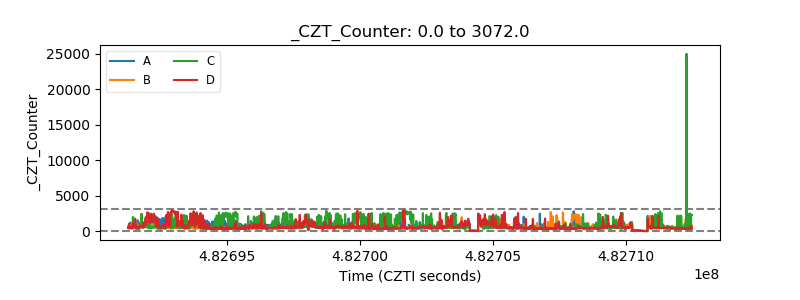 |
| +2.5 Volts monitor | 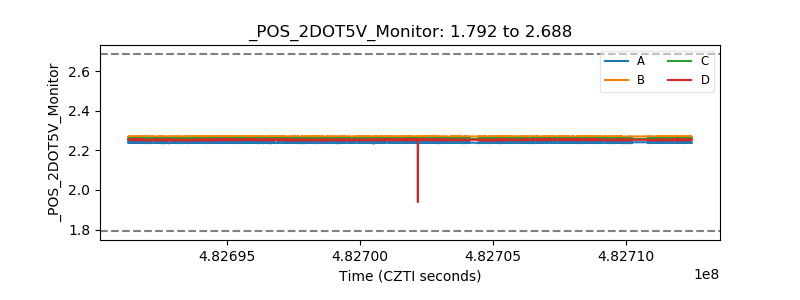 |
| +5 Volts monitor | 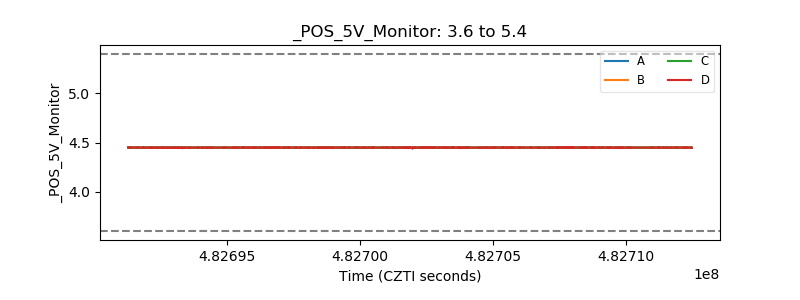 |
| _ROLL_ROT | 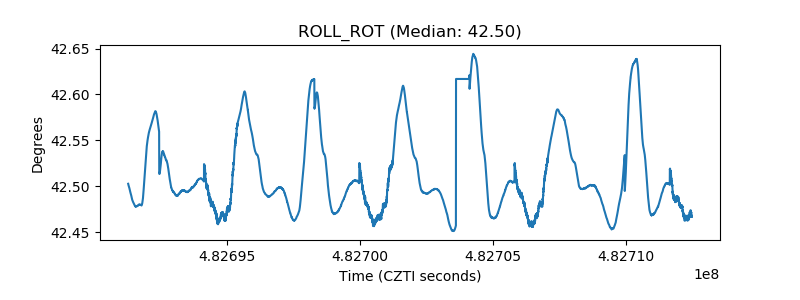 |
| _Roll_DEC | 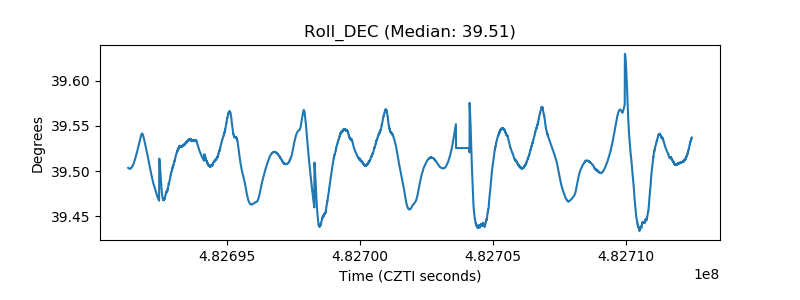 |
| _Roll_RA | 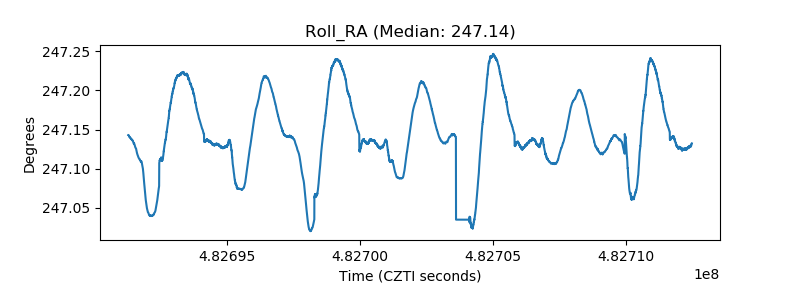 |
| Veto Counter | 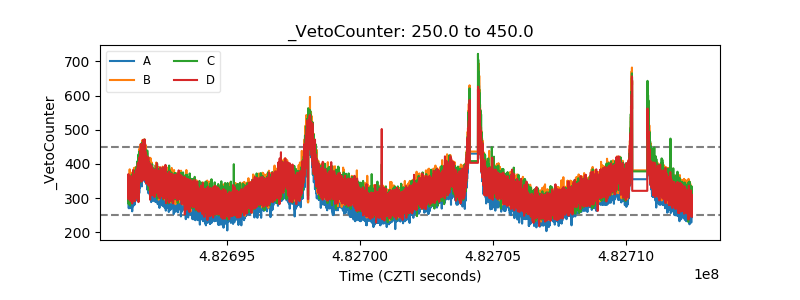 |