| Param | Original file | Final file |
|---|---|---|
| Filename | modeM0/AS1A13_031T01_9000006462_51693cztM0_level2.fits | modeM0/AS1A13_031T01_9000006462_51693cztM0_level2_quad_clean.evt |
| Size (bytes) | 531,878,400 | 96,779,520 |
| Size | 507.2 MB | 92.3 MB |
| Events in quadrant A | 4,131,174 | 636,173 |
| Events in quadrant B | 4,348,917 | 683,777 |
| Events in quadrant C | 6,238,060 | 560,034 |
| Events in quadrant D | 4,431,352 | 566,988 |
| Mode M9 | |||
|---|---|---|---|
| Quadrant | BADHDUFLAG | Total packets | Discarded packets |
| A | 0 | 10 | 0 |
| B | 0 | 11 | 0 |
| C | 0 | 11 | 0 |
| D | 0 | 11 | 0 |
| Mode M0 | |||
|---|---|---|---|
| Quadrant | BADHDUFLAG | Total packets | Discarded packets |
| A | 0 | 17154 | 2 |
| B | 0 | 17696 | 4 |
| C | 0 | 23522 | 2 |
| D | 0 | 18422 | 2 |
| Mode SS | |||
|---|---|---|---|
| Quadrant | BADHDUFLAG | Total packets | Discarded packets |
| A | 0 | 140 | 0 |
| B | 0 | 140 | 0 |
| C | 0 | 140 | 0 |
| D | 0 | 140 | 0 |
| Quadrant | Total seconds | Saturated seconds | Saturation percentage |
|---|---|---|---|
| A | 6942 | 177 | 2.549697% |
| B | 6941 | 191 | 2.751765% |
| C | 6941 | 966 | 13.917303% |
| D | 6941 | 323 | 4.653508% |
Noise dominated data is calculated using 1-second bins in cleaned event files. If a bin has >2000 counts, and if more than 50% of those come from <1% of pixels, then it is considered to be noise-dominated and hence unusable.
| Quadrant | # 1 sec bins | Bins with >0 counts | Bins with >2000 counts | High rate bins dominated by noise | Noise dominated (total time) | Noise dominated (detector-on time) | Marked lightcurve |
|---|---|---|---|---|---|---|---|
| A | 7702 | 6943 | 107 | 107 | 1.39% | 1.54% | 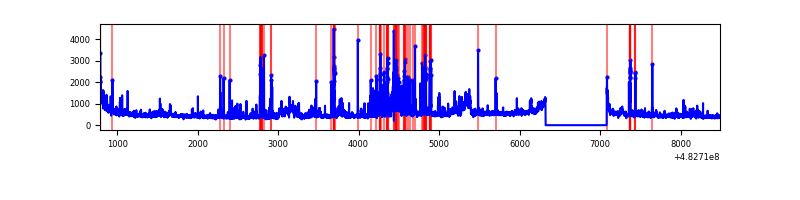 |
| B | 7701 | 6942 | 61 | 61 | 0.79% | 0.88% | 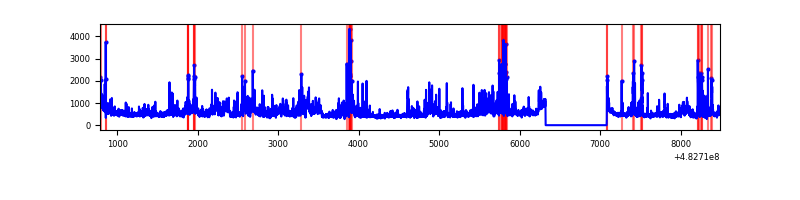 |
| C | 7701 | 6942 | 806 | 806 | 10.47% | 11.61% | 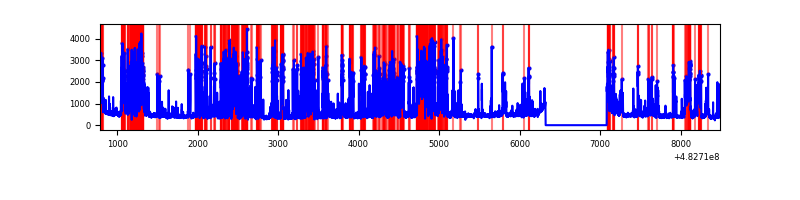 |
| D | 7701 | 6942 | 294 | 294 | 3.82% | 4.24% | 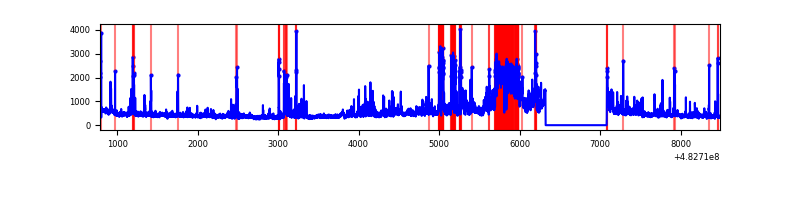 |
Top three noisy pixels from each quadrant. If the there are fewer than three noisy pixels in the level2.evt file, extra rows are filled as -1
| Pixel properties | Quadrant properties | ||||||
|---|---|---|---|---|---|---|---|
| Quadrant | DetID | PixID | Counts | Sigma | Mean | Median | Sigma |
| A | 3 | 14 | 354403 | 1996.32 | 715 | 698 | 177.2 |
| A | 4 | 61 | 295911 | 1666.19 | 715 | 698 | 177.2 |
| A | 12 | 3 | 153704 | 863.57 | 715 | 698 | 177.2 |
| B | 10 | 254 | 586901 | 3781.6 | 716 | 689 | 155.0 |
| B | 1 | 223 | 323870 | 2084.81 | 716 | 689 | 155.0 |
| B | 1 | 207 | 137152 | 880.31 | 716 | 689 | 155.0 |
| C | 15 | 189 | 1882148 | 10075.95 | 672 | 666 | 186.7 |
| C | 0 | 192 | 732198 | 3917.59 | 672 | 666 | 186.7 |
| C | 15 | 231 | 458251 | 2450.52 | 672 | 666 | 186.7 |
| D | 10 | 172 | 513798 | 2611.27 | 693 | 667 | 196.5 |
| D | 6 | 228 | 443396 | 2253.0 | 693 | 667 | 196.5 |
| D | 2 | 249 | 229720 | 1165.63 | 693 | 667 | 196.5 |
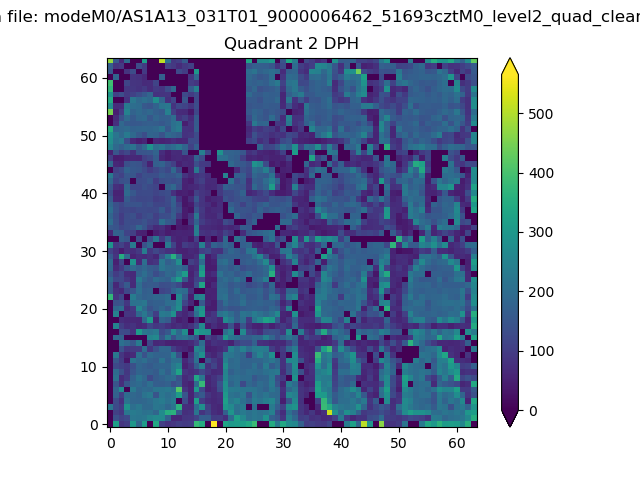
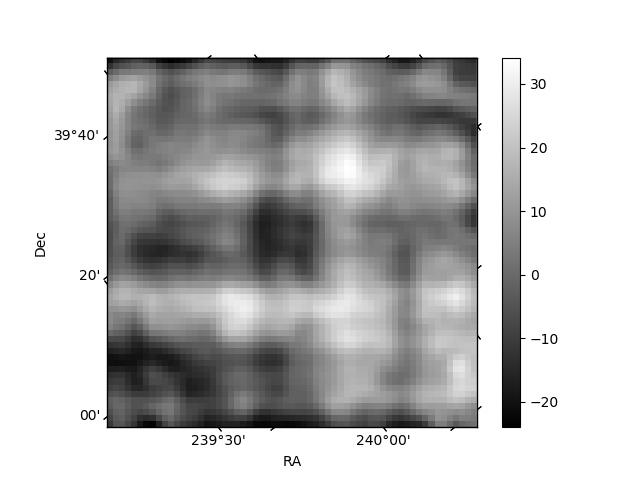
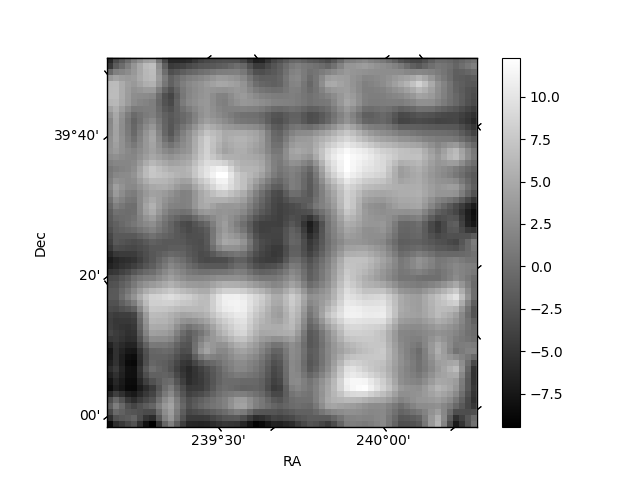
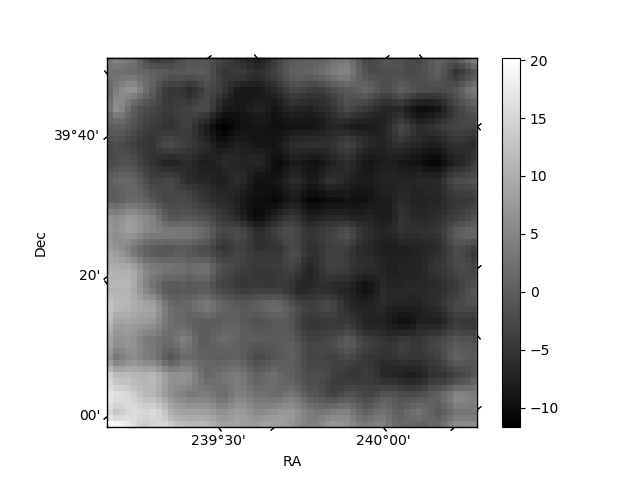
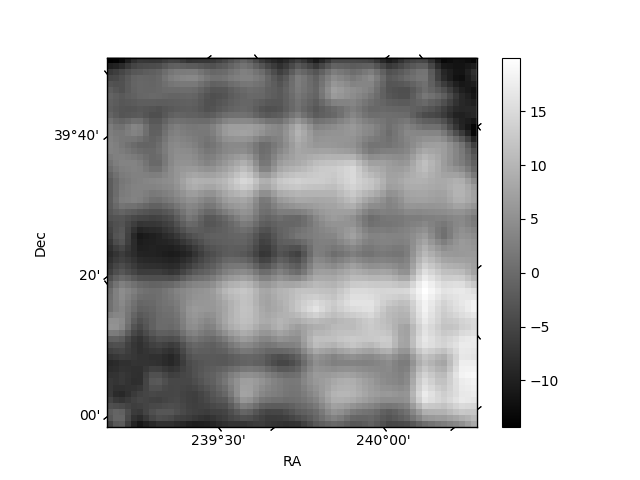
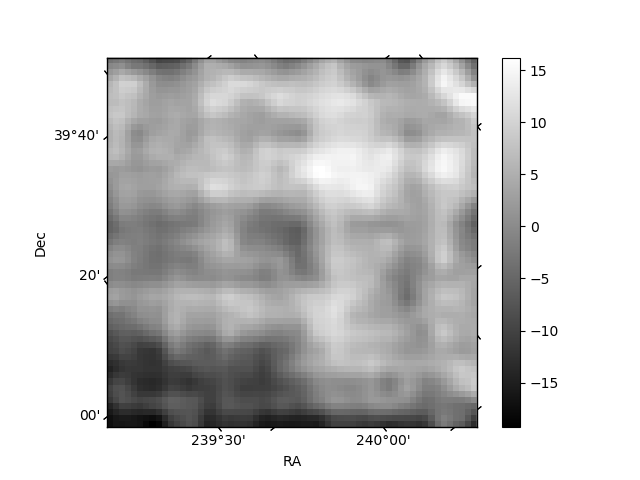
Histogram calculated using DETX and DETY for each event in the final _common_clean file
| Quadrant A | 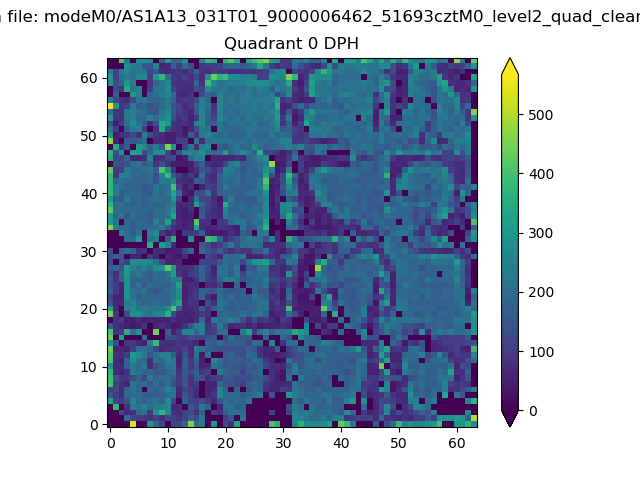 |
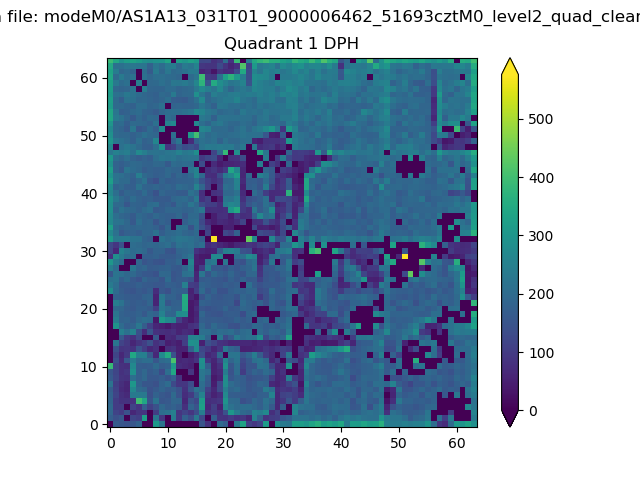 |
Quadrant B |
|---|---|---|---|
| Quadrant D | 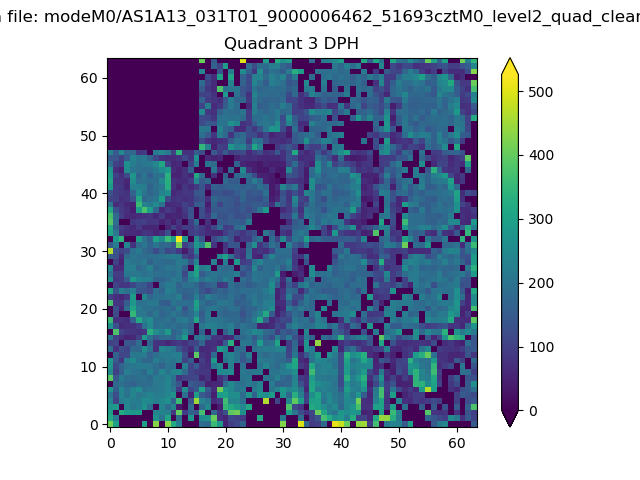 |
 |
Quadrant C |
| Plot type | Count rate plots | Images |
|---|---|---|
| Comparison with Poisson distribution Blue bars denote a histogram of data divided into 1 sec bins. Red curve is a Poisson curve with rate = median count rate of data. |
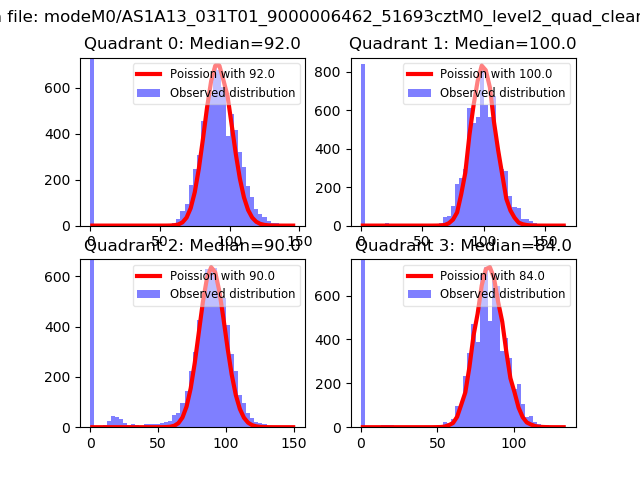 |
 |
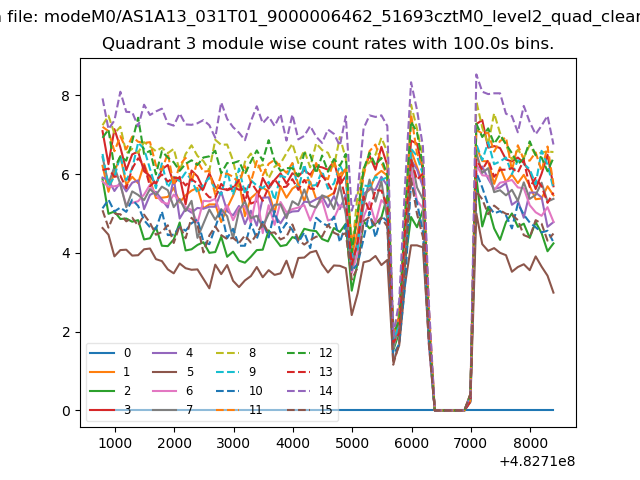
| Quadrant-wise count rates Data is divided into 100 sec bins |
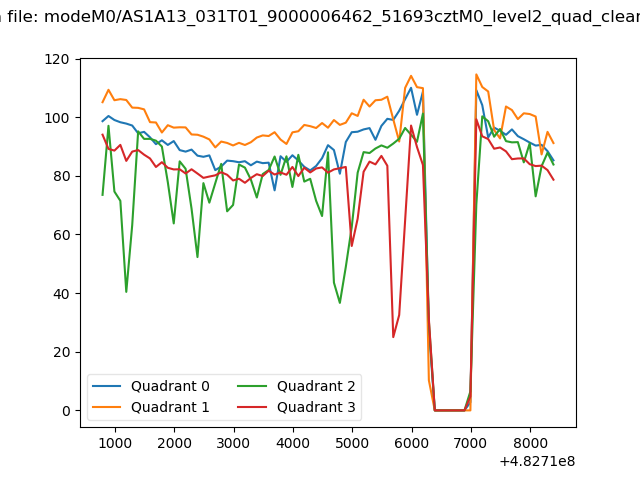 |
|
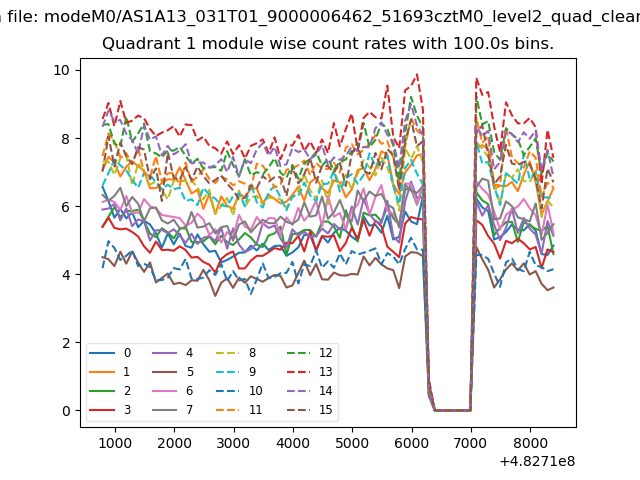
| Module-wise count rates for Quadrant A Data is divided into 100 sec bins |
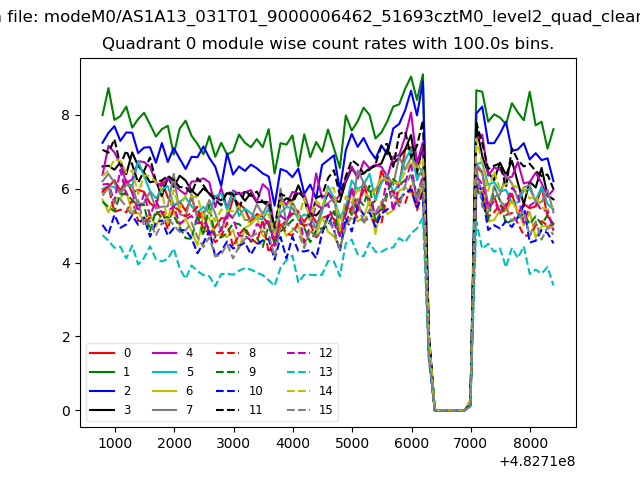 |
 |
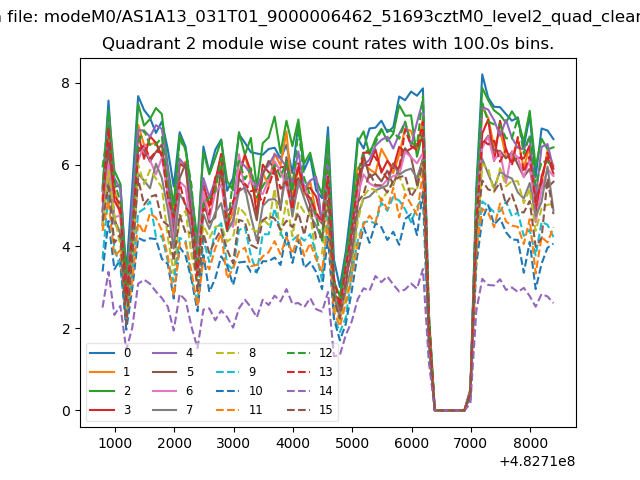
| Module-wise count rates for Quadrant B Data is divided into 100 sec bins |
 |
 |
| Module-wise count rates for Quadrant C Data is divided into 100 sec bins |
 |
 |
| Module-wise count rates for Quadrant D Data is divided into 100 sec bins |
 |
 |
| Parameter | Plot |
|---|---|
| CZT HV Monitor | 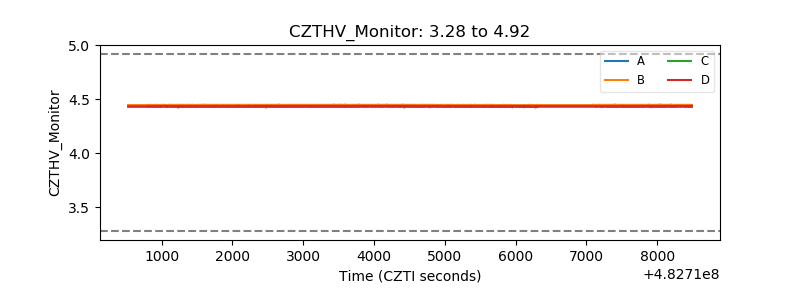 |
| D_VDD | 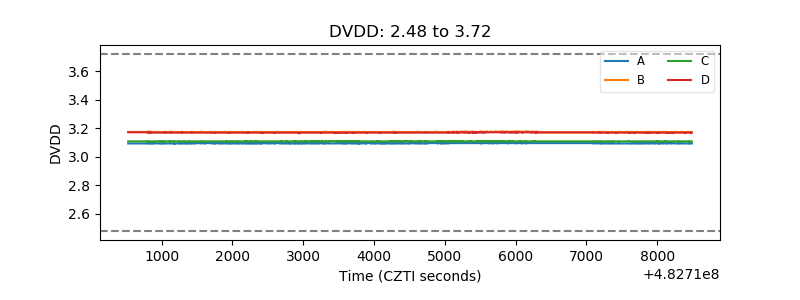 |
| Temperature 1 | 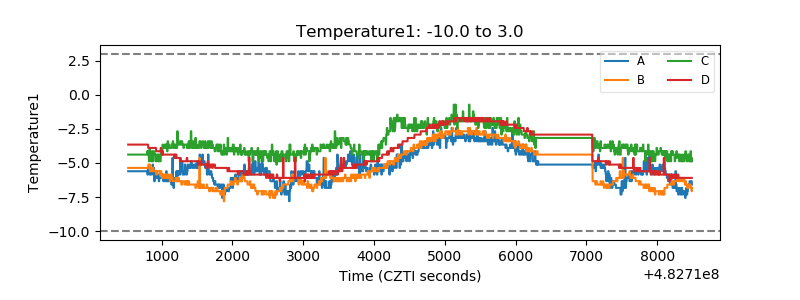 |
| Veto HV Monitor | 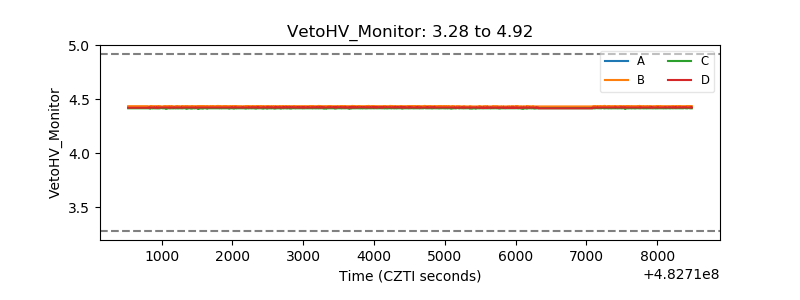 |
| Veto LLD | 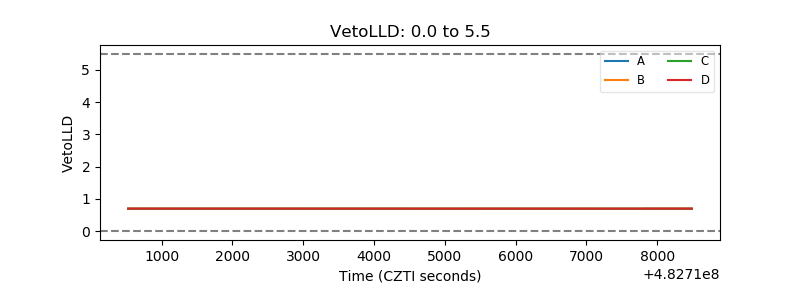 |
| Alpha Counter | 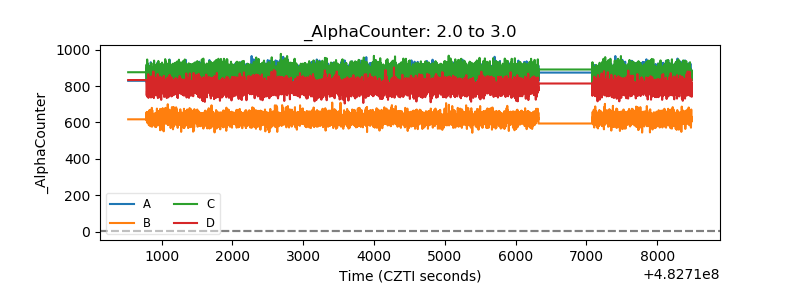 |
| _CPM_Rate | 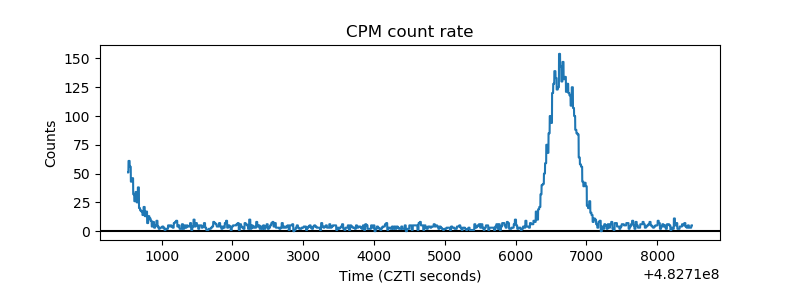 |
| CZT Counter | 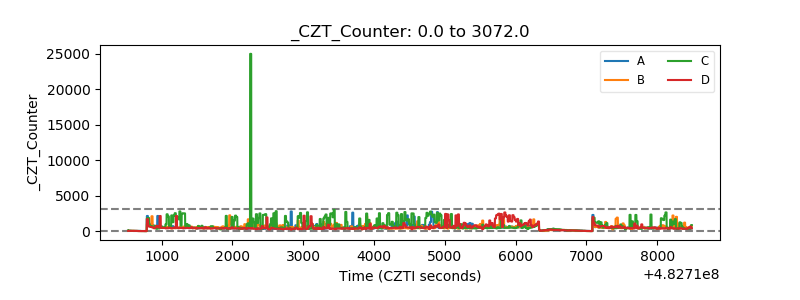 |
| +2.5 Volts monitor | 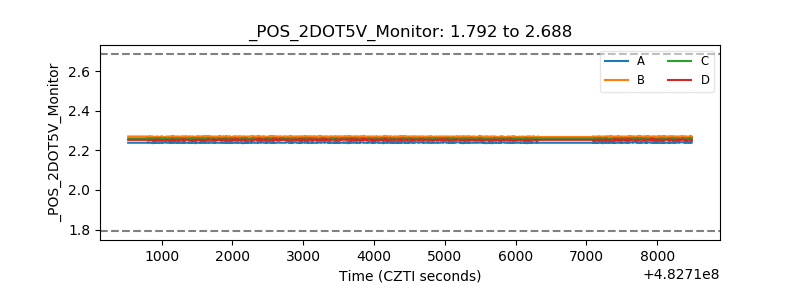 |
| +5 Volts monitor | 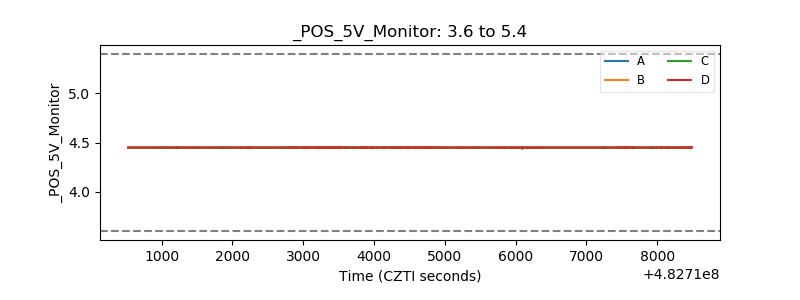 |
| _ROLL_ROT | 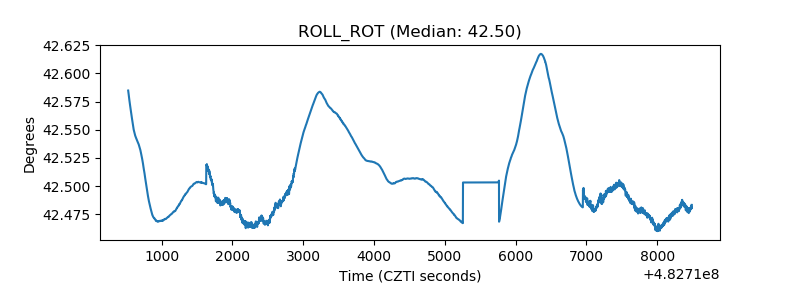 |
| _Roll_DEC | 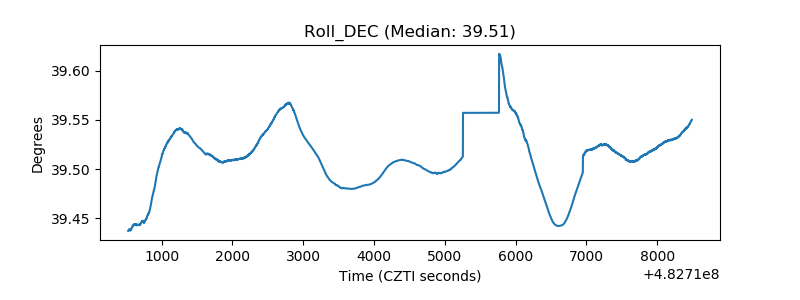 |
| _Roll_RA | 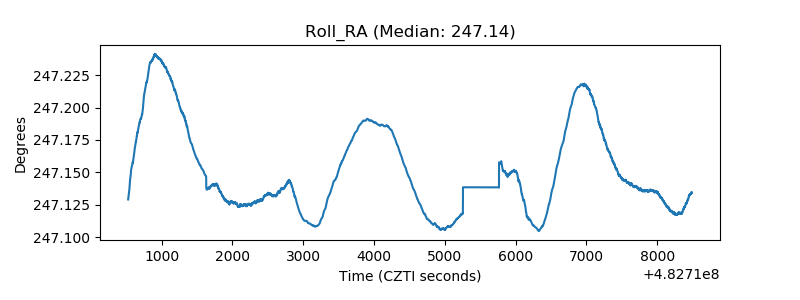 |
| Veto Counter | 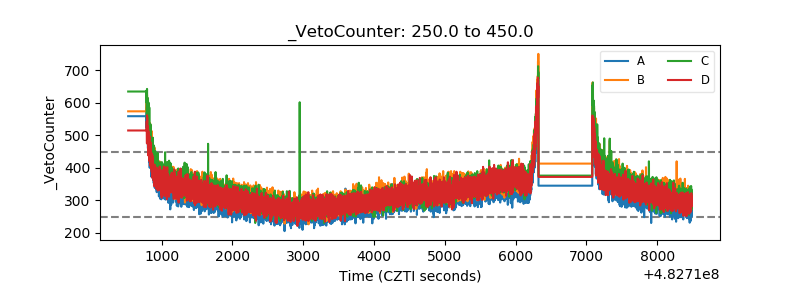 |