| Param | Original file | Final file |
|---|---|---|
| Filename | modeM0/AS1A13_031T01_9000006462_51696cztM0_level2.fits | modeM0/AS1A13_031T01_9000006462_51696cztM0_level2_quad_clean.evt |
| Size (bytes) | 469,808,640 | 98,697,600 |
| Size | 448.0 MB | 94.1 MB |
| Events in quadrant A | 3,636,680 | 647,418 |
| Events in quadrant B | 3,689,615 | 697,284 |
| Events in quadrant C | 5,921,461 | 576,960 |
| Events in quadrant D | 3,606,902 | 586,384 |
| Mode M9 | |||
|---|---|---|---|
| Quadrant | BADHDUFLAG | Total packets | Discarded packets |
| A | 0 | 20 | 0 |
| B | 0 | 20 | 0 |
| C | 0 | 20 | 0 |
| D | 0 | 20 | 0 |
| Mode M0 | |||
|---|---|---|---|
| Quadrant | BADHDUFLAG | Total packets | Discarded packets |
| A | 0 | 15674 | 2 |
| B | 0 | 15957 | 2 |
| C | 0 | 22523 | 3 |
| D | 0 | 15874 | 2 |
| Mode SS | |||
|---|---|---|---|
| Quadrant | BADHDUFLAG | Total packets | Discarded packets |
| A | 0 | 142 | 0 |
| B | 0 | 142 | 0 |
| C | 0 | 142 | 0 |
| D | 0 | 142 | 0 |
| Quadrant | Total seconds | Saturated seconds | Saturation percentage |
|---|---|---|---|
| A | 6896 | 78 | 1.131090% |
| B | 6897 | 193 | 2.798318% |
| C | 6896 | 833 | 12.079466% |
| D | 6896 | 147 | 2.131671% |
Noise dominated data is calculated using 1-second bins in cleaned event files. If a bin has >2000 counts, and if more than 50% of those come from <1% of pixels, then it is considered to be noise-dominated and hence unusable.
| Quadrant | # 1 sec bins | Bins with >0 counts | Bins with >2000 counts | High rate bins dominated by noise | Noise dominated (total time) | Noise dominated (detector-on time) | Marked lightcurve |
|---|---|---|---|---|---|---|---|
| A | 8876 | 6898 | 15 | 15 | 0.17% | 0.22% | 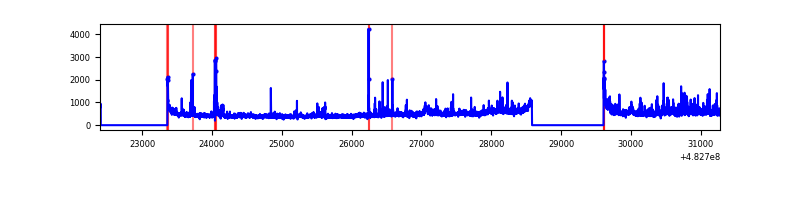 |
| B | 8877 | 6899 | 80 | 80 | 0.90% | 1.16% | 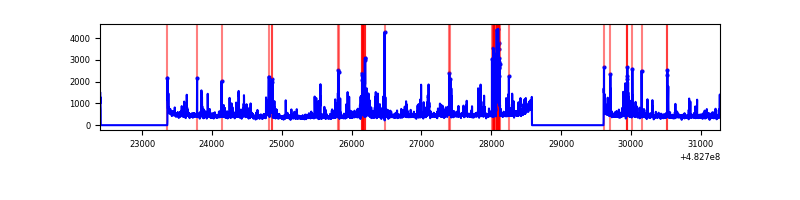 |
| C | 8876 | 6898 | 663 | 663 | 7.47% | 9.61% | 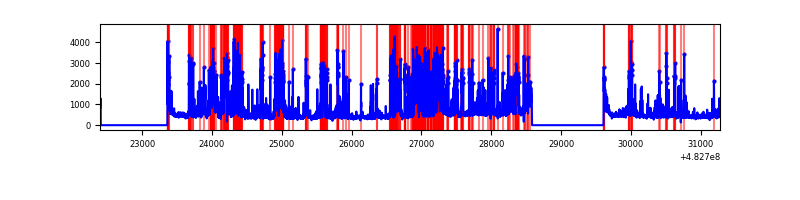 |
| D | 8876 | 6898 | 104 | 104 | 1.17% | 1.51% | 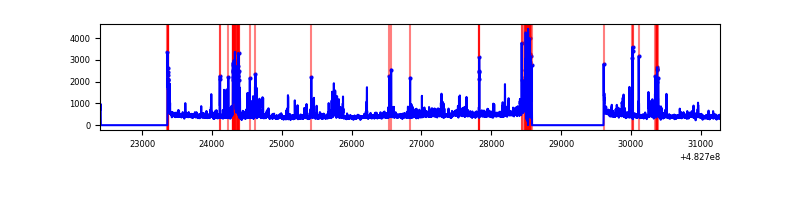 |
Top three noisy pixels from each quadrant. If the there are fewer than three noisy pixels in the level2.evt file, extra rows are filled as -1
| Pixel properties | Quadrant properties | ||||||
|---|---|---|---|---|---|---|---|
| Quadrant | DetID | PixID | Counts | Sigma | Mean | Median | Sigma |
| A | 3 | 14 | 473447 | 2660.6 | 719 | 700 | 177.7 |
| A | 5 | 240 | 102116 | 570.77 | 719 | 700 | 177.7 |
| A | 4 | 3 | 72489 | 404.03 | 719 | 700 | 177.7 |
| B | 10 | 41 | 206055 | 1339.88 | 714 | 689 | 153.3 |
| B | 1 | 223 | 185787 | 1207.65 | 714 | 689 | 153.3 |
| B | 8 | 128 | 163161 | 1060.03 | 714 | 689 | 153.3 |
| C | 15 | 189 | 1442524 | 7740.59 | 673 | 668 | 186.3 |
| C | 0 | 192 | 830196 | 4453.31 | 673 | 668 | 186.3 |
| C | 15 | 231 | 316572 | 1695.93 | 673 | 668 | 186.3 |
| D | 8 | 176 | 181002 | 936.61 | 687 | 660 | 192.5 |
| D | 6 | 228 | 154381 | 798.36 | 687 | 660 | 192.5 |
| D | 15 | 171 | 134075 | 692.9 | 687 | 660 | 192.5 |
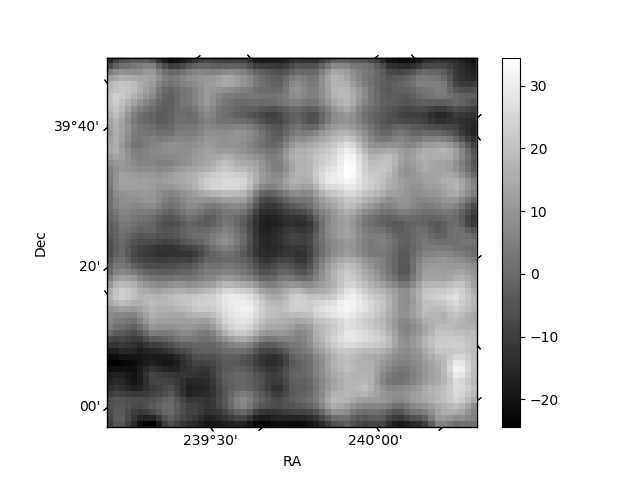
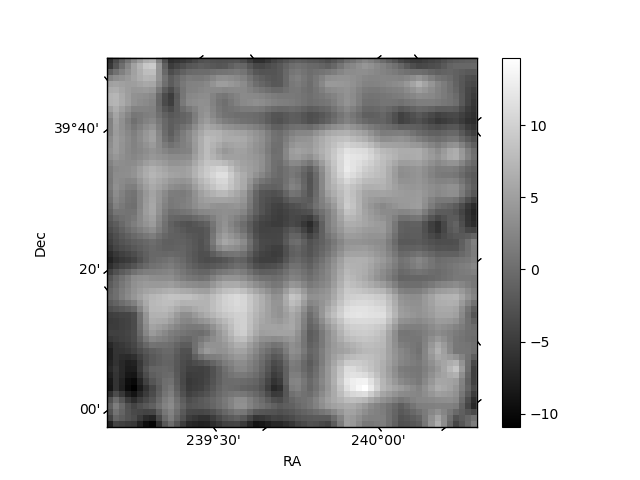
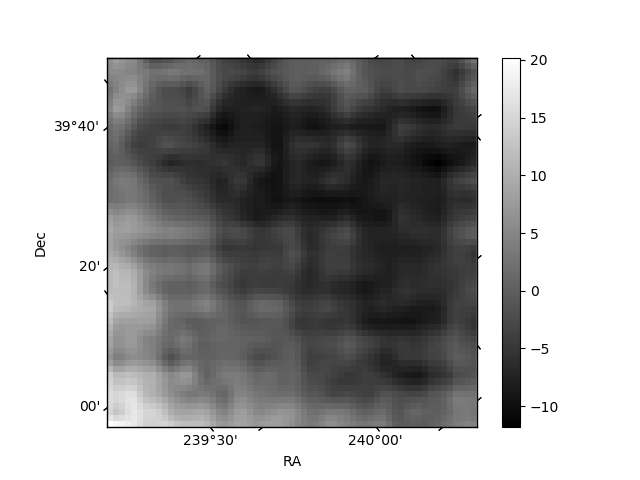
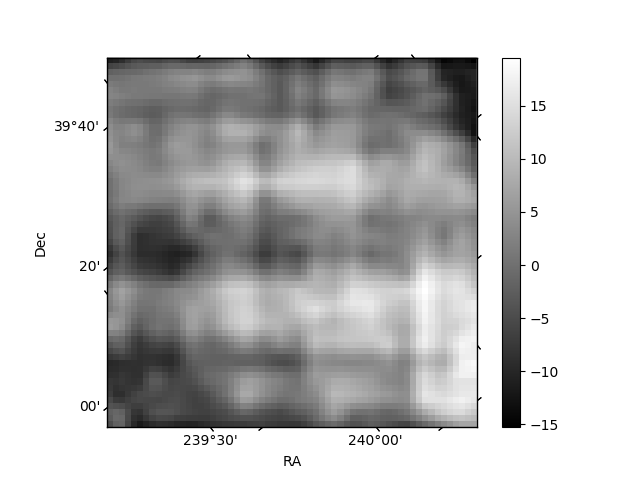
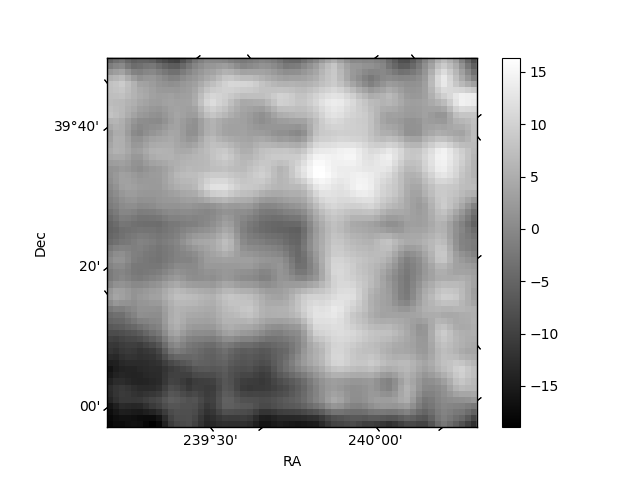
Histogram calculated using DETX and DETY for each event in the final _common_clean file
| Quadrant A | 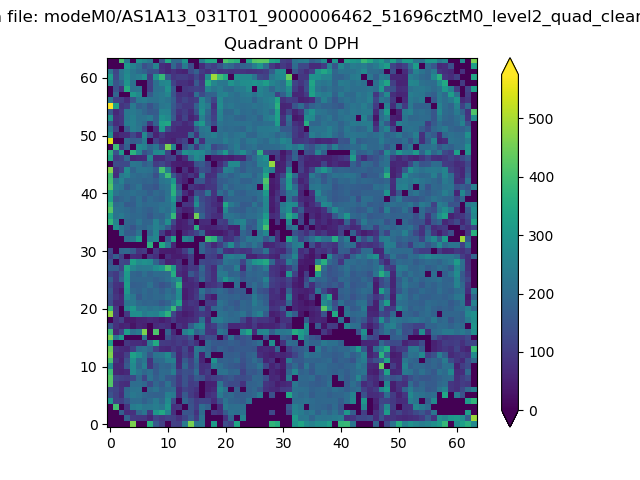 |
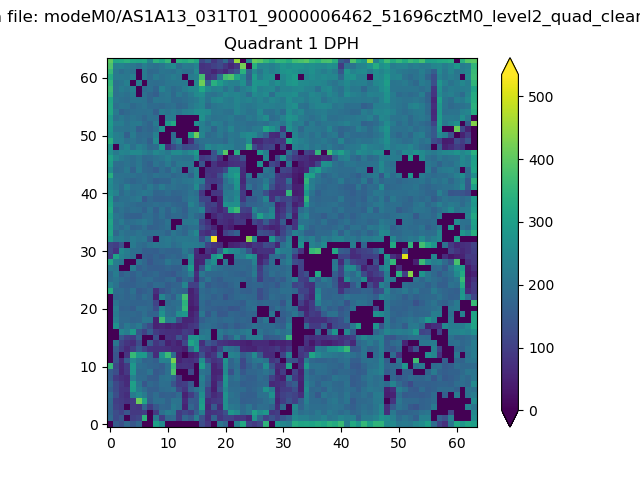 |
Quadrant B |
|---|---|---|---|
| Quadrant D | 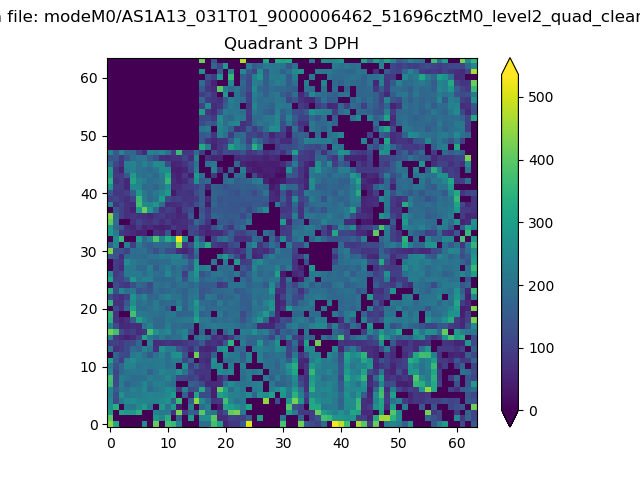 |
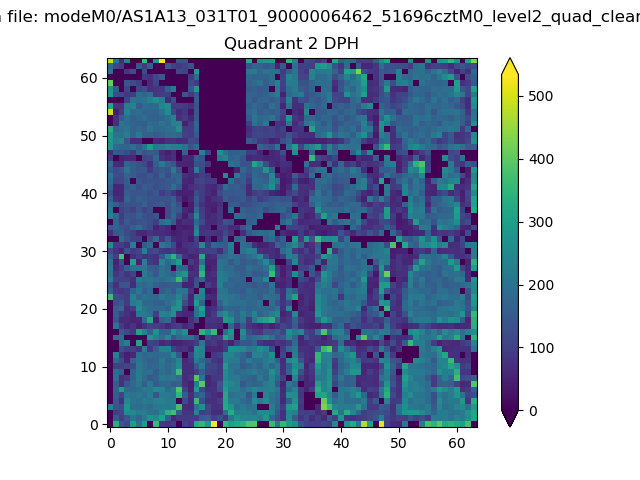 |
Quadrant C |
| Plot type | Count rate plots | Images |
|---|---|---|
| Comparison with Poisson distribution Blue bars denote a histogram of data divided into 1 sec bins. Red curve is a Poisson curve with rate = median count rate of data. |
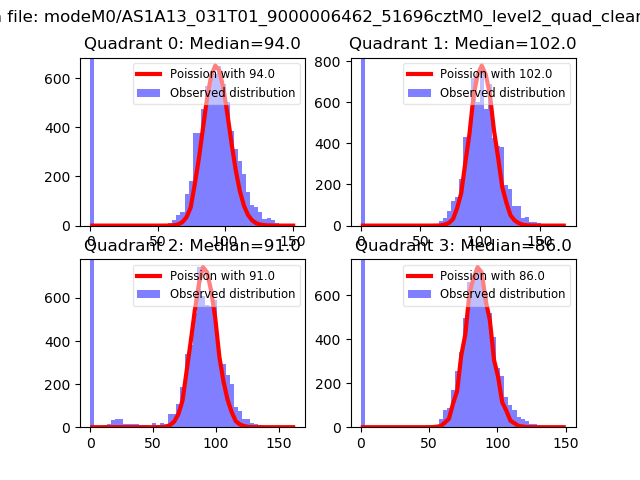 |
 |
| Quadrant-wise count rates Data is divided into 100 sec bins |
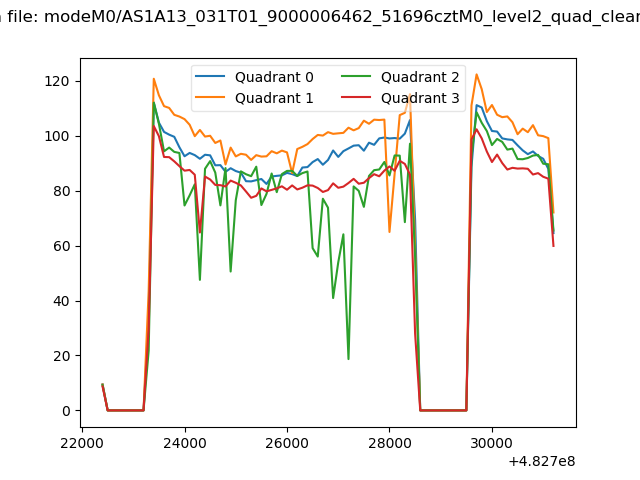 |
|
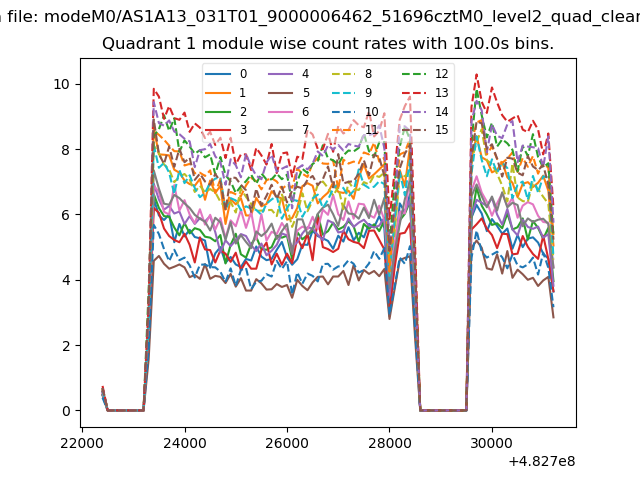
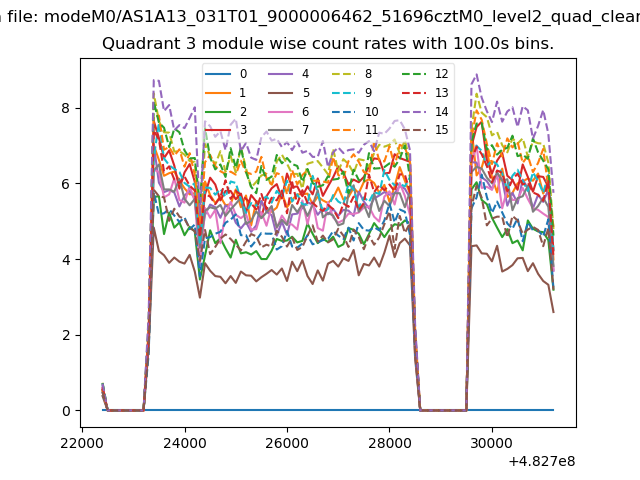
| Module-wise count rates for Quadrant A Data is divided into 100 sec bins |
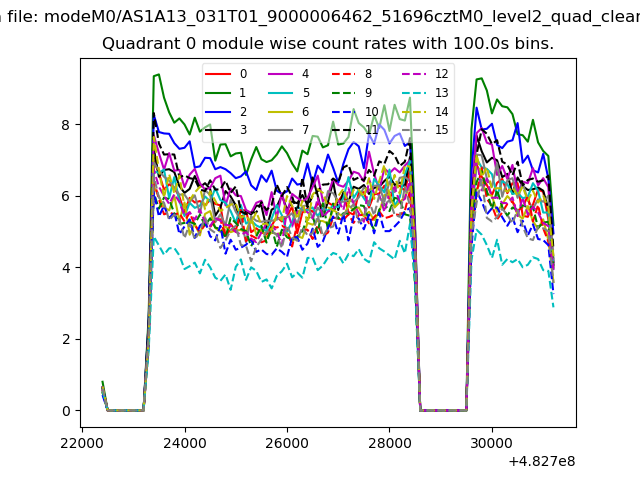 |
 |
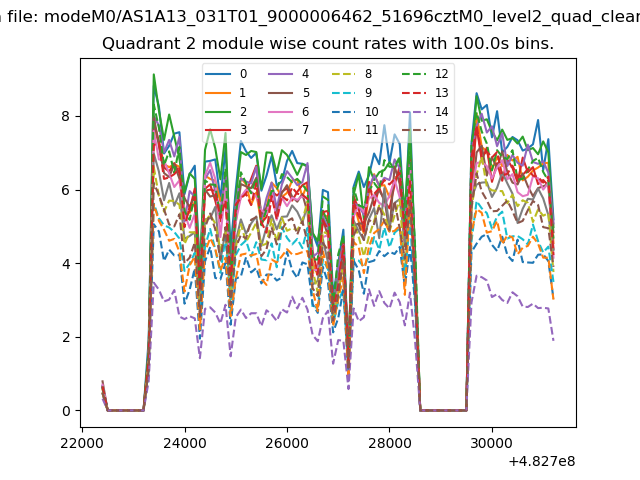
| Module-wise count rates for Quadrant B Data is divided into 100 sec bins |
 |
 |
| Module-wise count rates for Quadrant C Data is divided into 100 sec bins |
 |
 |
| Module-wise count rates for Quadrant D Data is divided into 100 sec bins |
 |
 |
| Parameter | Plot |
|---|---|
| CZT HV Monitor | 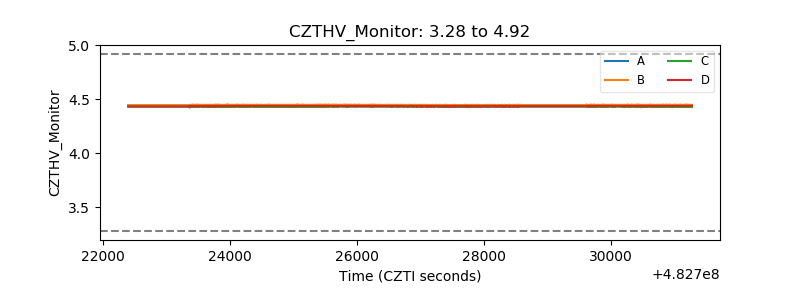 |
| D_VDD |  |
| Temperature 1 | 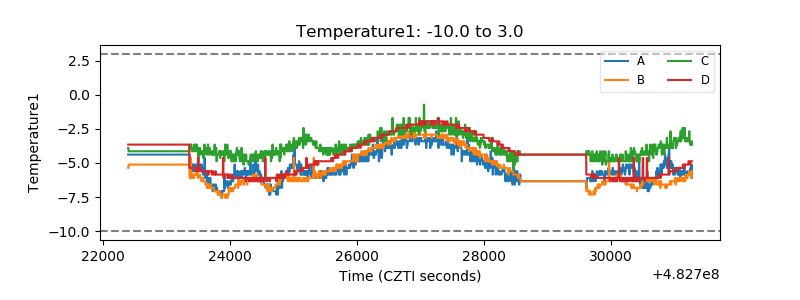 |
| Veto HV Monitor | 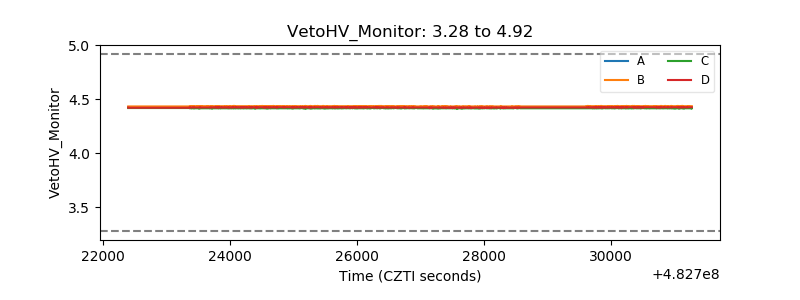 |
| Veto LLD | 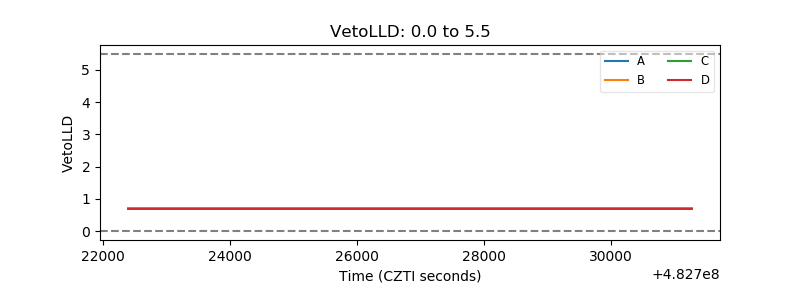 |
| Alpha Counter | 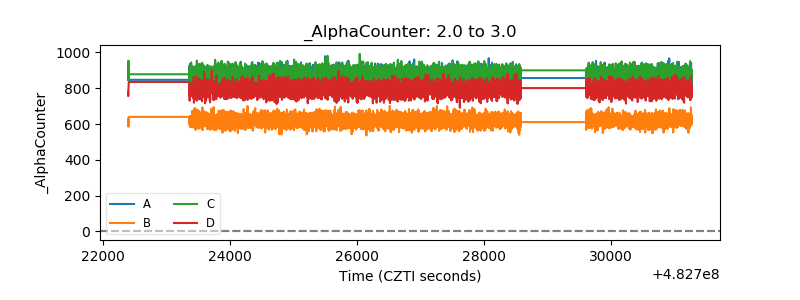 |
| _CPM_Rate | 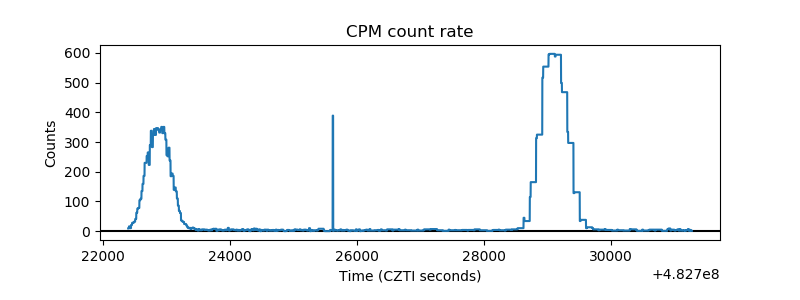 |
| CZT Counter | 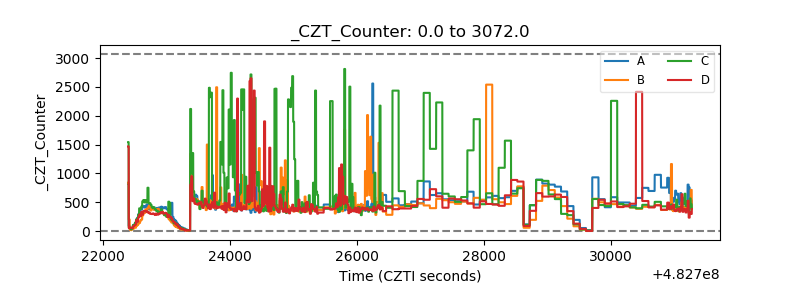 |
| +2.5 Volts monitor | 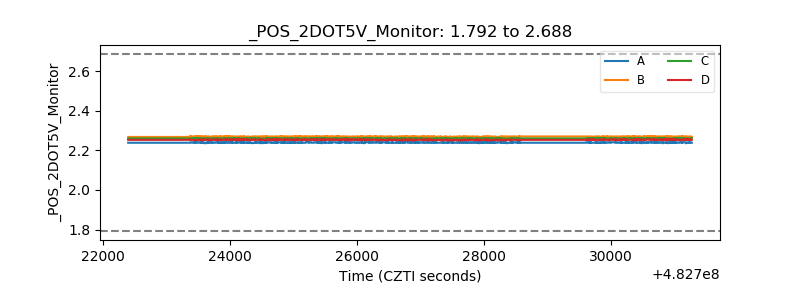 |
| +5 Volts monitor | 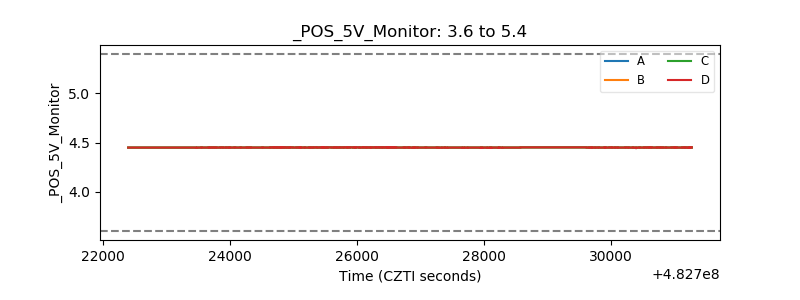 |
| _ROLL_ROT | 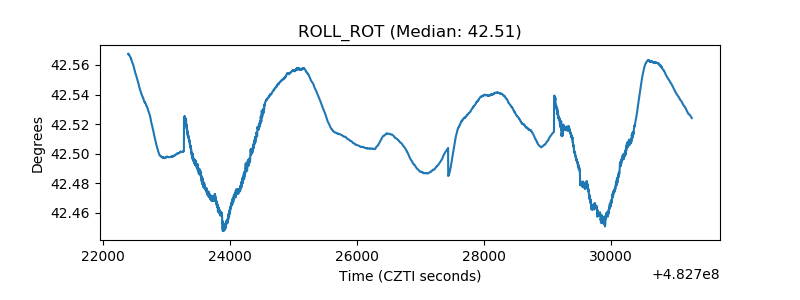 |
| _Roll_DEC | 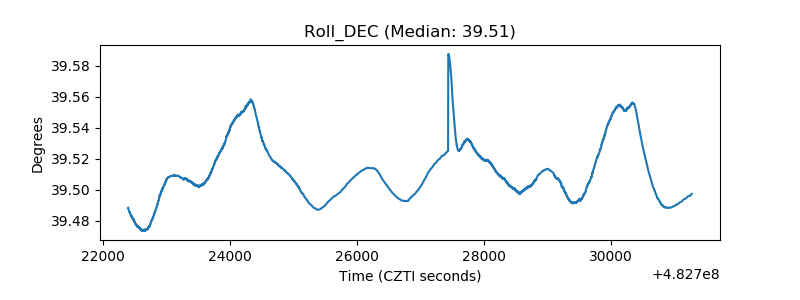 |
| _Roll_RA | 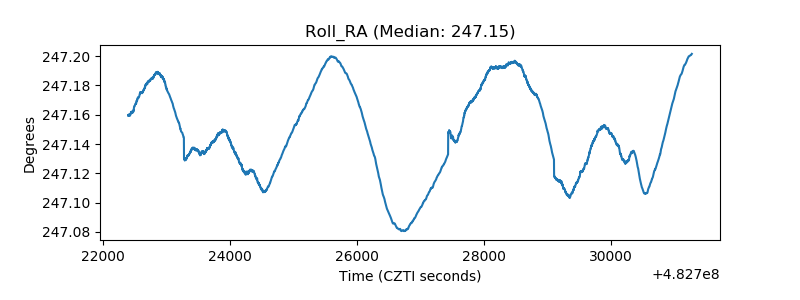 |
| Veto Counter | 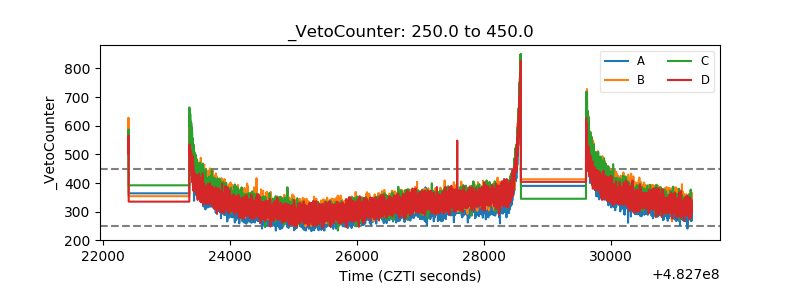 |