| Param | Original file | Final file |
|---|---|---|
| Filename | modeM0/AS1A13_031T01_9000006462_51698cztM0_level2.fits | modeM0/AS1A13_031T01_9000006462_51698cztM0_level2_quad_clean.evt |
| Size (bytes) | 1,093,515,840 | 225,267,840 |
| Size | 1.0 GB | 214.8 MB |
| Events in quadrant A | 9,822,256 | 1,485,367 |
| Events in quadrant B | 8,271,905 | 1,604,863 |
| Events in quadrant C | 12,330,096 | 1,332,421 |
| Events in quadrant D | 8,841,774 | 1,317,786 |
| Mode M9 | |||
|---|---|---|---|
| Quadrant | BADHDUFLAG | Total packets | Discarded packets |
| A | 0 | 34 | 0 |
| B | 0 | 34 | 0 |
| C | 0 | 34 | 0 |
| D | 0 | 34 | 0 |
| Mode M0 | |||
|---|---|---|---|
| Quadrant | BADHDUFLAG | Total packets | Discarded packets |
| A | 0 | 40355 | 577 |
| B | 0 | 36090 | 403 |
| C | 0 | 48618 | 1019 |
| D | 0 | 38364 | 854 |
| Mode SS | |||
|---|---|---|---|
| Quadrant | BADHDUFLAG | Total packets | Discarded packets |
| A | 0 | 322 | 6 |
| B | 0 | 322 | 4 |
| C | 0 | 322 | 2 |
| D | 0 | 322 | 2 |
| Quadrant | Total seconds | Saturated seconds | Saturation percentage |
|---|---|---|---|
| A | 15676 | 264 | 1.684103% |
| B | 15689 | 403 | 2.568679% |
| C | 15630 | 1415 | 9.053103% |
| D | 15642 | 377 | 2.410178% |
Noise dominated data is calculated using 1-second bins in cleaned event files. If a bin has >2000 counts, and if more than 50% of those come from <1% of pixels, then it is considered to be noise-dominated and hence unusable.
| Quadrant | # 1 sec bins | Bins with >0 counts | Bins with >2000 counts | High rate bins dominated by noise | Noise dominated (total time) | Noise dominated (detector-on time) | Marked lightcurve |
|---|---|---|---|---|---|---|---|
| A | 19146 | 15831 | 52 | 52 | 0.27% | 0.33% | 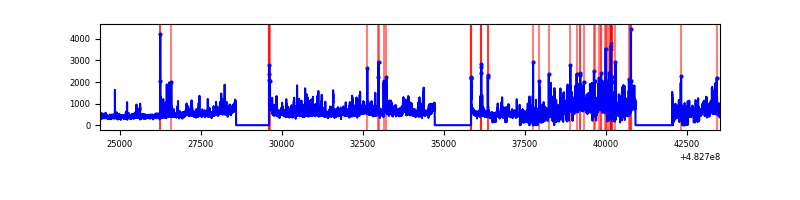 |
| B | 19147 | 15845 | 123 | 123 | 0.64% | 0.78% | 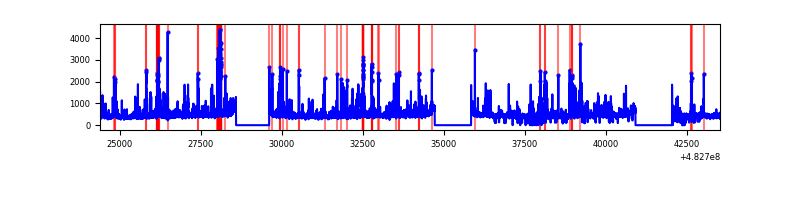 |
| C | 19147 | 15820 | 1066 | 1066 | 5.57% | 6.74% | 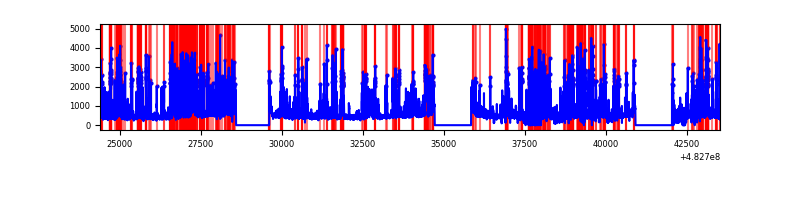 |
| D | 19147 | 15827 | 238 | 238 | 1.24% | 1.50% | 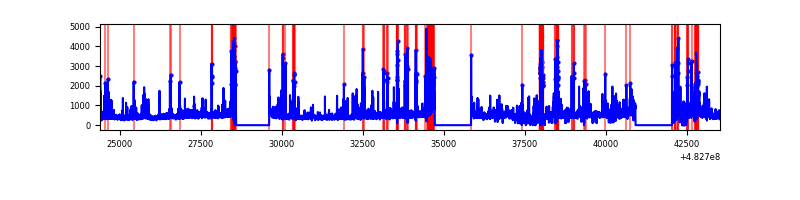 |
Top three noisy pixels from each quadrant. If the there are fewer than three noisy pixels in the level2.evt file, extra rows are filled as -1
| Pixel properties | Quadrant properties | ||||||
|---|---|---|---|---|---|---|---|
| Quadrant | DetID | PixID | Counts | Sigma | Mean | Median | Sigma |
| A | 3 | 14 | 1524466 | 3747.38 | 1677 | 1634 | 406.4 |
| A | 9 | 191 | 901213 | 2213.68 | 1677 | 1634 | 406.4 |
| A | 4 | 3 | 172372 | 420.15 | 1677 | 1634 | 406.4 |
| B | 8 | 128 | 394012 | 1102.31 | 1664 | 1604 | 356.0 |
| B | 1 | 223 | 323906 | 905.37 | 1664 | 1604 | 356.0 |
| B | 10 | 41 | 254835 | 711.35 | 1664 | 1604 | 356.0 |
| C | 15 | 189 | 2537985 | 5855.78 | 1580 | 1570 | 433.1 |
| C | 0 | 192 | 1641135 | 3785.24 | 1580 | 1570 | 433.1 |
| C | 15 | 231 | 507678 | 1168.44 | 1580 | 1570 | 433.1 |
| D | 3 | 12 | 581805 | 1310.34 | 1604 | 1546 | 442.8 |
| D | 15 | 107 | 364238 | 819.03 | 1604 | 1546 | 442.8 |
| D | 6 | 228 | 289799 | 650.93 | 1604 | 1546 | 442.8 |
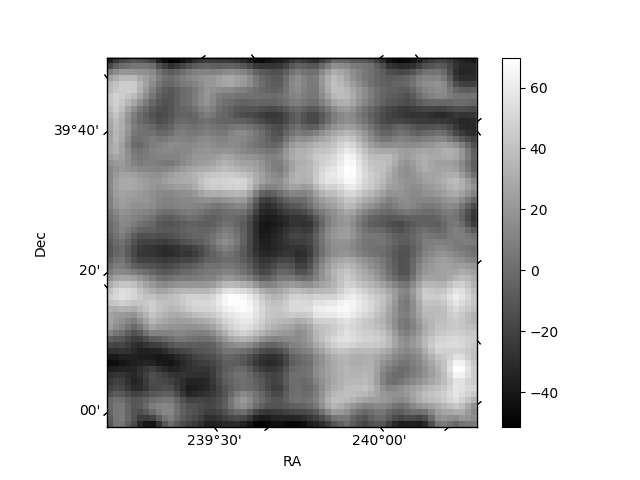
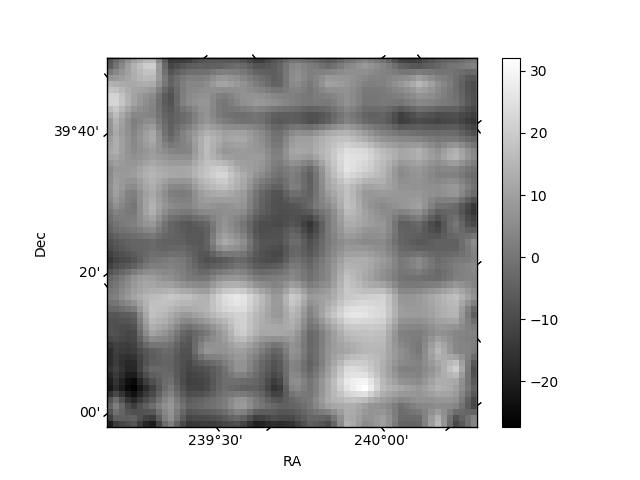
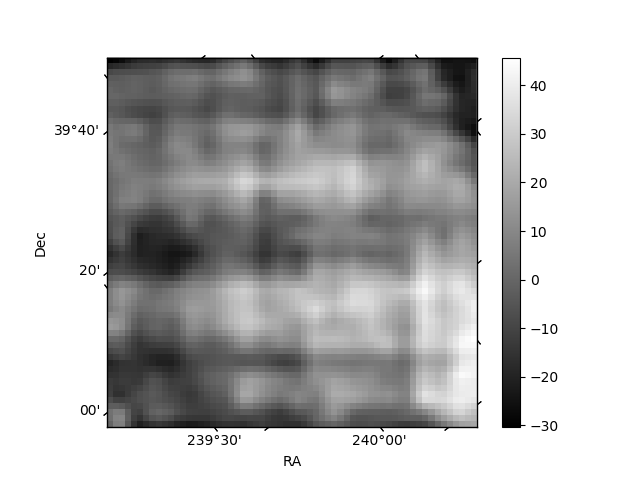
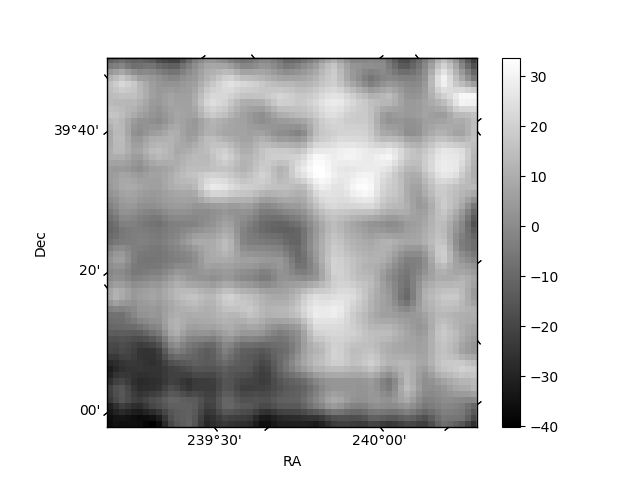
Histogram calculated using DETX and DETY for each event in the final _common_clean file
| Quadrant A | 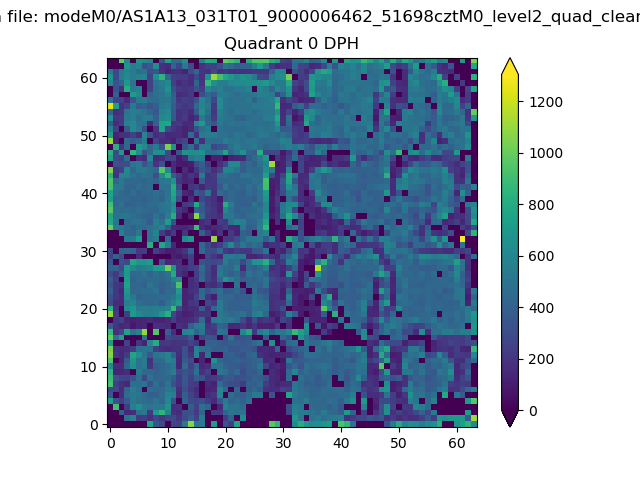 |
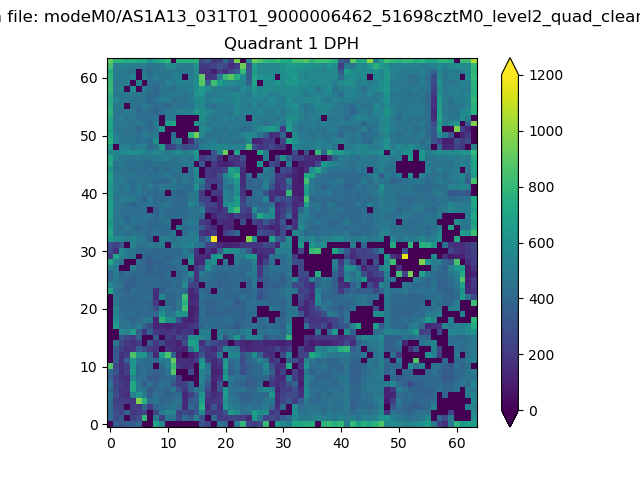 |
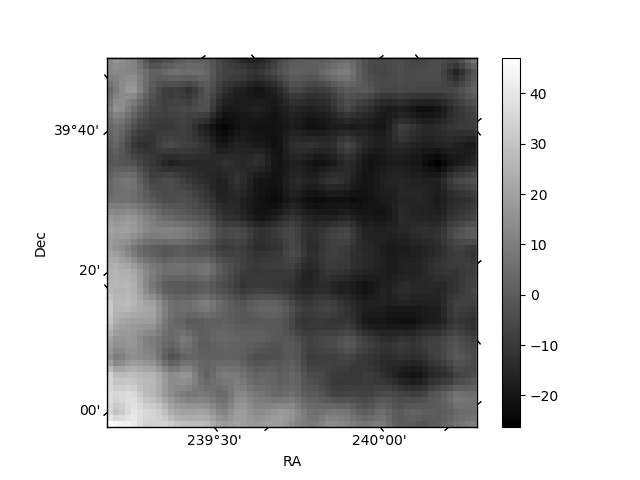
Quadrant B |
|---|---|---|---|
| Quadrant D | 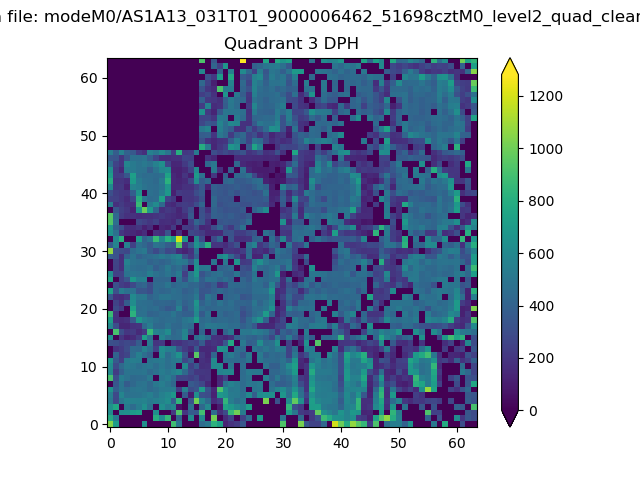 |
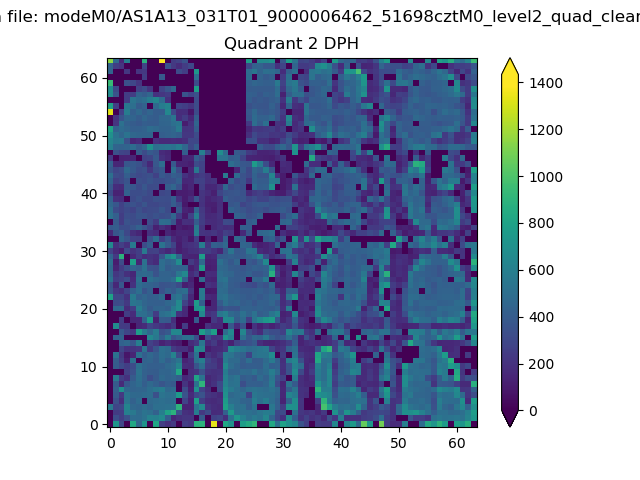 |
Quadrant C |
| Plot type | Count rate plots | Images |
|---|---|---|
| Comparison with Poisson distribution Blue bars denote a histogram of data divided into 1 sec bins. Red curve is a Poisson curve with rate = median count rate of data. |
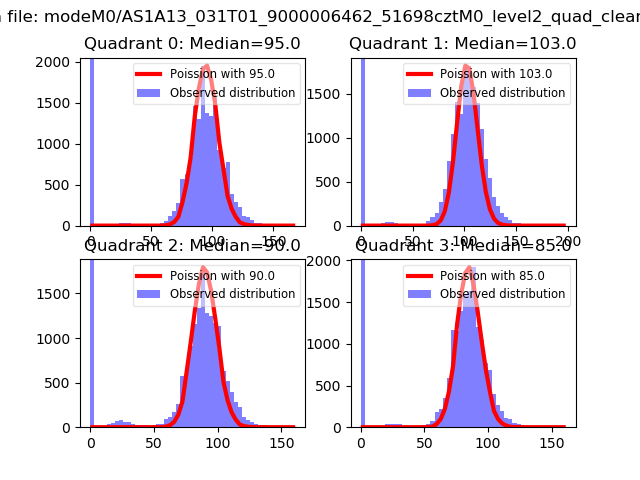 |
 |
| Quadrant-wise count rates Data is divided into 100 sec bins |
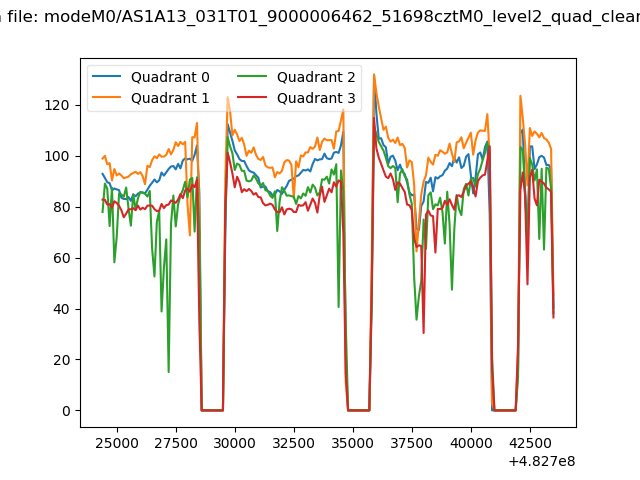 |
|
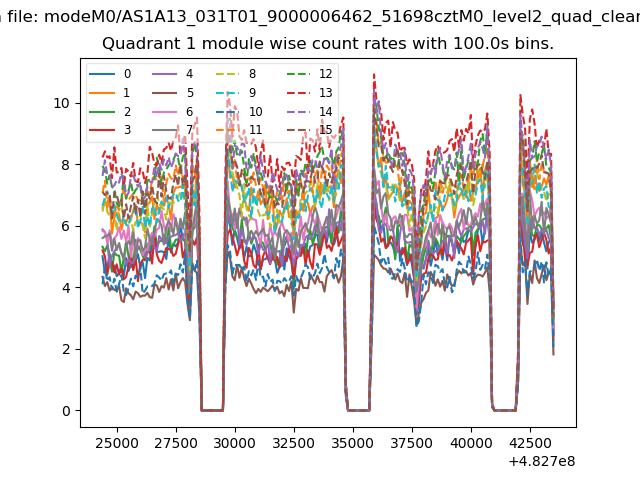
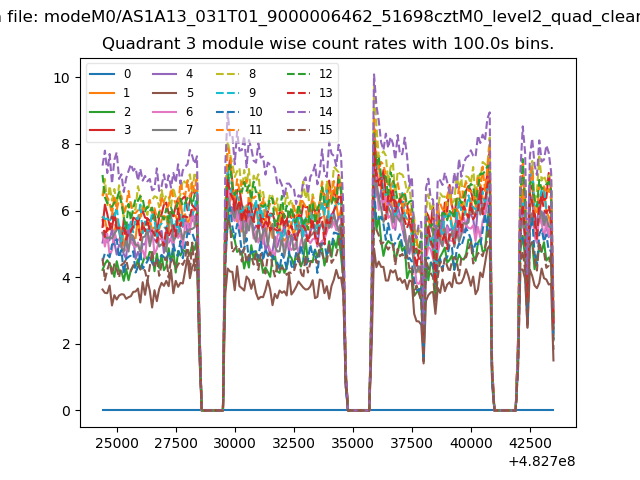
| Module-wise count rates for Quadrant A Data is divided into 100 sec bins |
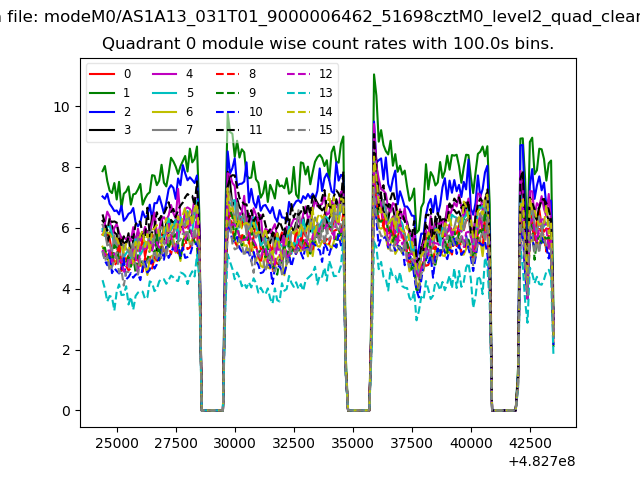 |
 |
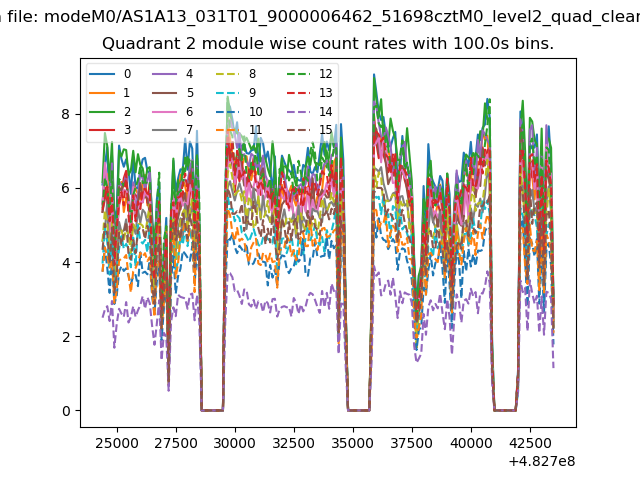
| Module-wise count rates for Quadrant B Data is divided into 100 sec bins |
 |
 |
| Module-wise count rates for Quadrant C Data is divided into 100 sec bins |
 |
 |
| Module-wise count rates for Quadrant D Data is divided into 100 sec bins |
 |
 |
| Parameter | Plot |
|---|---|
| CZT HV Monitor |  |
| D_VDD | 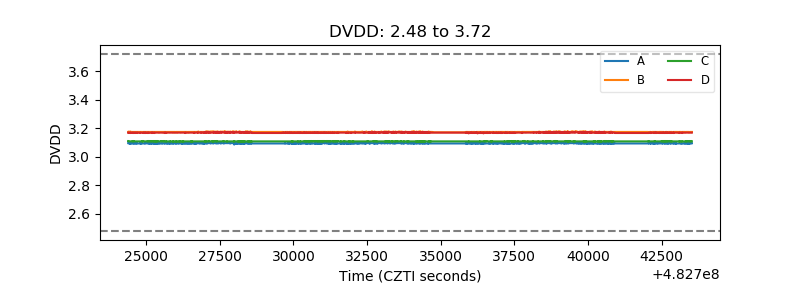 |
| Temperature 1 | 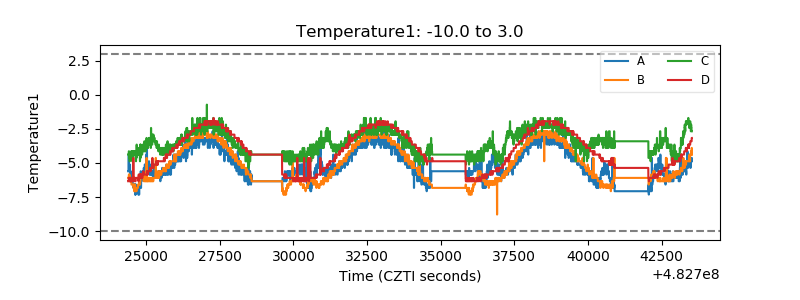 |
| Veto HV Monitor | 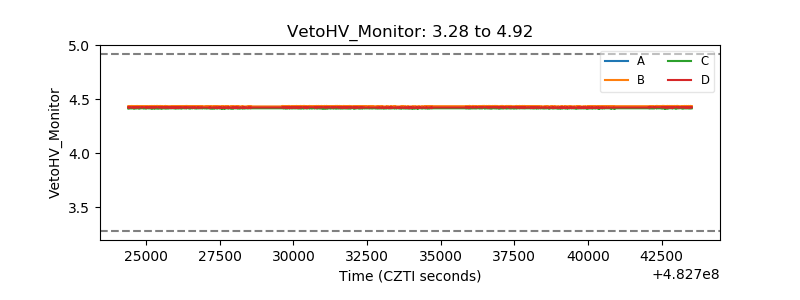 |
| Veto LLD | 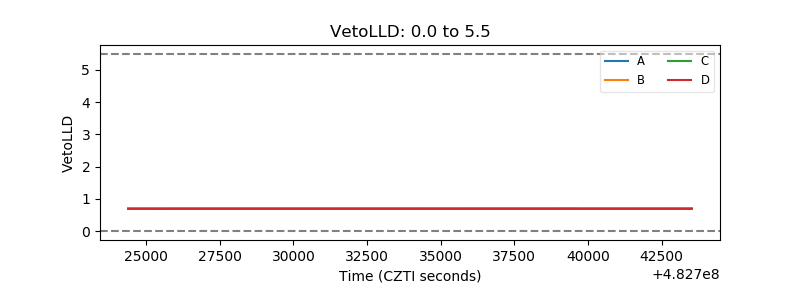 |
| Alpha Counter | 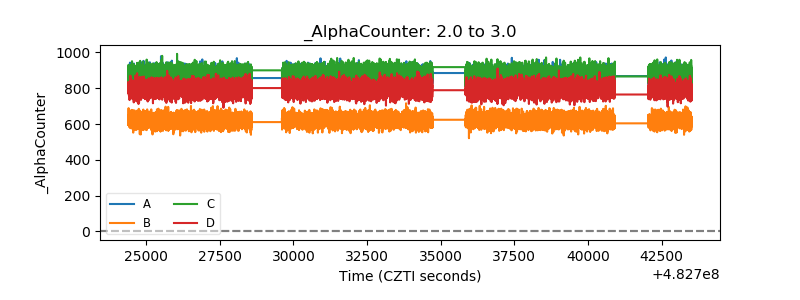 |
| _CPM_Rate | 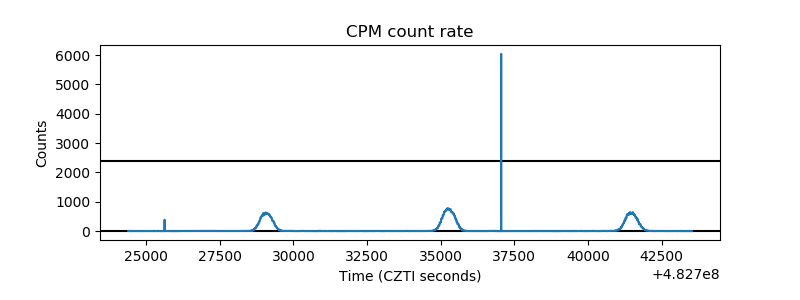 |
| CZT Counter | 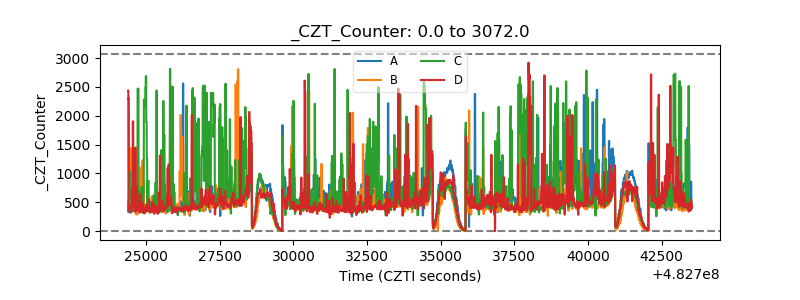 |
| +2.5 Volts monitor | 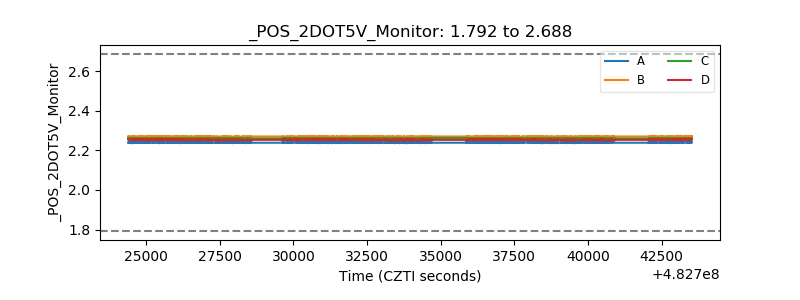 |
| +5 Volts monitor | 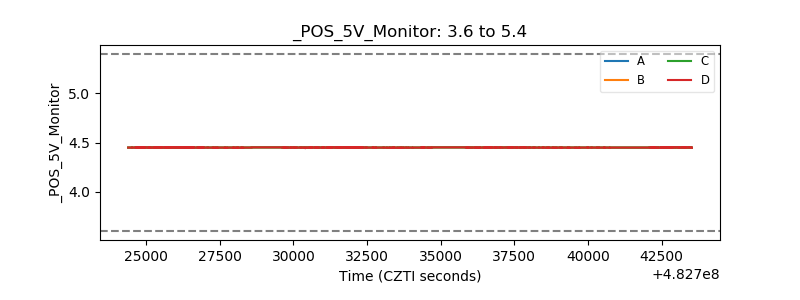 |
| _ROLL_ROT | 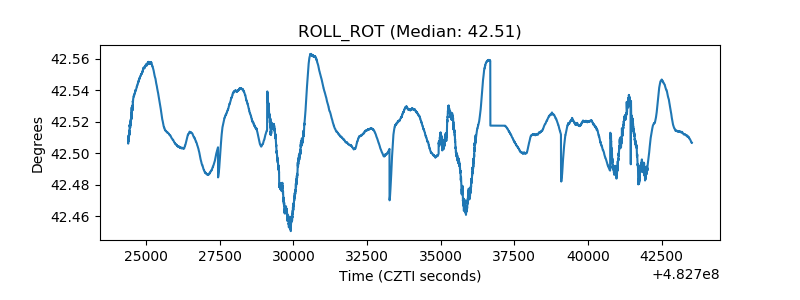 |
| _Roll_DEC | 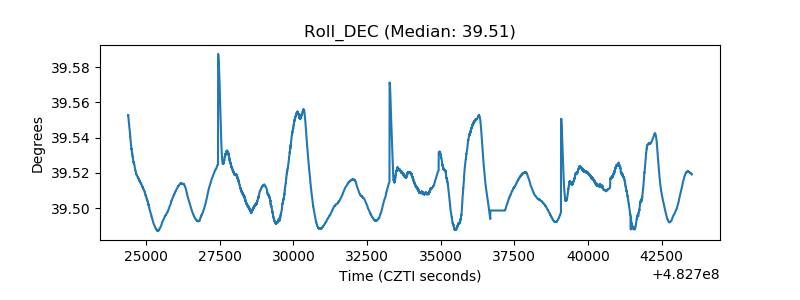 |
| _Roll_RA | 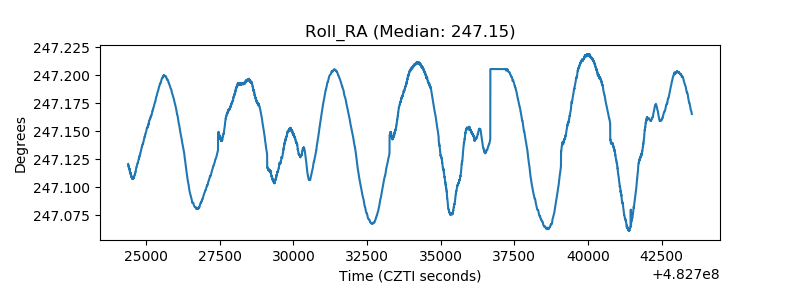 |
| Veto Counter | 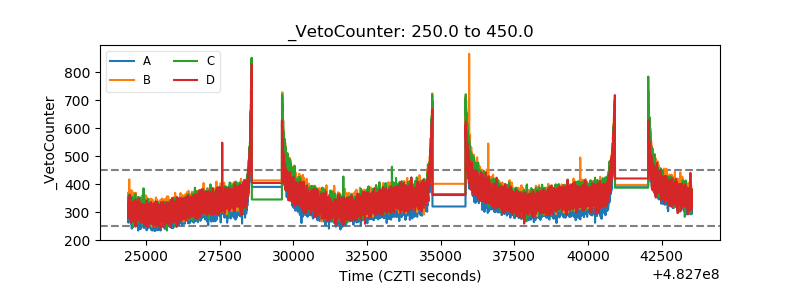 |