| Param | Original file | Final file |
|---|---|---|
| Filename | modeM0/AS1A13_031T01_9000006462_51699cztM0_level2.fits | modeM0/AS1A13_031T01_9000006462_51699cztM0_level2_quad_clean.evt |
| Size (bytes) | 497,851,200 | 98,867,520 |
| Size | 474.8 MB | 94.3 MB |
| Events in quadrant A | 4,642,801 | 646,747 |
| Events in quadrant B | 3,644,598 | 708,392 |
| Events in quadrant C | 5,827,413 | 575,739 |
| Events in quadrant D | 3,792,607 | 594,833 |
| Mode M9 | |||
|---|---|---|---|
| Quadrant | BADHDUFLAG | Total packets | Discarded packets |
| A | 0 | 14 | 0 |
| B | 0 | 15 | 0 |
| C | 0 | 15 | 0 |
| D | 0 | 15 | 0 |
| Mode M0 | |||
|---|---|---|---|
| Quadrant | BADHDUFLAG | Total packets | Discarded packets |
| A | 0 | 18269 | 2 |
| B | 0 | 15511 | 2 |
| C | 0 | 21936 | 2 |
| D | 0 | 16083 | 2 |
| Mode SS | |||
|---|---|---|---|
| Quadrant | BADHDUFLAG | Total packets | Discarded packets |
| A | 0 | 136 | 0 |
| B | 0 | 136 | 0 |
| C | 0 | 136 | 0 |
| D | 0 | 136 | 0 |
| Quadrant | Total seconds | Saturated seconds | Saturation percentage |
|---|---|---|---|
| A | 6716 | 193 | 2.873734% |
| B | 6716 | 191 | 2.843955% |
| C | 6716 | 778 | 11.584276% |
| D | 6716 | 112 | 1.667659% |
Noise dominated data is calculated using 1-second bins in cleaned event files. If a bin has >2000 counts, and if more than 50% of those come from <1% of pixels, then it is considered to be noise-dominated and hence unusable.
| Quadrant | # 1 sec bins | Bins with >0 counts | Bins with >2000 counts | High rate bins dominated by noise | Noise dominated (total time) | Noise dominated (detector-on time) | Marked lightcurve |
|---|---|---|---|---|---|---|---|
| A | 7826 | 6717 | 53 | 53 | 0.68% | 0.79% | 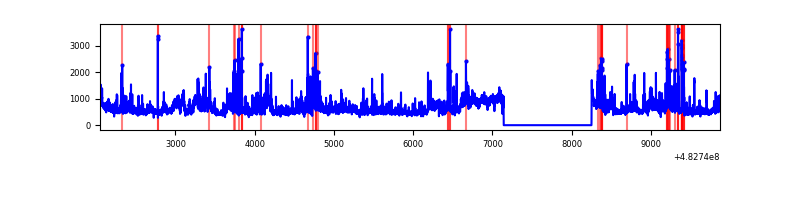 |
| B | 7826 | 6717 | 47 | 47 | 0.60% | 0.70% | 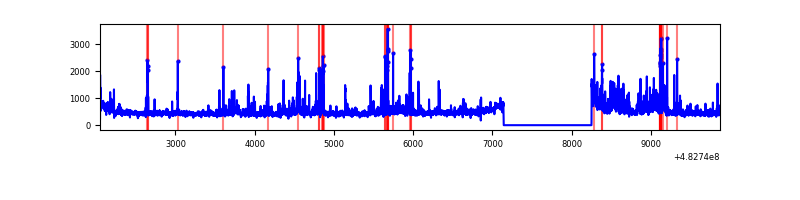 |
| C | 7826 | 6717 | 548 | 548 | 7.00% | 8.16% |  |
| D | 7826 | 6717 | 81 | 81 | 1.04% | 1.21% | 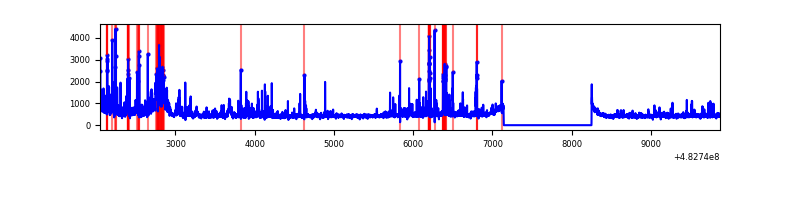 |
Top three noisy pixels from each quadrant. If the there are fewer than three noisy pixels in the level2.evt file, extra rows are filled as -1
| Pixel properties | Quadrant properties | ||||||
|---|---|---|---|---|---|---|---|
| Quadrant | DetID | PixID | Counts | Sigma | Mean | Median | Sigma |
| A | 9 | 191 | 582204 | 3254.98 | 737 | 718 | 178.6 |
| A | 12 | 3 | 472137 | 2638.86 | 737 | 718 | 178.6 |
| A | 3 | 14 | 223171 | 1245.22 | 737 | 718 | 178.6 |
| B | 8 | 128 | 220920 | 1408.09 | 732 | 707 | 156.4 |
| B | 1 | 223 | 109324 | 694.52 | 732 | 707 | 156.4 |
| B | 0 | 213 | 102413 | 650.33 | 732 | 707 | 156.4 |
| C | 0 | 192 | 1367252 | 7412.85 | 677 | 671 | 184.4 |
| C | 15 | 189 | 1114078 | 6039.54 | 677 | 671 | 184.4 |
| C | 9 | 38 | 182045 | 983.84 | 677 | 671 | 184.4 |
| D | 15 | 107 | 465756 | 2367.77 | 711 | 686 | 196.4 |
| D | 8 | 176 | 110427 | 558.71 | 711 | 686 | 196.4 |
| D | 3 | 12 | 87150 | 440.21 | 711 | 686 | 196.4 |
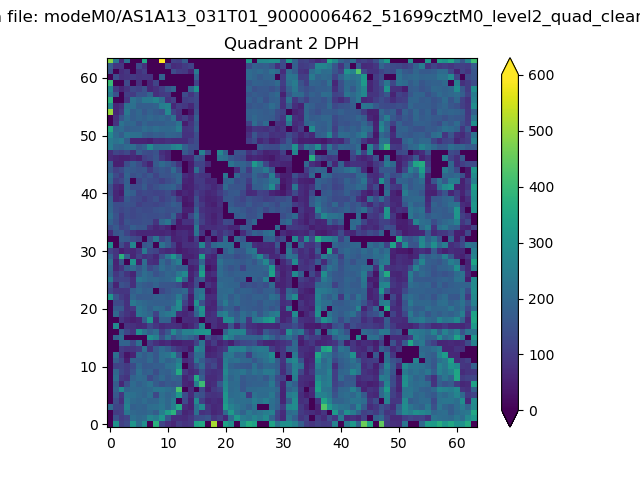
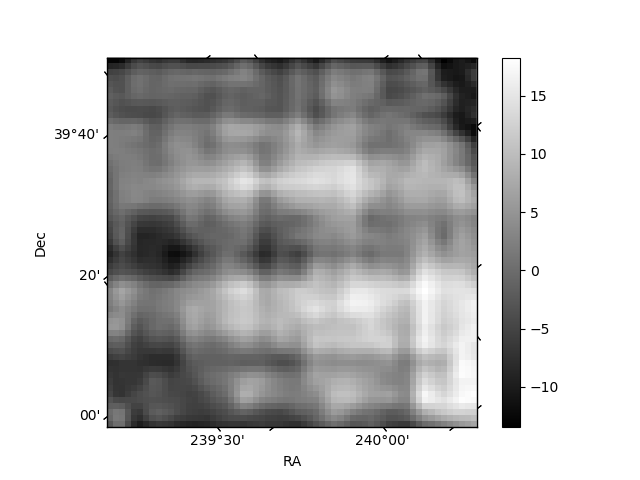
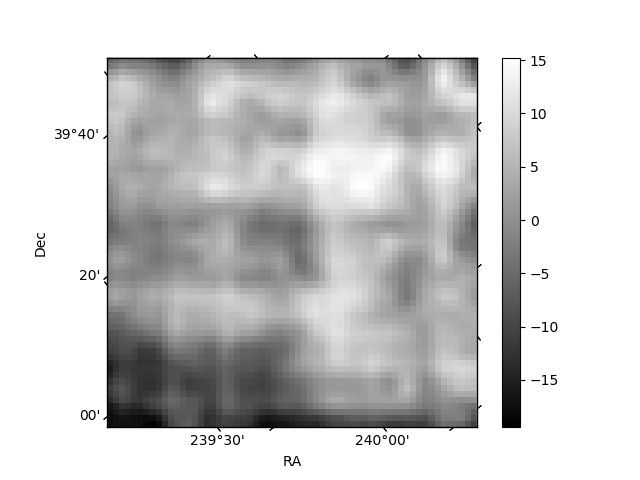
Histogram calculated using DETX and DETY for each event in the final _common_clean file
| Quadrant A | 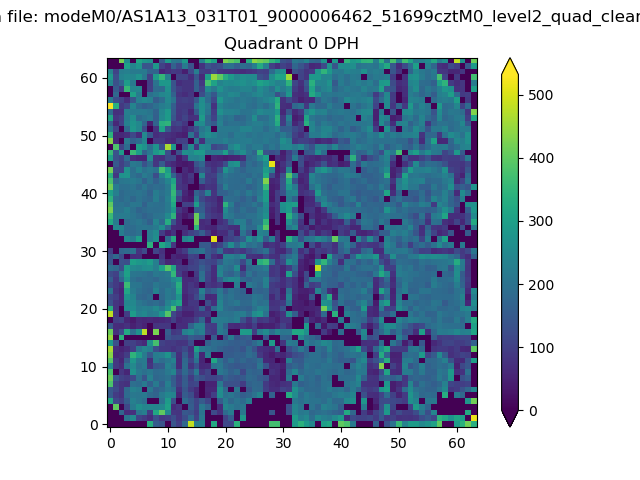 |
 |
Quadrant B |
|---|---|---|---|
| Quadrant D | 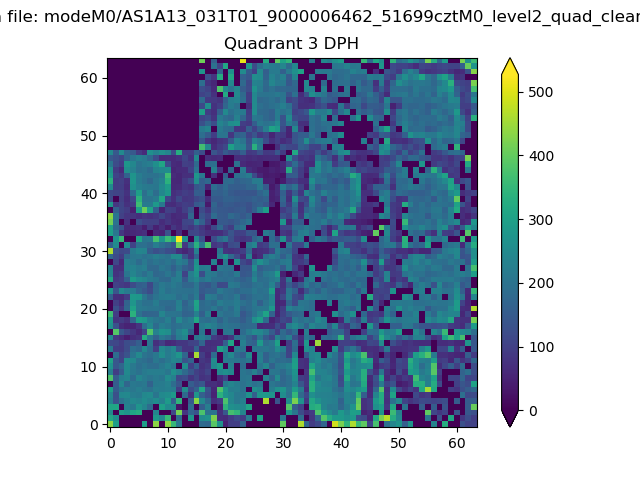 |
 |
Quadrant C |
| Plot type | Count rate plots | Images |
|---|---|---|
| Comparison with Poisson distribution Blue bars denote a histogram of data divided into 1 sec bins. Red curve is a Poisson curve with rate = median count rate of data. |
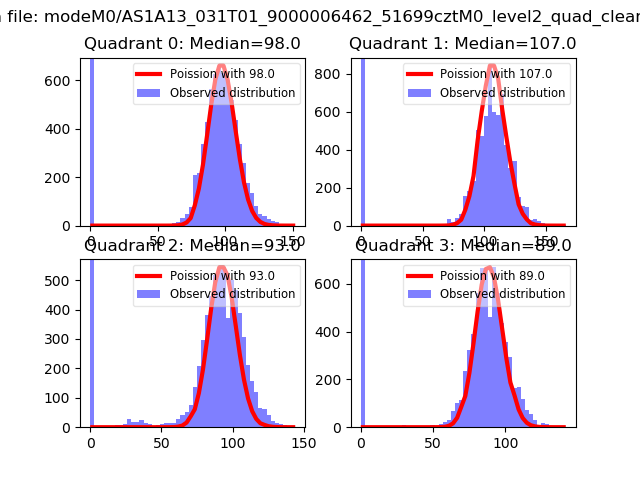 |
 |
| Quadrant-wise count rates Data is divided into 100 sec bins |
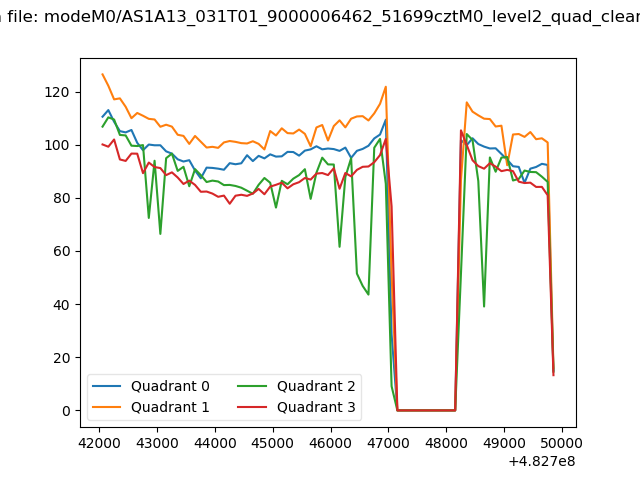 |
|
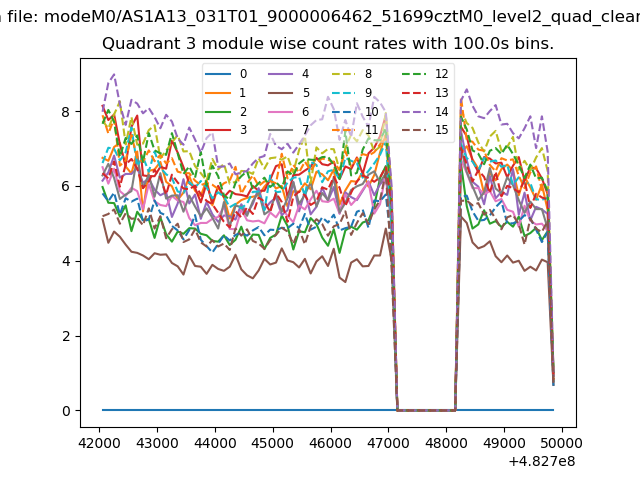
| Module-wise count rates for Quadrant A Data is divided into 100 sec bins |
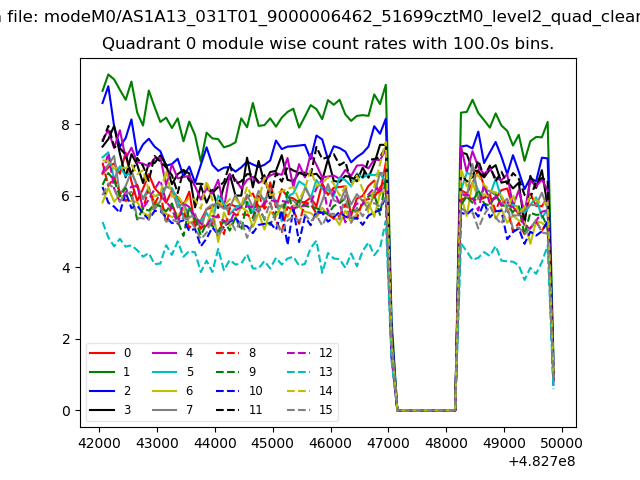 |
 |
| Module-wise count rates for Quadrant B Data is divided into 100 sec bins |
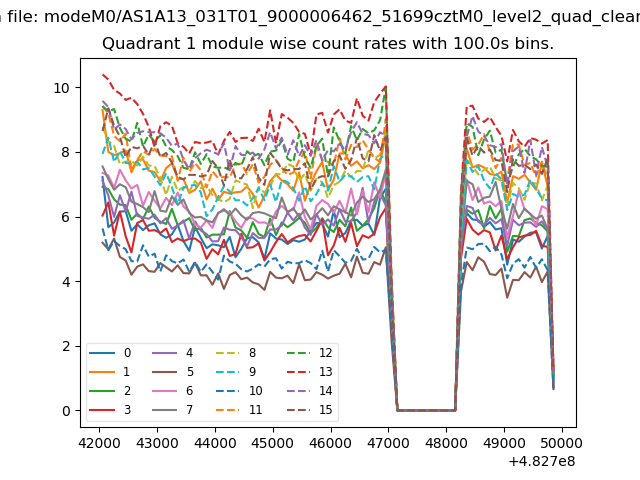 |
 |
| Module-wise count rates for Quadrant C Data is divided into 100 sec bins |
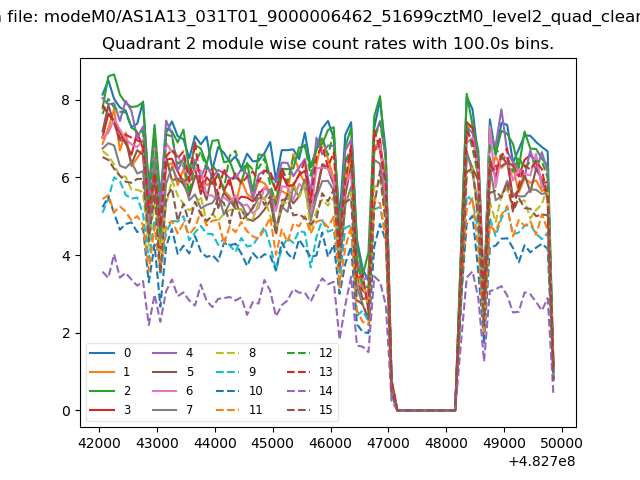 |
 |
| Module-wise count rates for Quadrant D Data is divided into 100 sec bins |
 |
 |
| Parameter | Plot |
|---|---|
| CZT HV Monitor | 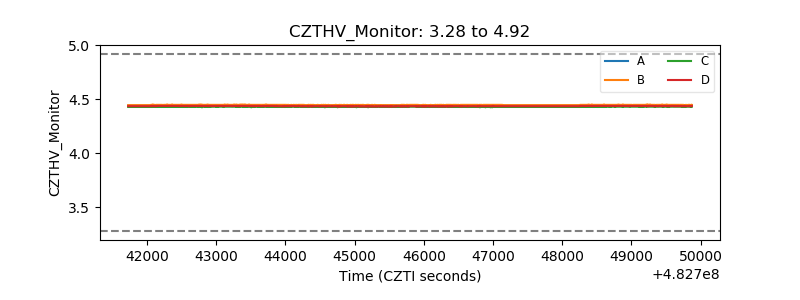 |
| D_VDD | 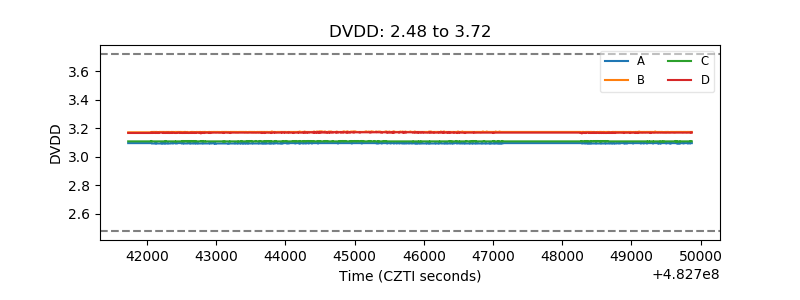 |
| Temperature 1 | 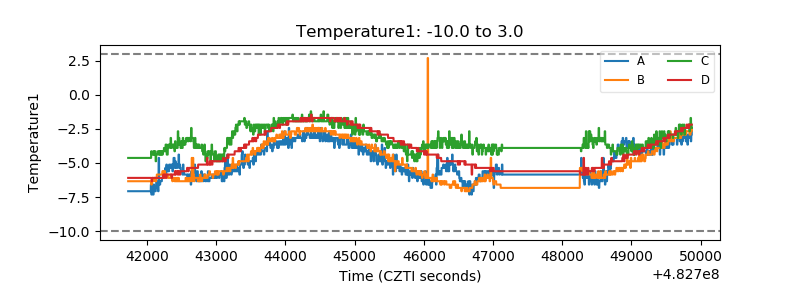 |
| Veto HV Monitor | 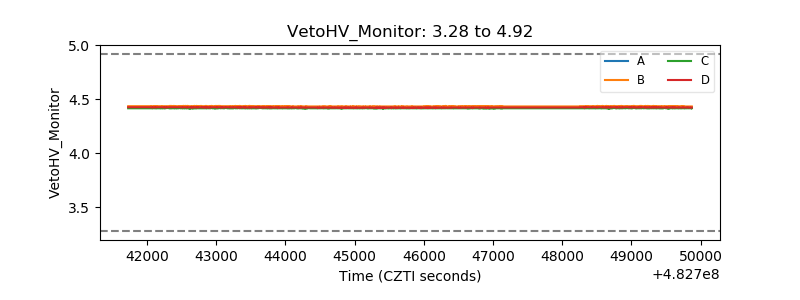 |
| Veto LLD | 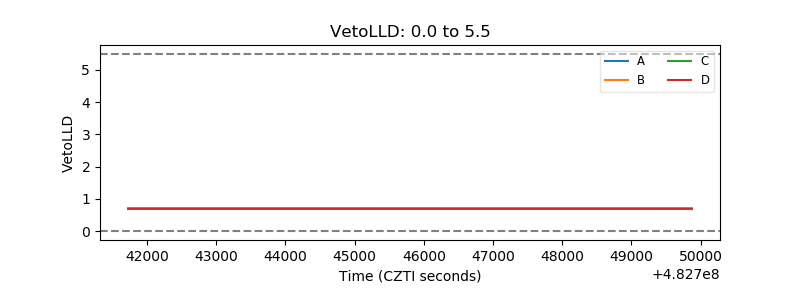 |
| Alpha Counter | 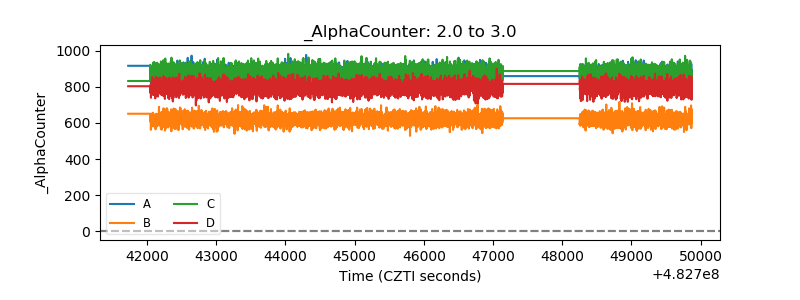 |
| _CPM_Rate | 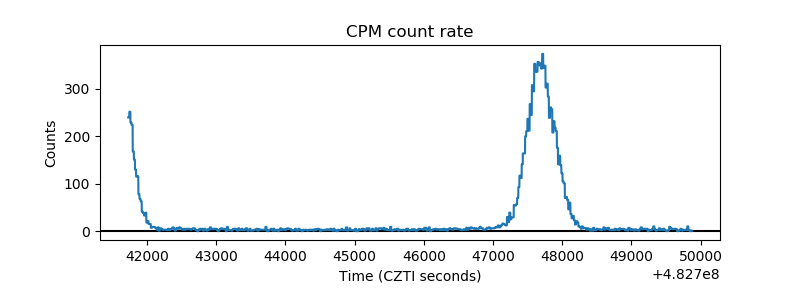 |
| CZT Counter | 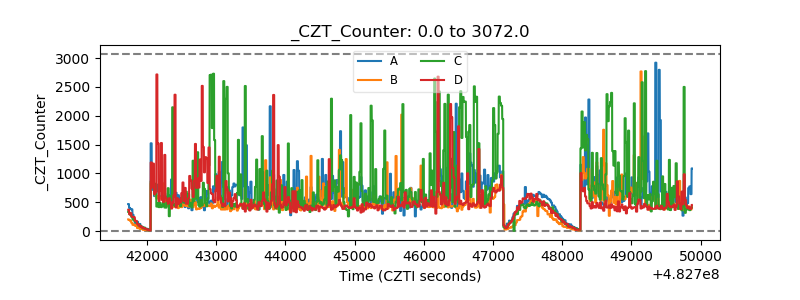 |
| +2.5 Volts monitor | 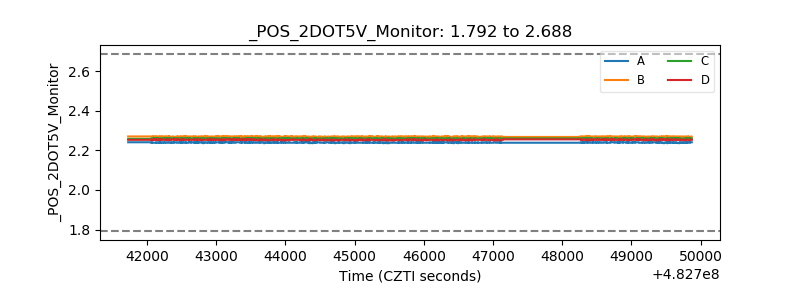 |
| +5 Volts monitor | 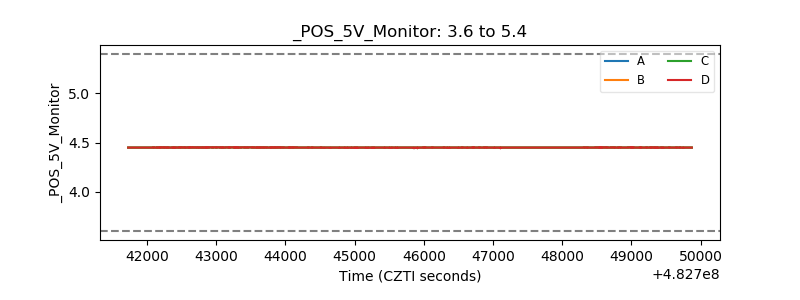 |
| _ROLL_ROT | 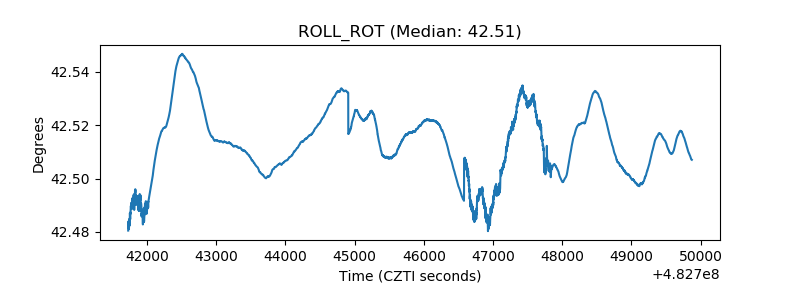 |
| _Roll_DEC | 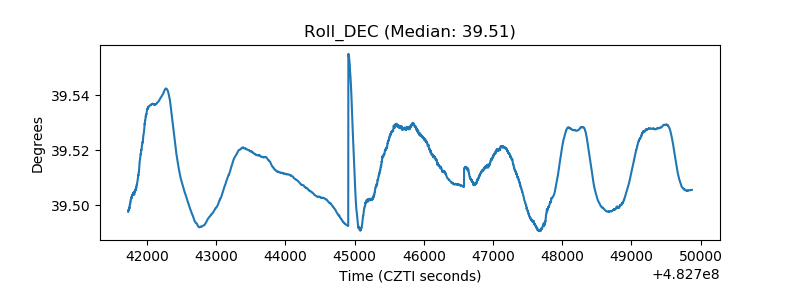 |
| _Roll_RA | 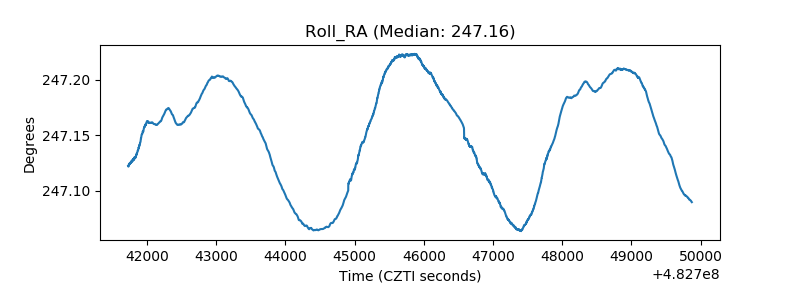 |
| Veto Counter | 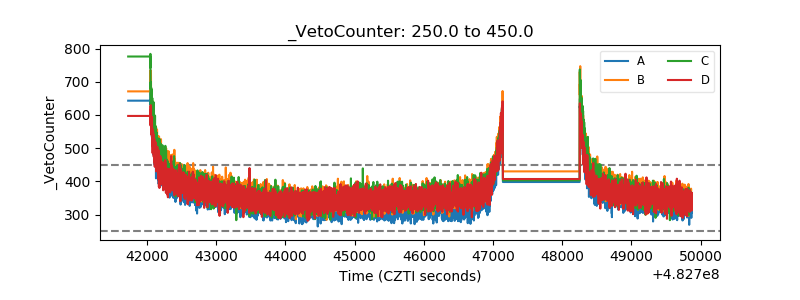 |