| Param | Original file | Final file |
|---|---|---|
| Filename | modeM0/AS1A13_031T01_9000006462_51700cztM0_level2.fits | modeM0/AS1A13_031T01_9000006462_51700cztM0_level2_quad_clean.evt |
| Size (bytes) | 605,165,760 | 92,790,720 |
| Size | 577.1 MB | 88.5 MB |
| Events in quadrant A | 5,773,933 | 621,602 |
| Events in quadrant B | 3,802,258 | 689,254 |
| Events in quadrant C | 8,374,289 | 461,108 |
| Events in quadrant D | 3,925,495 | 566,096 |
| Mode M9 | |||
|---|---|---|---|
| Quadrant | BADHDUFLAG | Total packets | Discarded packets |
| A | 0 | 10 | 0 |
| B | 0 | 10 | 0 |
| C | 0 | 10 | 0 |
| D | 0 | 10 | 0 |
| Mode M0 | |||
|---|---|---|---|
| Quadrant | BADHDUFLAG | Total packets | Discarded packets |
| A | 0 | 21859 | 1 |
| B | 0 | 15983 | 1 |
| C | 0 | 29657 | 6 |
| D | 0 | 16369 | 1 |
| Mode SS | |||
|---|---|---|---|
| Quadrant | BADHDUFLAG | Total packets | Discarded packets |
| A | 0 | 136 | 0 |
| B | 0 | 136 | 0 |
| C | 0 | 136 | 0 |
| D | 0 | 136 | 0 |
| Quadrant | Total seconds | Saturated seconds | Saturation percentage |
|---|---|---|---|
| A | 6770 | 367 | 5.420975% |
| B | 6770 | 211 | 3.116691% |
| C | 6769 | 2051 | 30.299897% |
| D | 6770 | 299 | 4.416544% |
Noise dominated data is calculated using 1-second bins in cleaned event files. If a bin has >2000 counts, and if more than 50% of those come from <1% of pixels, then it is considered to be noise-dominated and hence unusable.
| Quadrant | # 1 sec bins | Bins with >0 counts | Bins with >2000 counts | High rate bins dominated by noise | Noise dominated (total time) | Noise dominated (detector-on time) | Marked lightcurve |
|---|---|---|---|---|---|---|---|
| A | 7695 | 6771 | 156 | 156 | 2.03% | 2.30% | 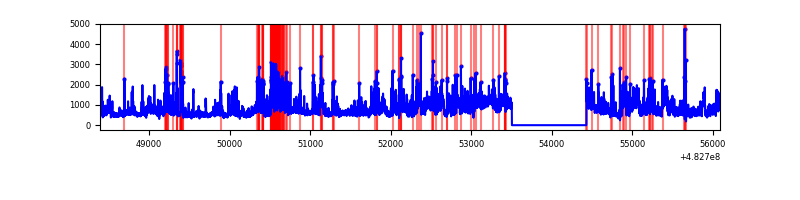 |
| B | 7695 | 6771 | 35 | 35 | 0.45% | 0.52% | 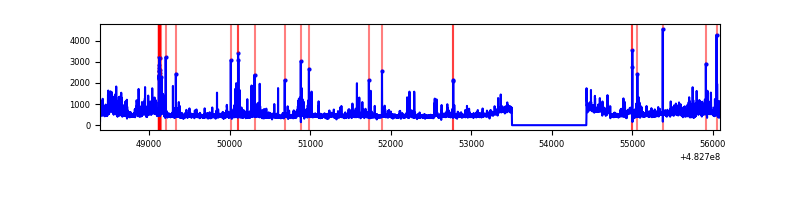 |
| C | 7694 | 6770 | 1477 | 1477 | 19.20% | 21.82% | 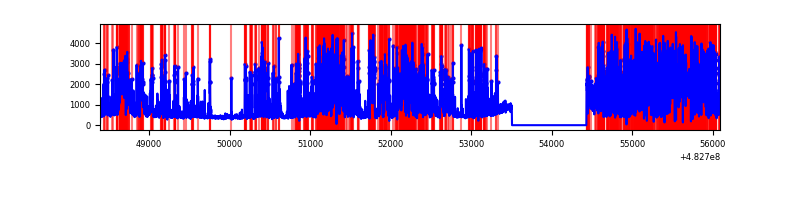 |
| D | 7695 | 6771 | 183 | 183 | 2.38% | 2.70% | 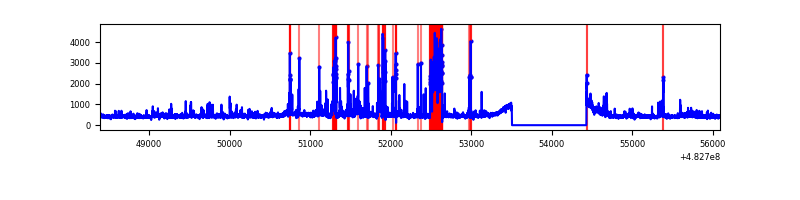 |
Top three noisy pixels from each quadrant. If the there are fewer than three noisy pixels in the level2.evt file, extra rows are filled as -1
| Pixel properties | Quadrant properties | ||||||
|---|---|---|---|---|---|---|---|
| Quadrant | DetID | PixID | Counts | Sigma | Mean | Median | Sigma |
| A | 9 | 191 | 888126 | 4938.94 | 734 | 718 | 179.7 |
| A | 12 | 3 | 817746 | 4547.24 | 734 | 718 | 179.7 |
| A | 3 | 14 | 368261 | 2045.59 | 734 | 718 | 179.7 |
| B | 0 | 213 | 261628 | 1658.72 | 734 | 709 | 157.3 |
| B | 8 | 128 | 251749 | 1595.92 | 734 | 709 | 157.3 |
| B | 1 | 223 | 78421 | 494.03 | 734 | 709 | 157.3 |
| C | 15 | 231 | 2027895 | 12116.25 | 614 | 610 | 167.3 |
| C | 0 | 192 | 1784822 | 10663.5 | 614 | 610 | 167.3 |
| C | 15 | 189 | 1580223 | 9440.7 | 614 | 610 | 167.3 |
| D | 3 | 12 | 508152 | 2584.49 | 714 | 691 | 196.3 |
| D | 8 | 176 | 151994 | 770.58 | 714 | 691 | 196.3 |
| D | 2 | 249 | 79227 | 399.98 | 714 | 691 | 196.3 |
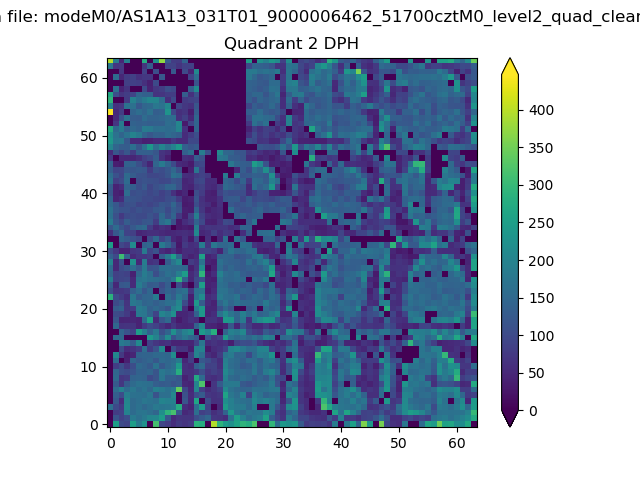
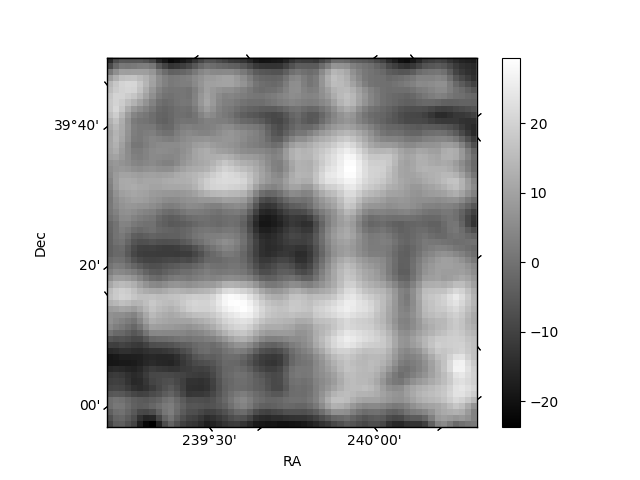
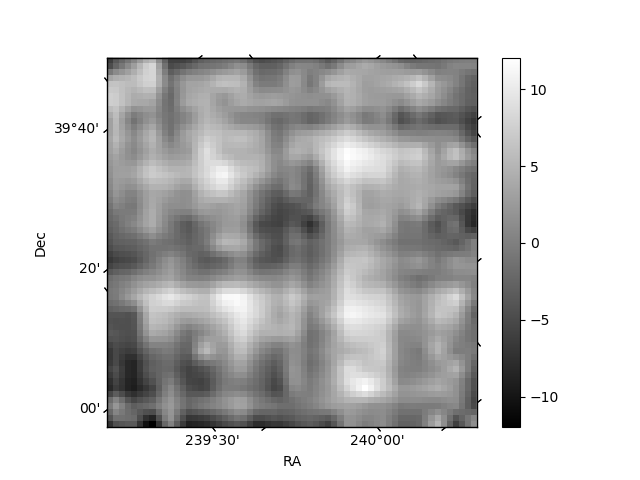
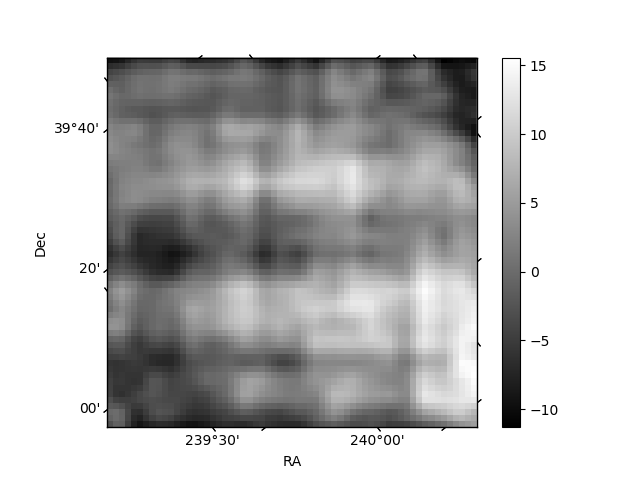
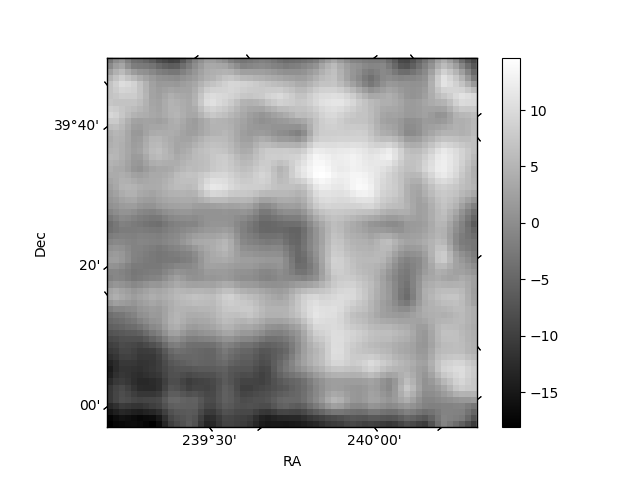
Histogram calculated using DETX and DETY for each event in the final _common_clean file
| Quadrant A | 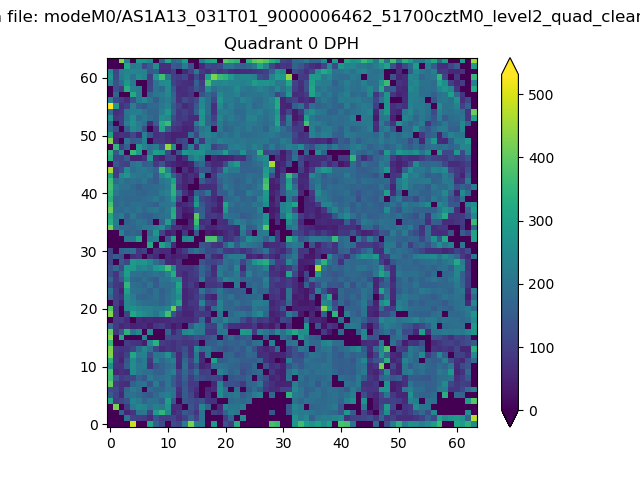 |
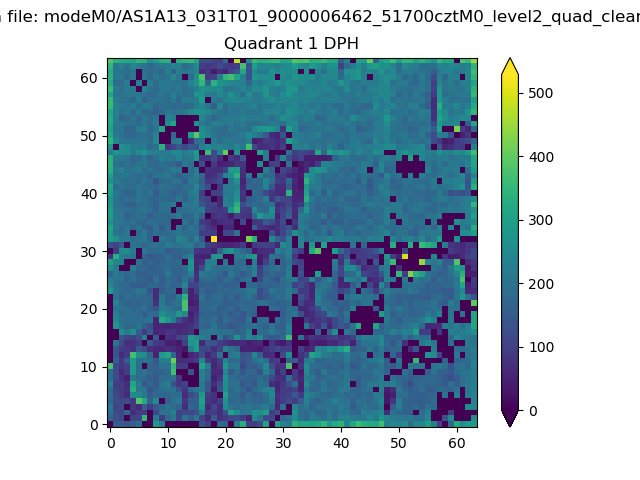 |
Quadrant B |
|---|---|---|---|
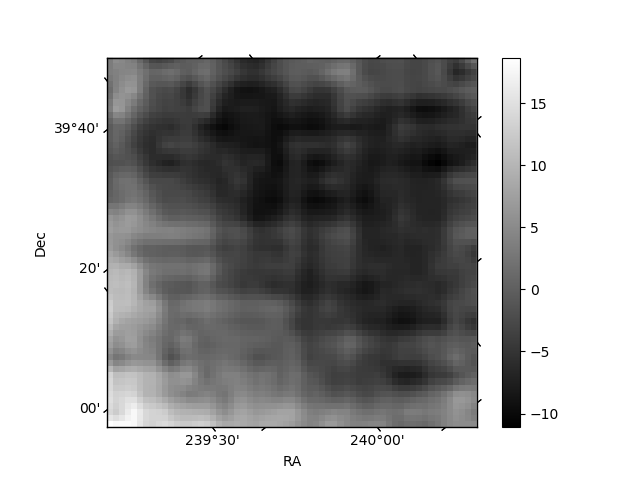
| Quadrant D | 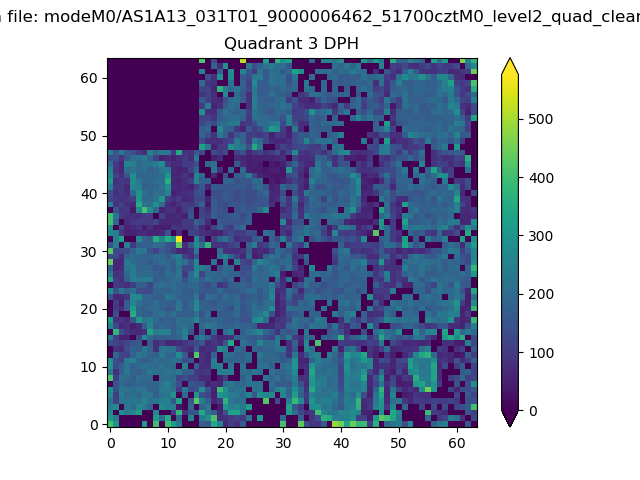 |
 |
Quadrant C |
| Plot type | Count rate plots | Images |
|---|---|---|
| Comparison with Poisson distribution Blue bars denote a histogram of data divided into 1 sec bins. Red curve is a Poisson curve with rate = median count rate of data. |
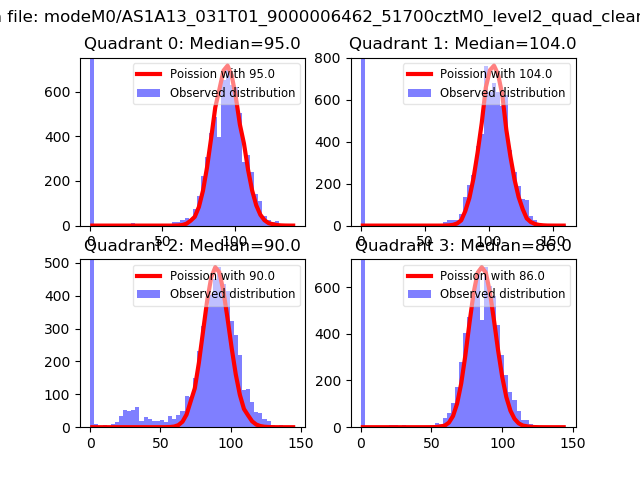 |
 |
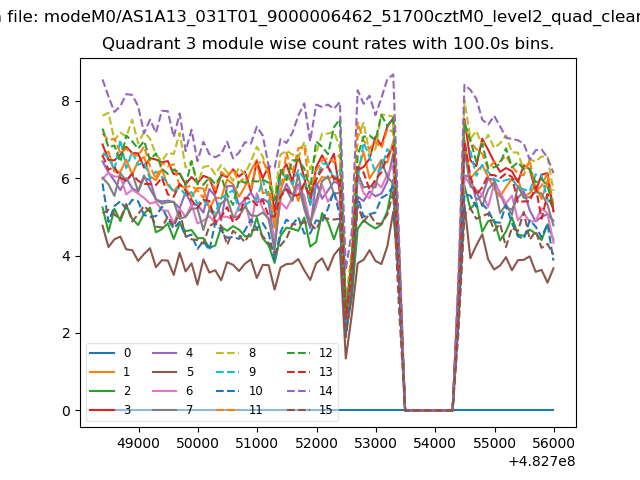
| Quadrant-wise count rates Data is divided into 100 sec bins |
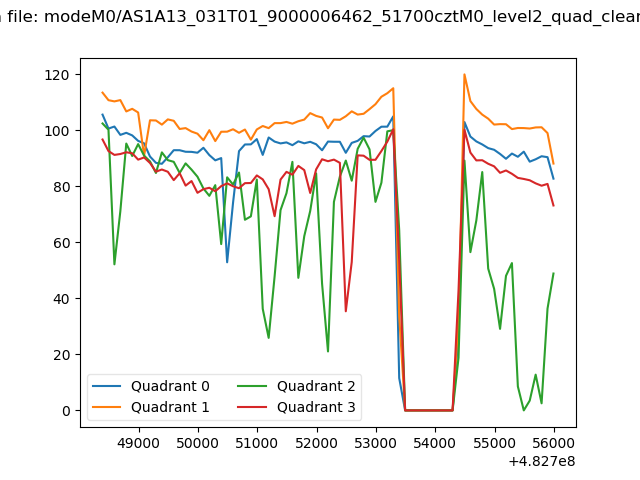 |
|
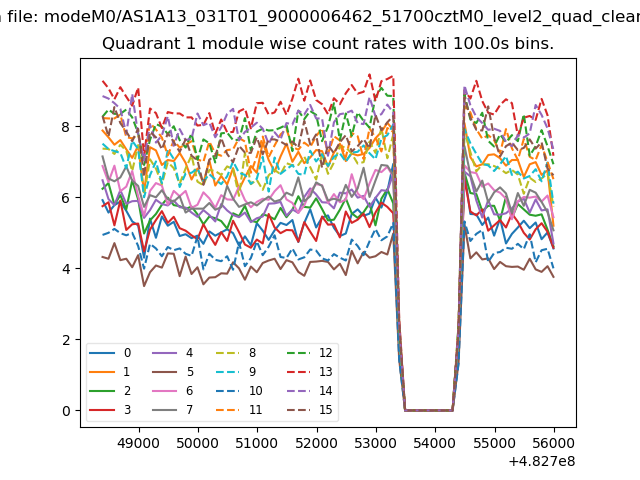
| Module-wise count rates for Quadrant A Data is divided into 100 sec bins |
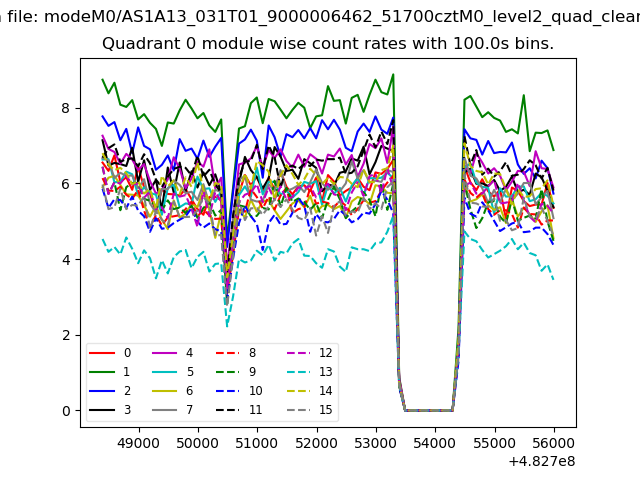 |
 |
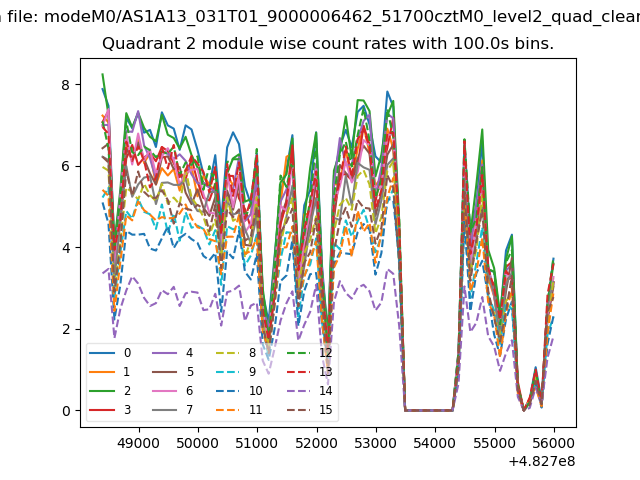
| Module-wise count rates for Quadrant B Data is divided into 100 sec bins |
 |
 |
| Module-wise count rates for Quadrant C Data is divided into 100 sec bins |
 |
 |
| Module-wise count rates for Quadrant D Data is divided into 100 sec bins |
 |
 |
| Parameter | Plot |
|---|---|
| CZT HV Monitor | 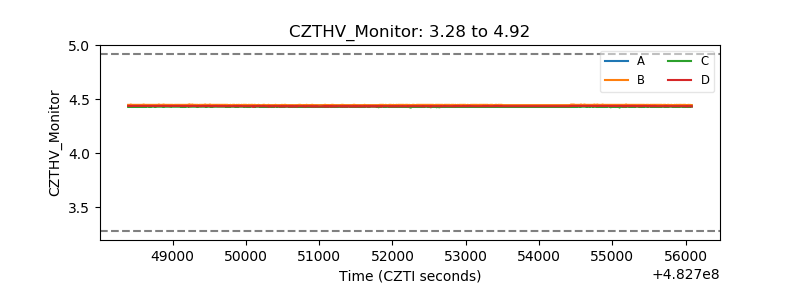 |
| D_VDD | 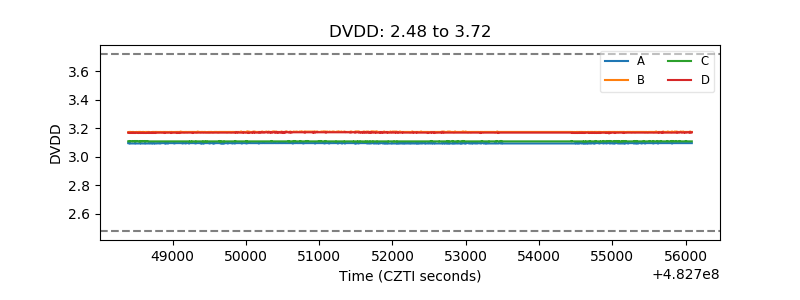 |
| Temperature 1 | 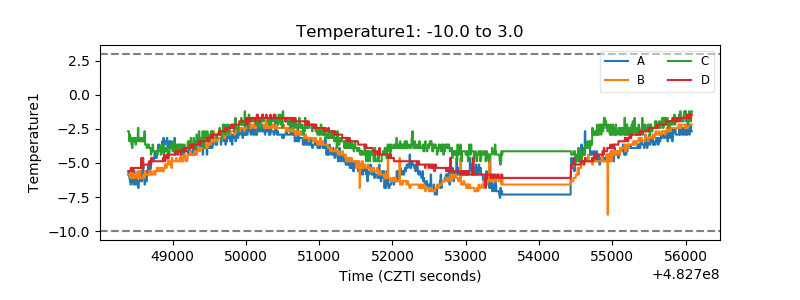 |
| Veto HV Monitor | 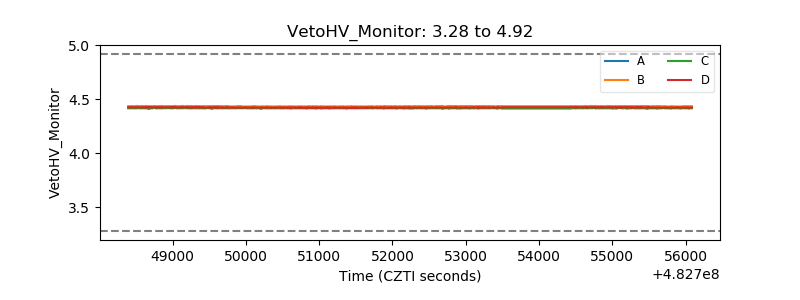 |
| Veto LLD | 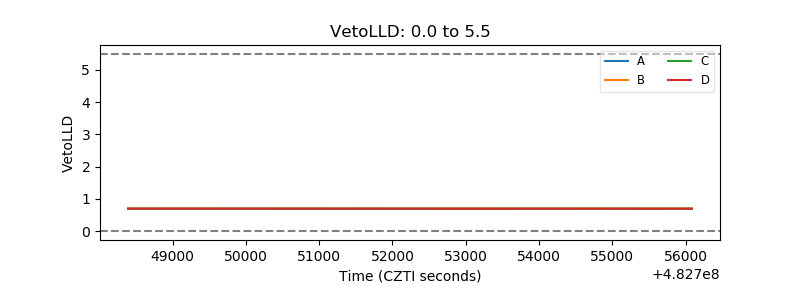 |
| Alpha Counter | 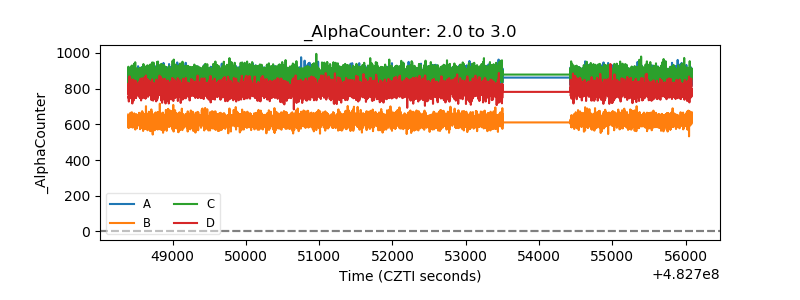 |
| _CPM_Rate | 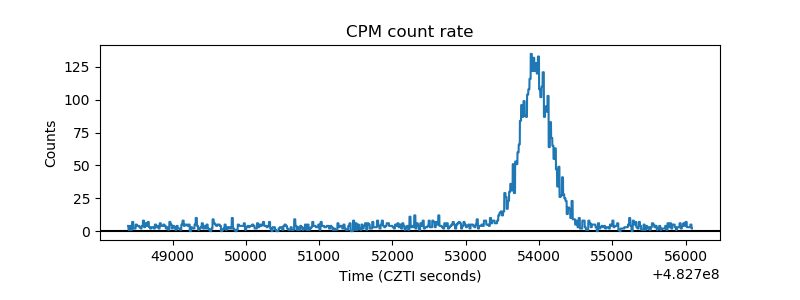 |
| CZT Counter | 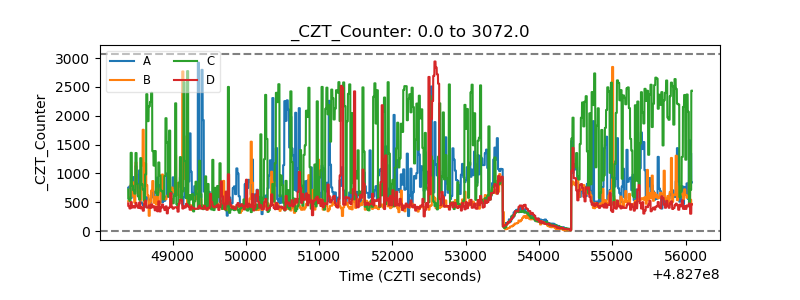 |
| +2.5 Volts monitor | 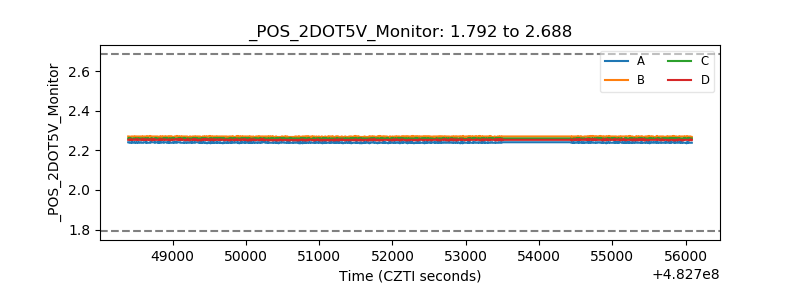 |
| +5 Volts monitor | 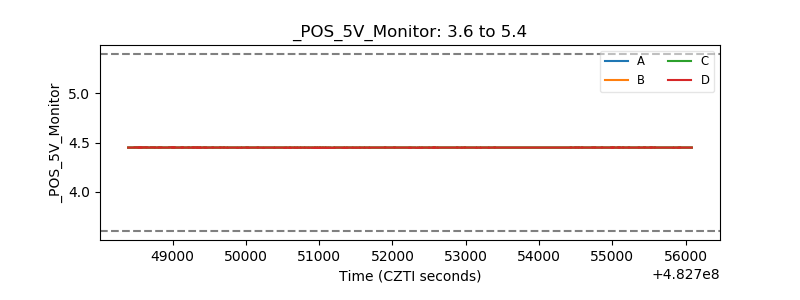 |
| _ROLL_ROT | 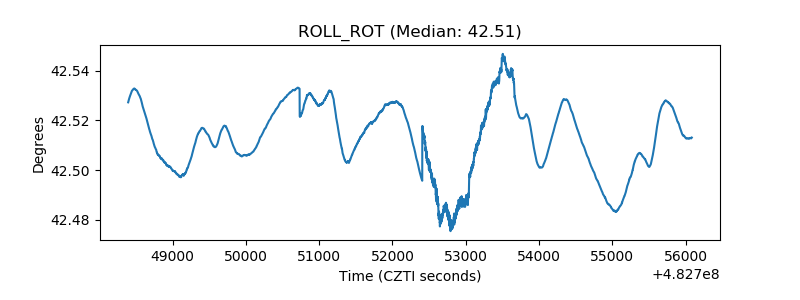 |
| _Roll_DEC | 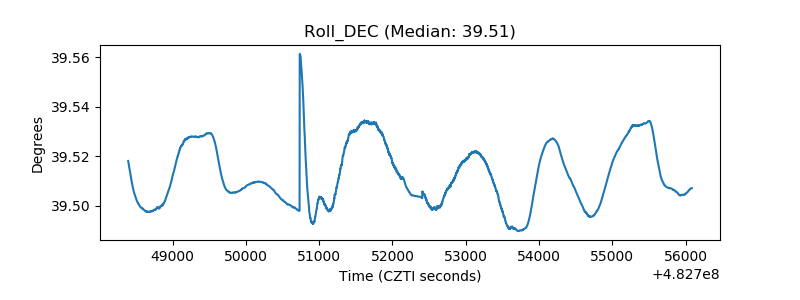 |
| _Roll_RA | 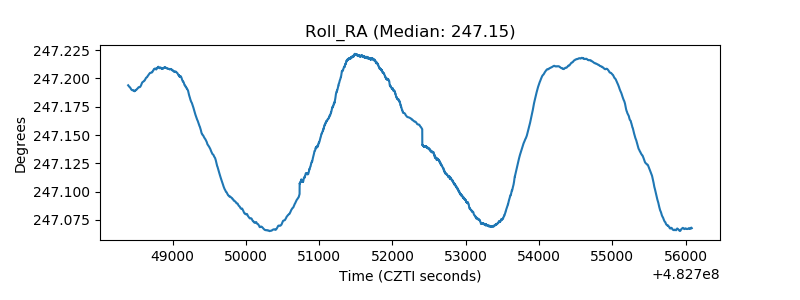 |
| Veto Counter | 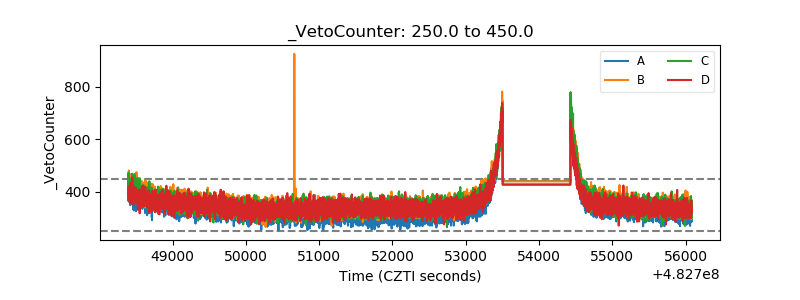 |