| Param | Original file | Final file |
|---|---|---|
| Filename | modeM0/AS1A13_031T01_9000006462_51701cztM0_level2.fits | modeM0/AS1A13_031T01_9000006462_51701cztM0_level2_quad_clean.evt |
| Size (bytes) | 600,194,880 | 97,145,280 |
| Size | 572.4 MB | 92.6 MB |
| Events in quadrant A | 5,602,930 | 647,520 |
| Events in quadrant B | 4,049,050 | 708,949 |
| Events in quadrant C | 8,377,510 | 497,000 |
| Events in quadrant D | 3,638,946 | 595,207 |
| Mode M9 | |||
|---|---|---|---|
| Quadrant | BADHDUFLAG | Total packets | Discarded packets |
| A | 0 | 6 | 0 |
| B | 0 | 6 | 0 |
| C | 0 | 6 | 0 |
| D | 0 | 6 | 0 |
| Mode M0 | |||
|---|---|---|---|
| Quadrant | BADHDUFLAG | Total packets | Discarded packets |
| A | 0 | 21364 | 1 |
| B | 0 | 16810 | 2 |
| C | 0 | 29779 | 1 |
| D | 0 | 15820 | 1 |
| Mode SS | |||
|---|---|---|---|
| Quadrant | BADHDUFLAG | Total packets | Discarded packets |
| A | 0 | 144 | 0 |
| B | 0 | 144 | 0 |
| C | 0 | 144 | 0 |
| D | 0 | 144 | 0 |
| Quadrant | Total seconds | Saturated seconds | Saturation percentage |
|---|---|---|---|
| A | 7073 | 325 | 4.594938% |
| B | 7073 | 222 | 3.138696% |
| C | 7073 | 1899 | 26.848579% |
| D | 7073 | 161 | 2.276262% |
Noise dominated data is calculated using 1-second bins in cleaned event files. If a bin has >2000 counts, and if more than 50% of those come from <1% of pixels, then it is considered to be noise-dominated and hence unusable.
| Quadrant | # 1 sec bins | Bins with >0 counts | Bins with >2000 counts | High rate bins dominated by noise | Noise dominated (total time) | Noise dominated (detector-on time) | Marked lightcurve |
|---|---|---|---|---|---|---|---|
| A | 7633 | 7074 | 116 | 116 | 1.52% | 1.64% | 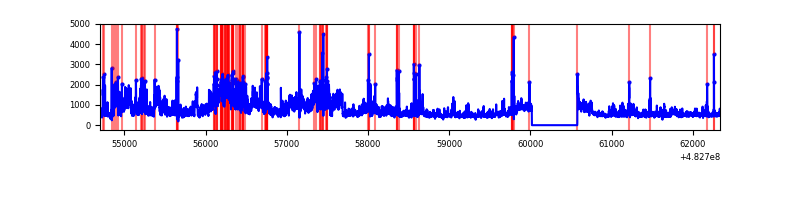 |
| B | 7633 | 7074 | 15 | 15 | 0.20% | 0.21% | 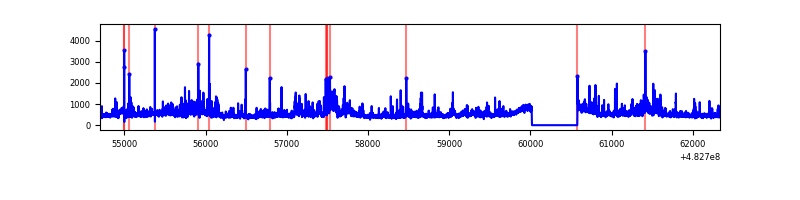 |
| C | 7633 | 7074 | 1321 | 1321 | 17.31% | 18.67% | 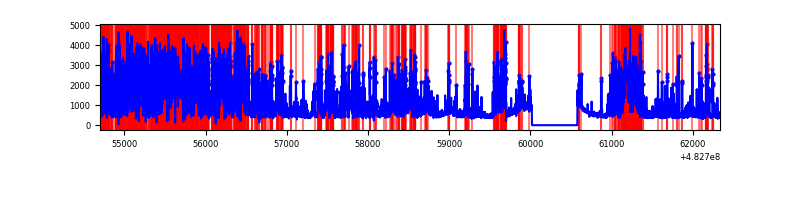 |
| D | 7633 | 7074 | 28 | 28 | 0.37% | 0.40% | 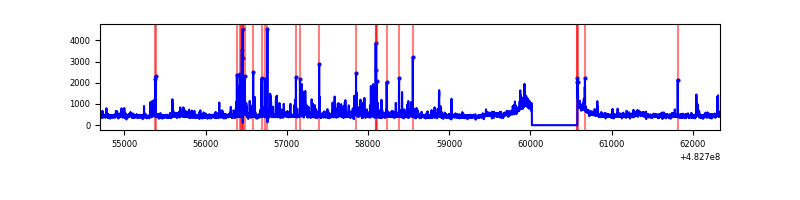 |
Top three noisy pixels from each quadrant. If the there are fewer than three noisy pixels in the level2.evt file, extra rows are filled as -1
| Pixel properties | Quadrant properties | ||||||
|---|---|---|---|---|---|---|---|
| Quadrant | DetID | PixID | Counts | Sigma | Mean | Median | Sigma |
| A | 12 | 3 | 834778 | 4461.47 | 771 | 755 | 186.9 |
| A | 3 | 14 | 609292 | 3255.27 | 771 | 755 | 186.9 |
| A | 9 | 191 | 562526 | 3005.1 | 771 | 755 | 186.9 |
| B | 10 | 254 | 218131 | 1322.66 | 764 | 735 | 164.4 |
| B | 0 | 213 | 190246 | 1153.0 | 764 | 735 | 164.4 |
| B | 10 | 44 | 180209 | 1091.94 | 764 | 735 | 164.4 |
| C | 15 | 231 | 2355443 | 13172.92 | 657 | 649 | 178.8 |
| C | 12 | 254 | 1375216 | 7689.44 | 657 | 649 | 178.8 |
| C | 0 | 192 | 997495 | 5576.44 | 657 | 649 | 178.8 |
| D | 3 | 12 | 246110 | 1172.57 | 753 | 725 | 209.3 |
| D | 5 | 173 | 63298 | 299.0 | 753 | 725 | 209.3 |
| D | 8 | 176 | 49878 | 234.87 | 753 | 725 | 209.3 |
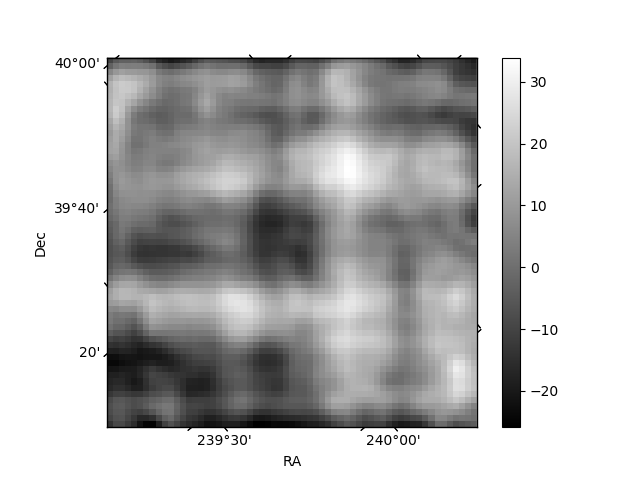
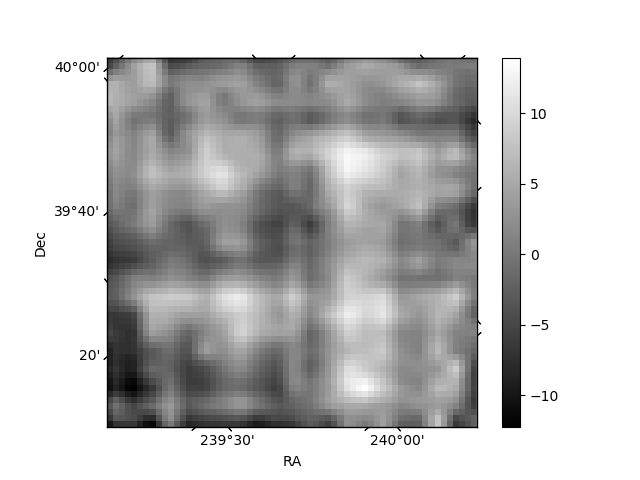
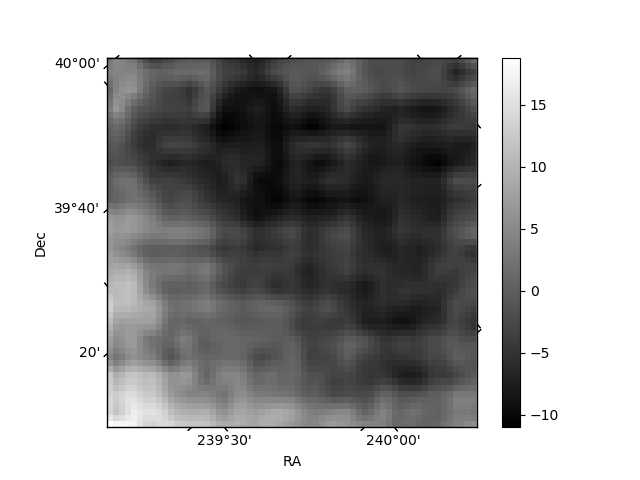
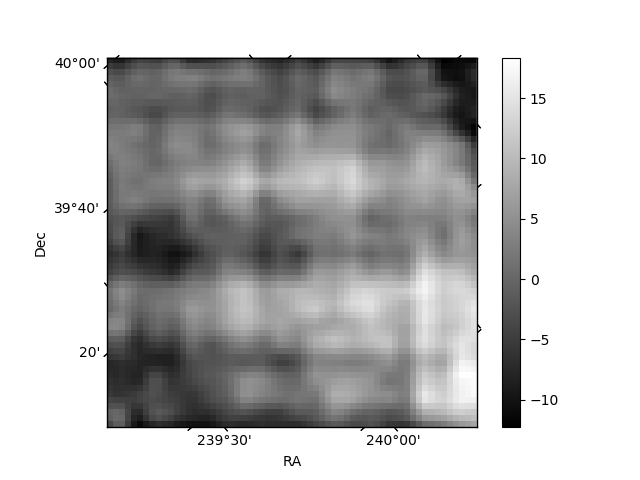
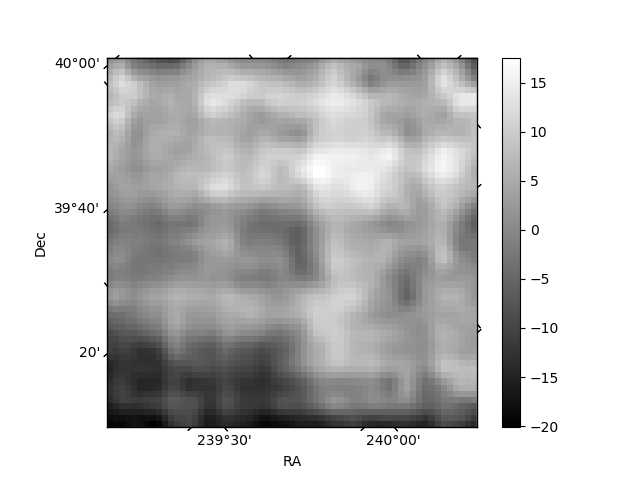
Histogram calculated using DETX and DETY for each event in the final _common_clean file
| Quadrant A | 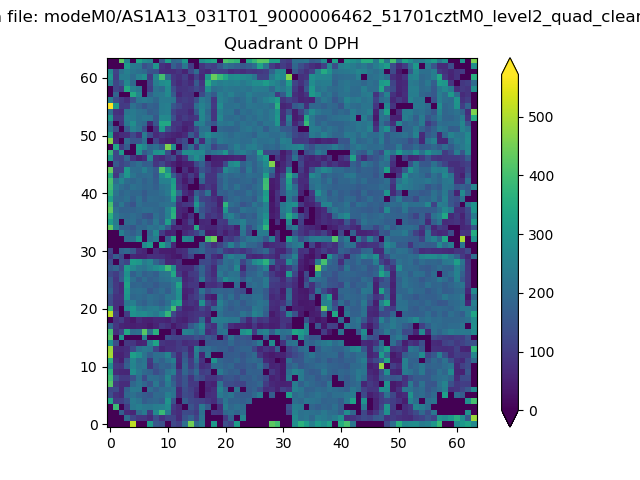 |
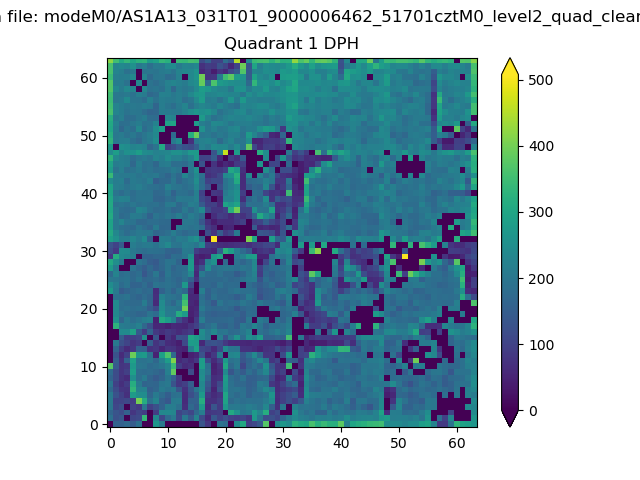 |
Quadrant B |
|---|---|---|---|
| Quadrant D | 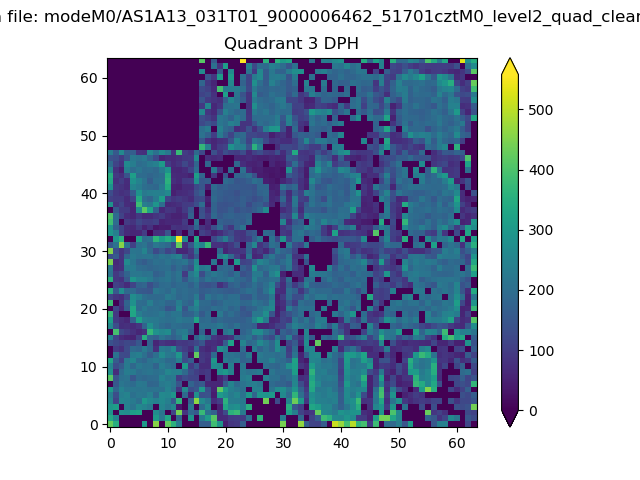 |
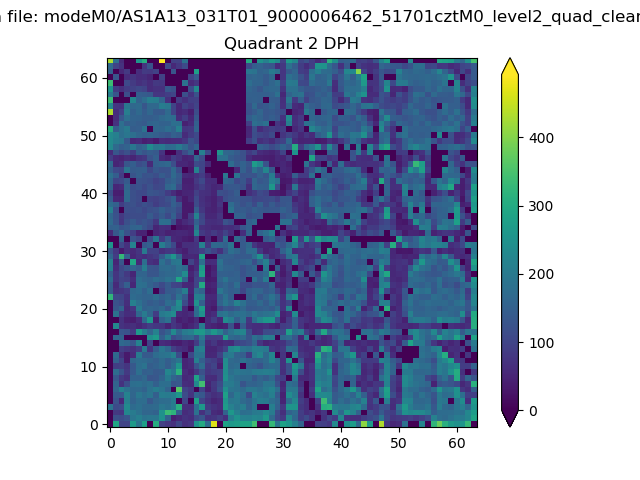 |
Quadrant C |
| Plot type | Count rate plots | Images |
|---|---|---|
| Comparison with Poisson distribution Blue bars denote a histogram of data divided into 1 sec bins. Red curve is a Poisson curve with rate = median count rate of data. |
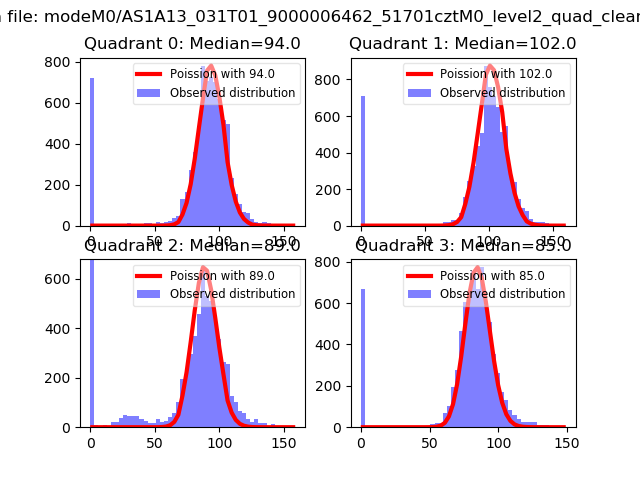 |
 |
| Quadrant-wise count rates Data is divided into 100 sec bins |
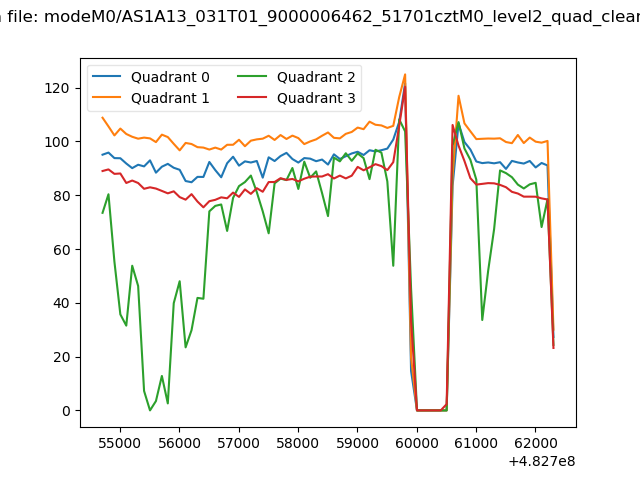 |
|
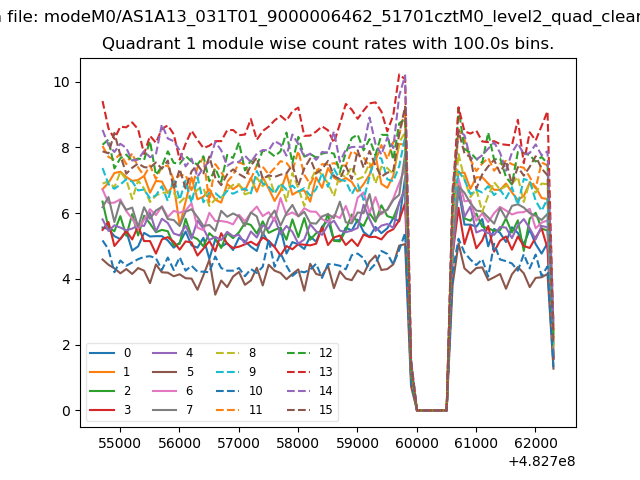
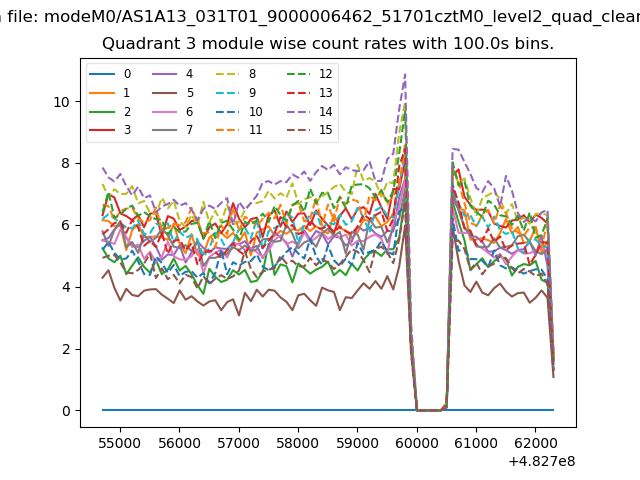
| Module-wise count rates for Quadrant A Data is divided into 100 sec bins |
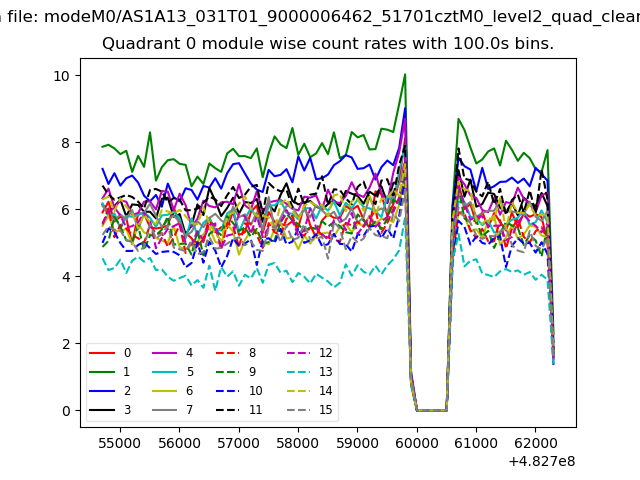 |
 |
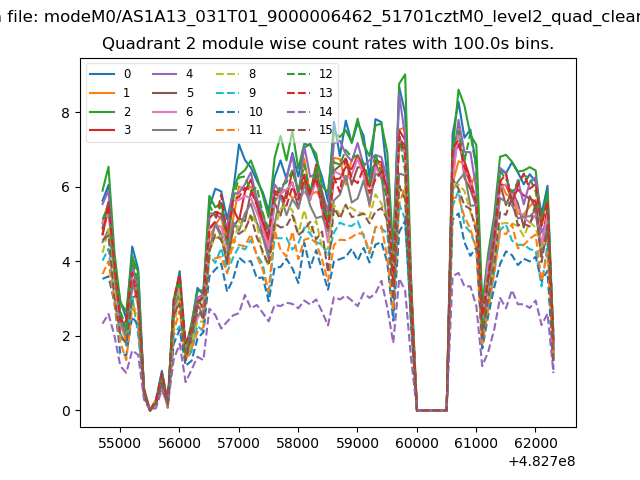
| Module-wise count rates for Quadrant B Data is divided into 100 sec bins |
 |
 |
| Module-wise count rates for Quadrant C Data is divided into 100 sec bins |
 |
 |
| Module-wise count rates for Quadrant D Data is divided into 100 sec bins |
 |
 |
| Parameter | Plot |
|---|---|
| CZT HV Monitor |  |
| D_VDD | 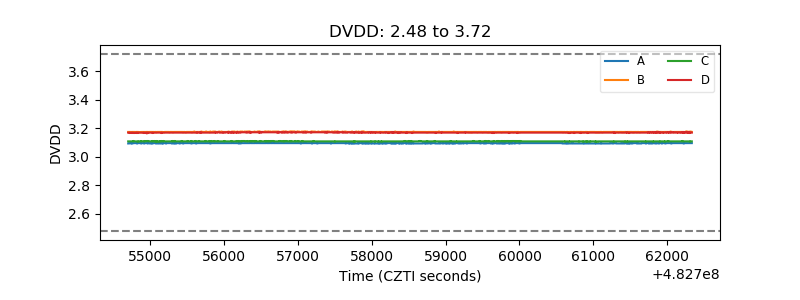 |
| Temperature 1 | 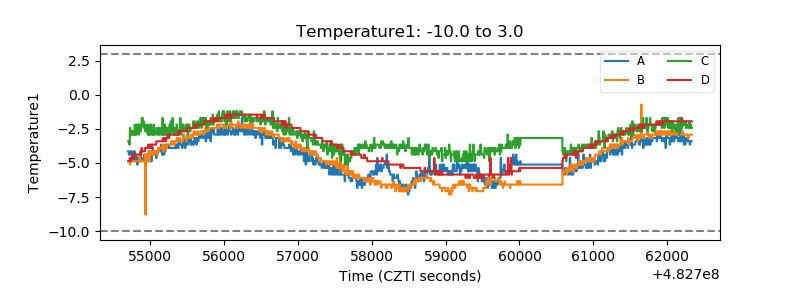 |
| Veto HV Monitor | 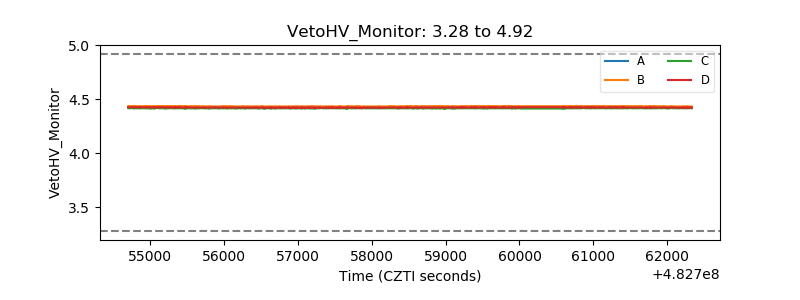 |
| Veto LLD | 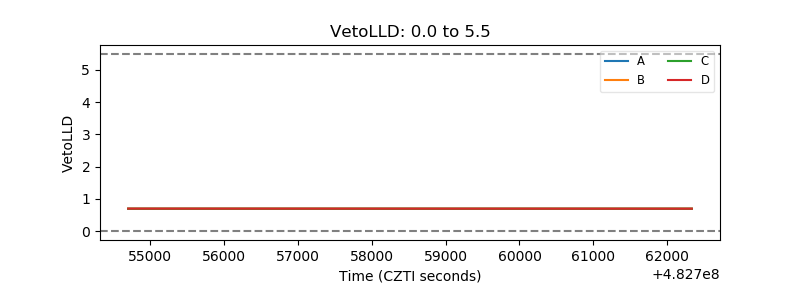 |
| Alpha Counter | 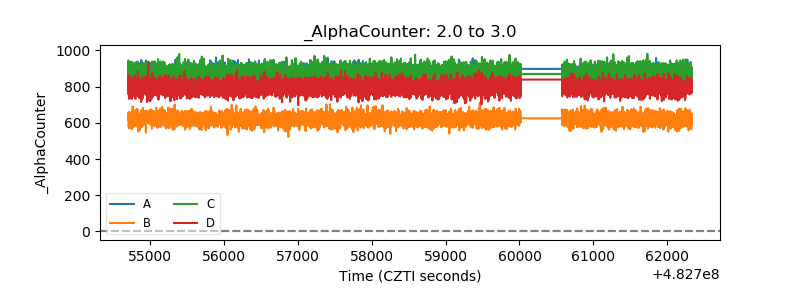 |
| _CPM_Rate | 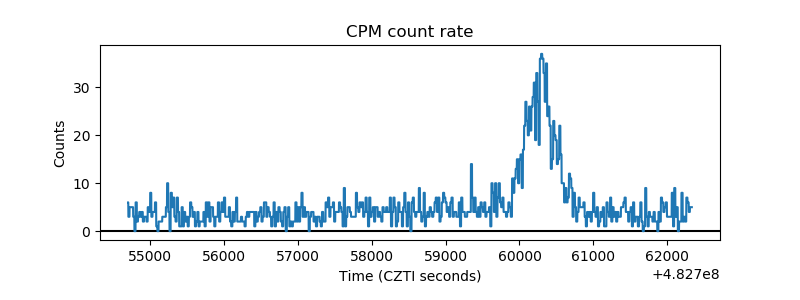 |
| CZT Counter | 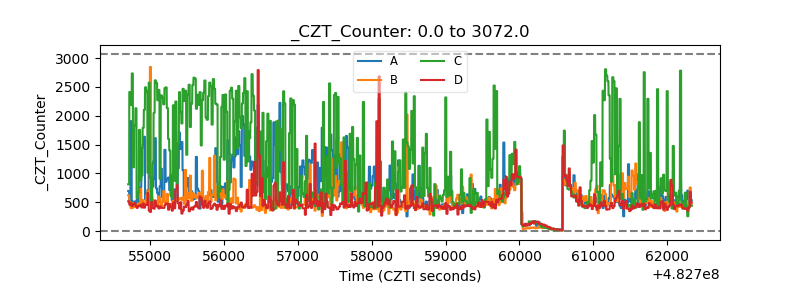 |
| +2.5 Volts monitor | 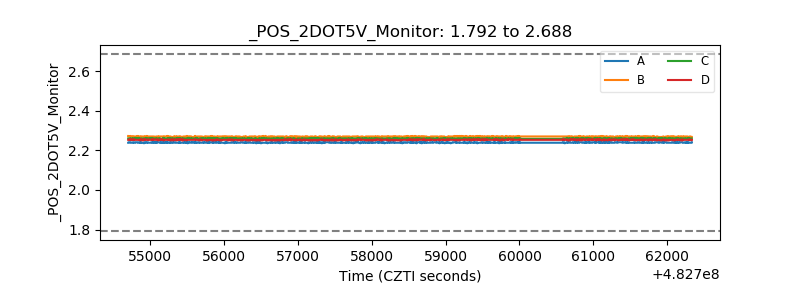 |
| +5 Volts monitor | 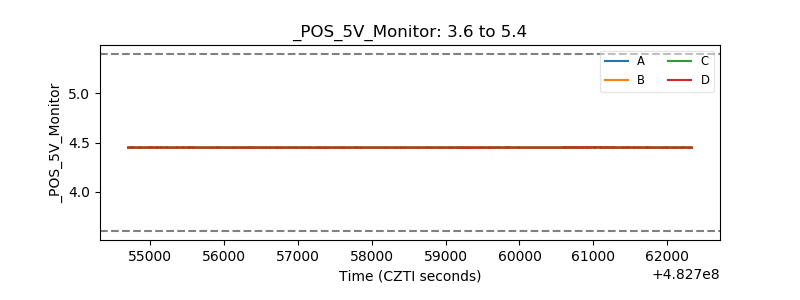 |
| _ROLL_ROT | 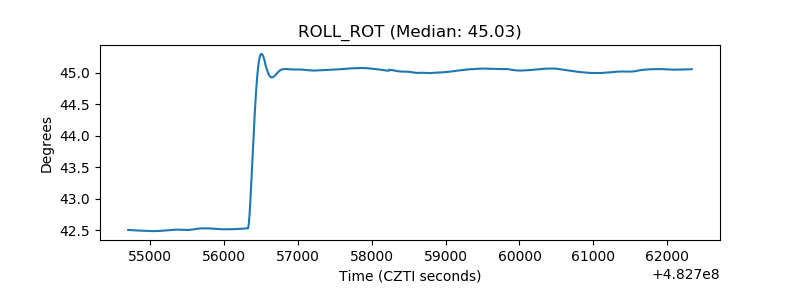 |
| _Roll_DEC | 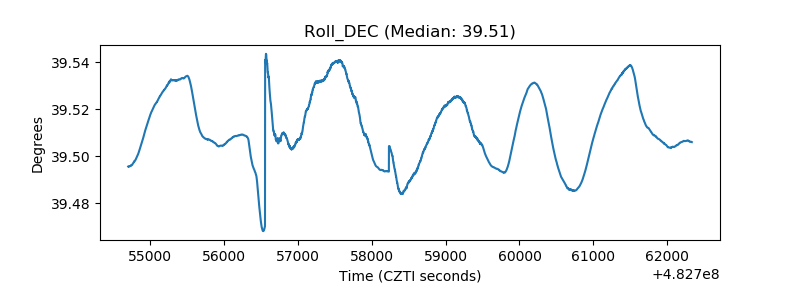 |
| _Roll_RA | 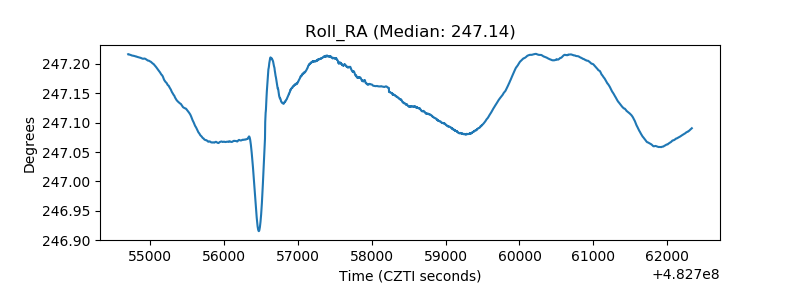 |
| Veto Counter | 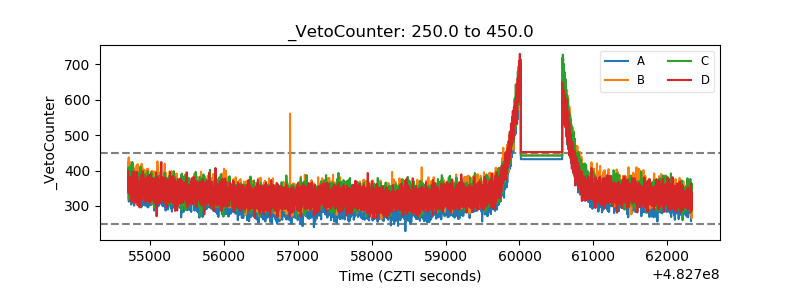 |