| Param | Original file | Final file |
|---|---|---|
| Filename | modeM0/AS1A13_031T01_9000006462_51702cztM0_level2.fits | modeM0/AS1A13_031T01_9000006462_51702cztM0_level2_quad_clean.evt |
| Size (bytes) | 591,163,200 | 112,285,440 |
| Size | 563.8 MB | 107.1 MB |
| Events in quadrant A | 5,464,210 | 733,273 |
| Events in quadrant B | 4,511,175 | 795,019 |
| Events in quadrant C | 7,073,426 | 636,889 |
| Events in quadrant D | 4,210,758 | 676,551 |
| Mode M9 | |||
|---|---|---|---|
| Quadrant | BADHDUFLAG | Total packets | Discarded packets |
| A | 0 | 6 | 0 |
| B | 0 | 6 | 0 |
| C | 0 | 6 | 0 |
| D | 0 | 6 | 0 |
| Mode M0 | |||
|---|---|---|---|
| Quadrant | BADHDUFLAG | Total packets | Discarded packets |
| A | 0 | 21494 | 1 |
| B | 0 | 18957 | 1 |
| C | 0 | 26632 | 2 |
| D | 0 | 18254 | 1 |
| Mode SS | |||
|---|---|---|---|
| Quadrant | BADHDUFLAG | Total packets | Discarded packets |
| A | 0 | 162 | 0 |
| B | 0 | 162 | 0 |
| C | 0 | 162 | 0 |
| D | 0 | 162 | 0 |
| Quadrant | Total seconds | Saturated seconds | Saturation percentage |
|---|---|---|---|
| A | 8029 | 373 | 4.645659% |
| B | 8030 | 405 | 5.043587% |
| C | 8029 | 1160 | 14.447627% |
| D | 8029 | 188 | 2.341512% |
Noise dominated data is calculated using 1-second bins in cleaned event files. If a bin has >2000 counts, and if more than 50% of those come from <1% of pixels, then it is considered to be noise-dominated and hence unusable.
| Quadrant | # 1 sec bins | Bins with >0 counts | Bins with >2000 counts | High rate bins dominated by noise | Noise dominated (total time) | Noise dominated (detector-on time) | Marked lightcurve |
|---|---|---|---|---|---|---|---|
| A | 8589 | 8030 | 50 | 50 | 0.58% | 0.62% | 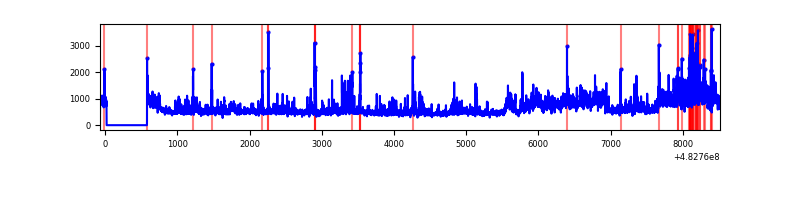 |
| B | 8590 | 8031 | 57 | 57 | 0.66% | 0.71% | 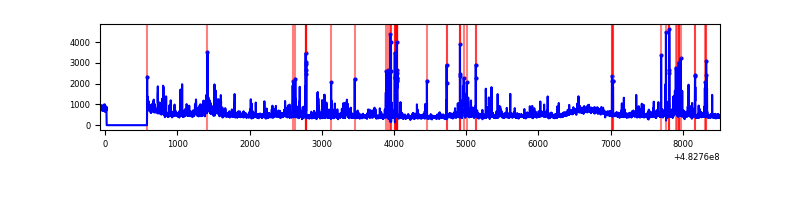 |
| C | 8589 | 8030 | 806 | 806 | 9.38% | 10.04% | 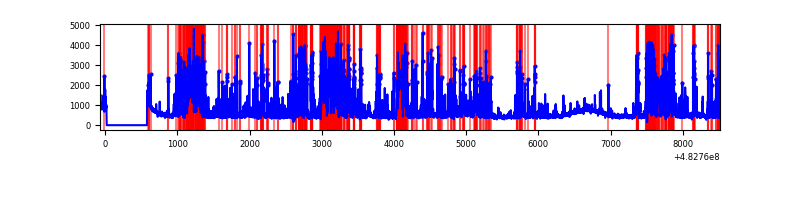 |
| D | 8589 | 8030 | 39 | 39 | 0.45% | 0.49% | 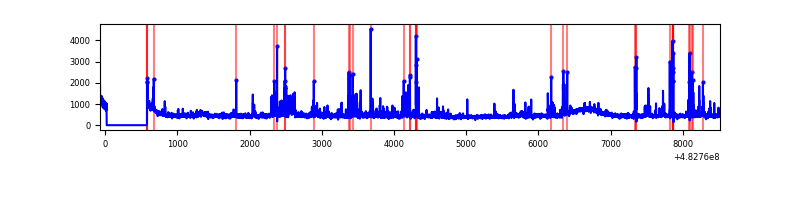 |
Top three noisy pixels from each quadrant. If the there are fewer than three noisy pixels in the level2.evt file, extra rows are filled as -1
| Pixel properties | Quadrant properties | ||||||
|---|---|---|---|---|---|---|---|
| Quadrant | DetID | PixID | Counts | Sigma | Mean | Median | Sigma |
| A | 12 | 3 | 632464 | 2917.22 | 898 | 876 | 216.5 |
| A | 9 | 191 | 308663 | 1421.63 | 898 | 876 | 216.5 |
| A | 3 | 14 | 304491 | 1402.36 | 898 | 876 | 216.5 |
| B | 10 | 254 | 188241 | 982.61 | 889 | 855 | 190.7 |
| B | 0 | 213 | 158910 | 828.8 | 889 | 855 | 190.7 |
| B | 7 | 252 | 103625 | 538.9 | 889 | 855 | 190.7 |
| C | 12 | 254 | 2204001 | 9877.45 | 828 | 818 | 223.1 |
| C | 15 | 189 | 449339 | 2010.84 | 828 | 818 | 223.1 |
| C | 15 | 231 | 440153 | 1969.65 | 828 | 818 | 223.1 |
| D | 2 | 249 | 135558 | 559.32 | 877 | 844 | 240.9 |
| D | 8 | 176 | 134695 | 555.73 | 877 | 844 | 240.9 |
| D | 3 | 12 | 111741 | 460.43 | 877 | 844 | 240.9 |
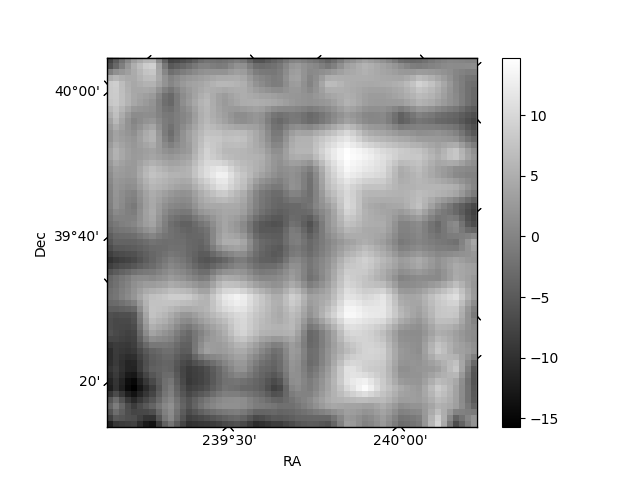
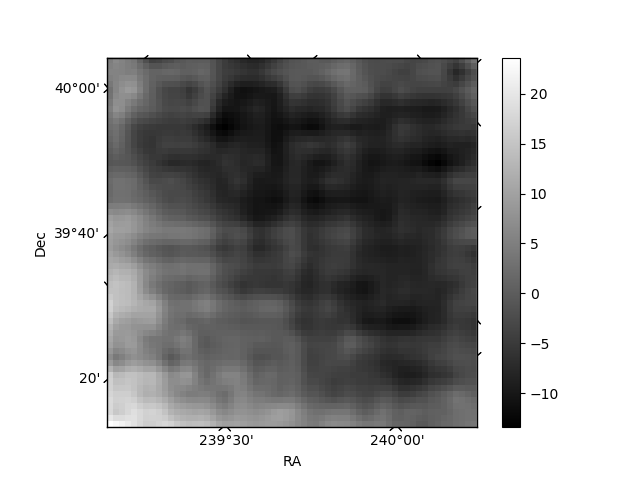
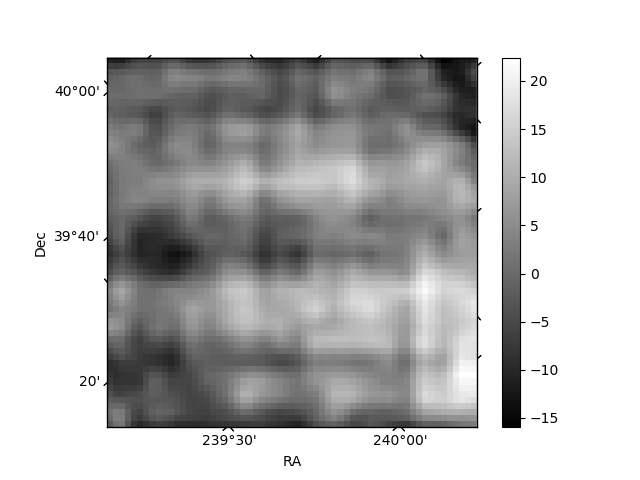
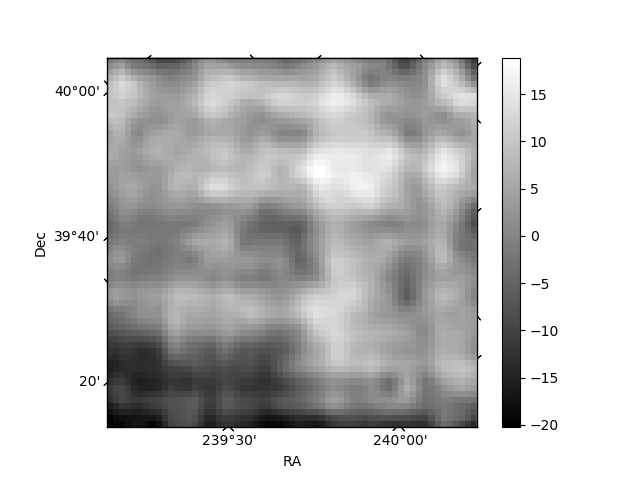
Histogram calculated using DETX and DETY for each event in the final _common_clean file
| Quadrant A | 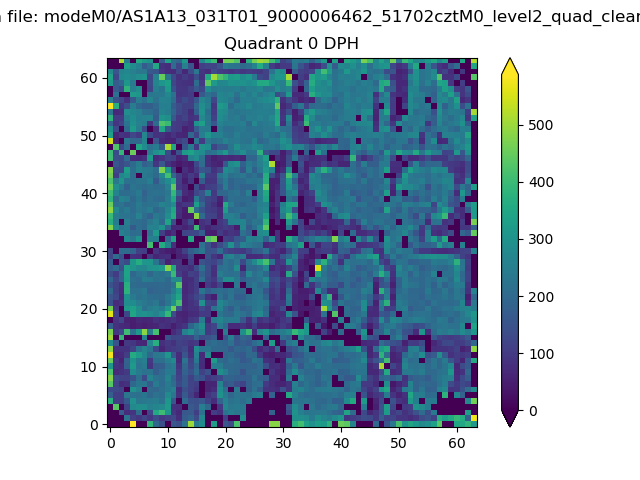 |
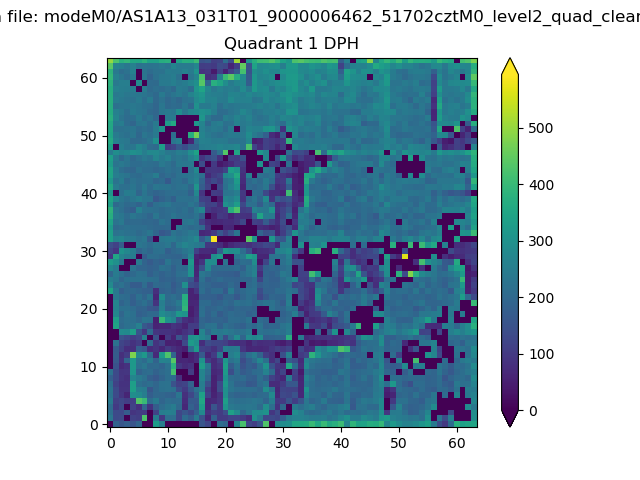 |
Quadrant B |
|---|---|---|---|
| Quadrant D | 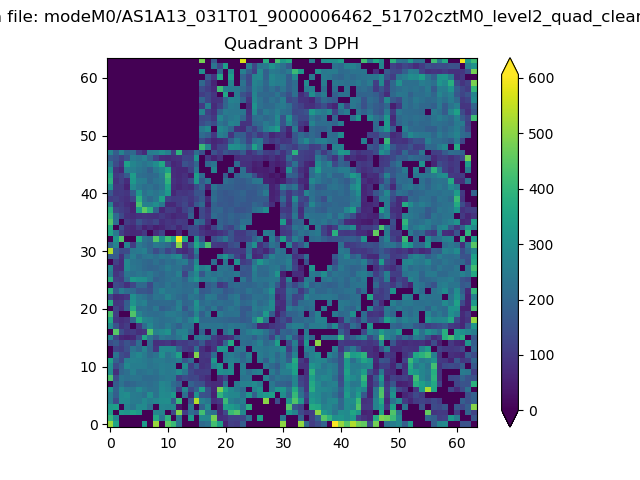 |
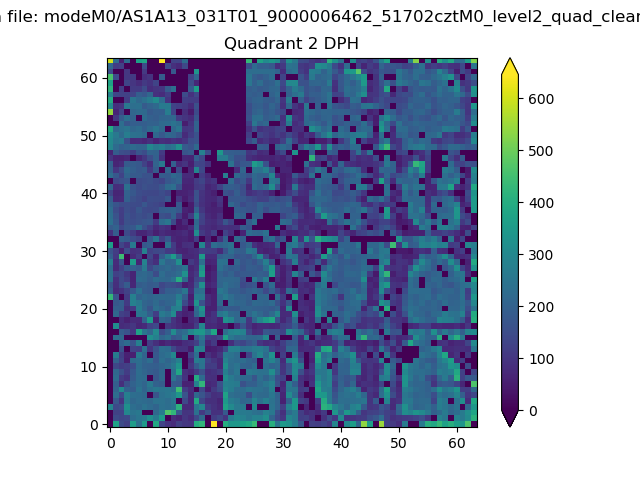 |
Quadrant C |
| Plot type | Count rate plots | Images |
|---|---|---|
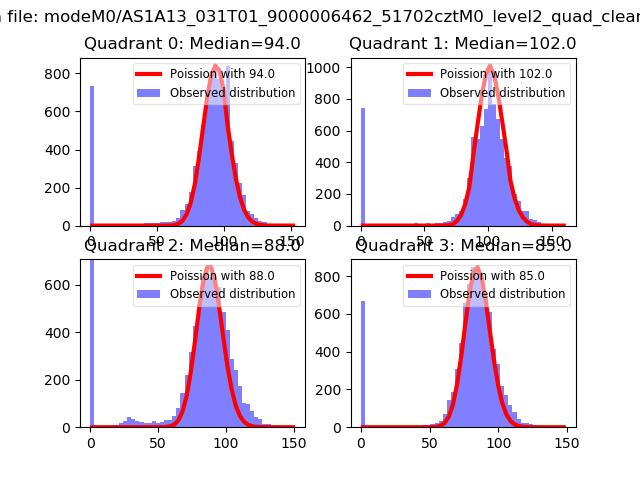
| Comparison with Poisson distribution Blue bars denote a histogram of data divided into 1 sec bins. Red curve is a Poisson curve with rate = median count rate of data. |
 |
 |
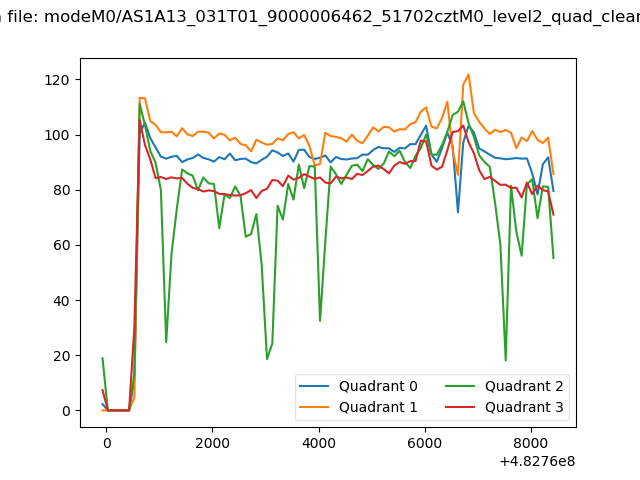
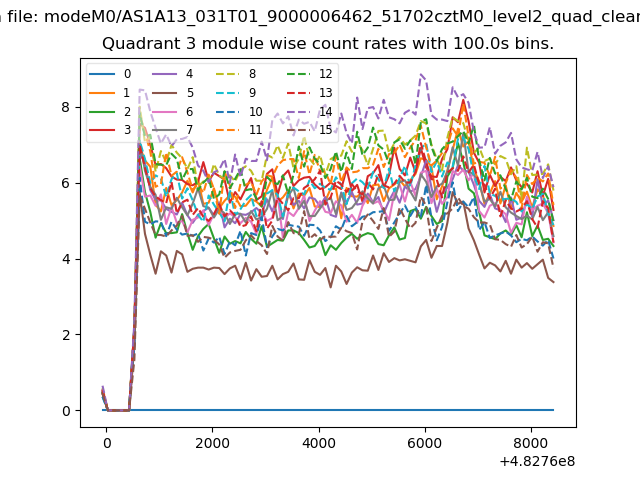
| Quadrant-wise count rates Data is divided into 100 sec bins |
 |
|
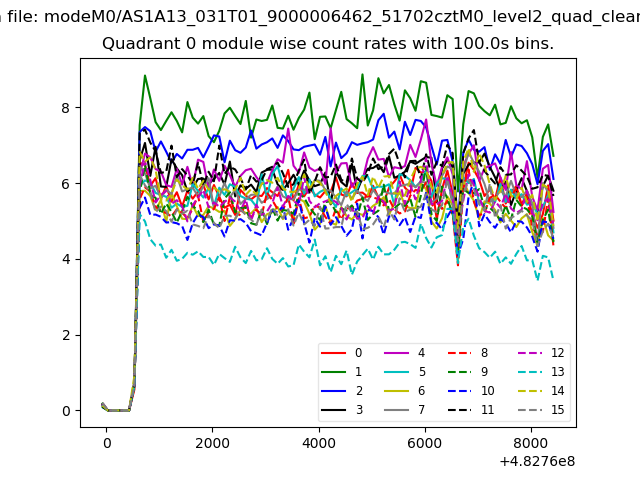
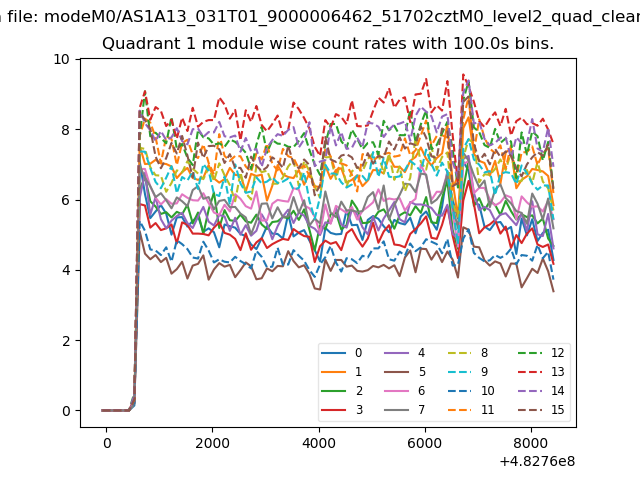
| Module-wise count rates for Quadrant A Data is divided into 100 sec bins |
 |
 |
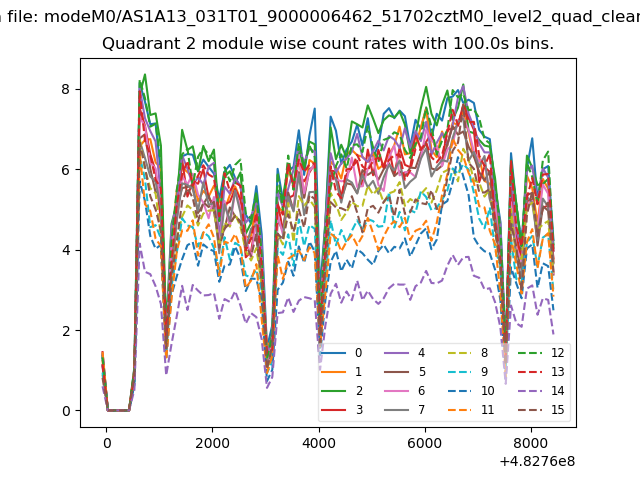
| Module-wise count rates for Quadrant B Data is divided into 100 sec bins |
 |
 |
| Module-wise count rates for Quadrant C Data is divided into 100 sec bins |
 |
 |
| Module-wise count rates for Quadrant D Data is divided into 100 sec bins |
 |
 |
| Parameter | Plot |
|---|---|
| CZT HV Monitor | 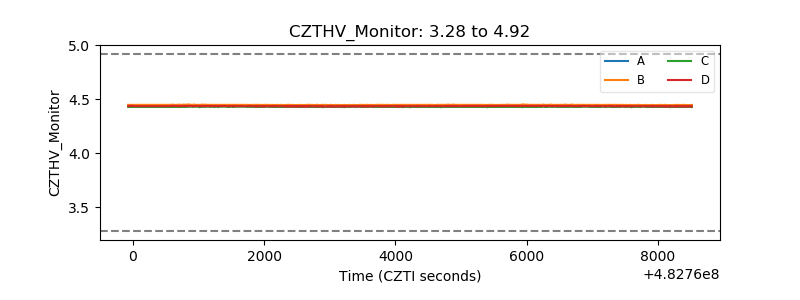 |
| D_VDD |  |
| Temperature 1 | 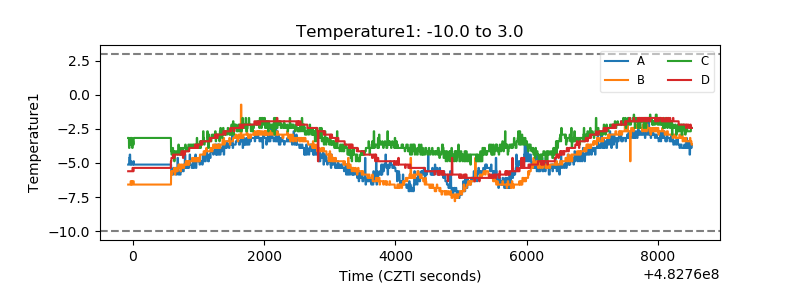 |
| Veto HV Monitor | 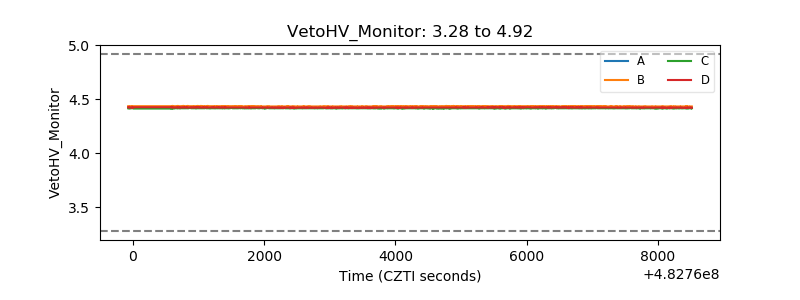 |
| Veto LLD | 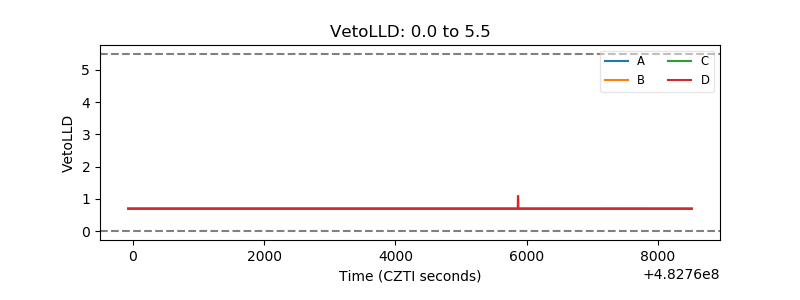 |
| Alpha Counter | 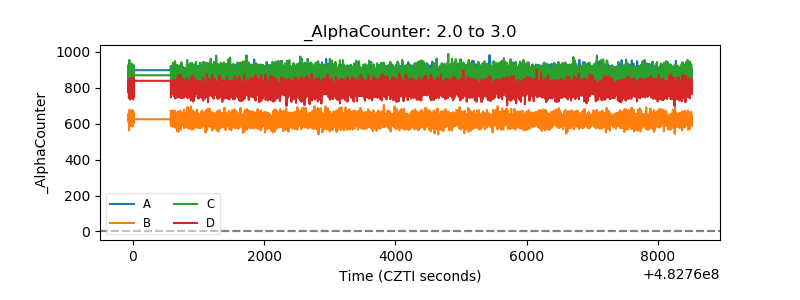 |
| _CPM_Rate | 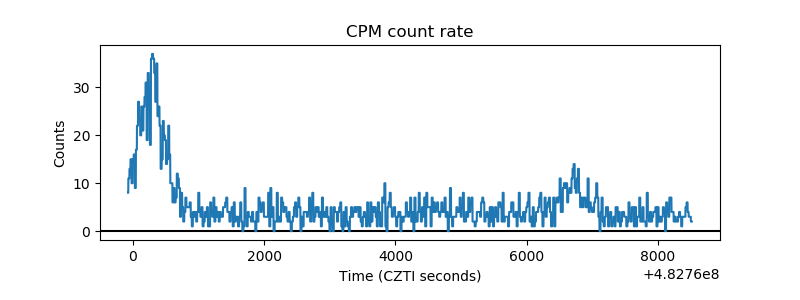 |
| CZT Counter | 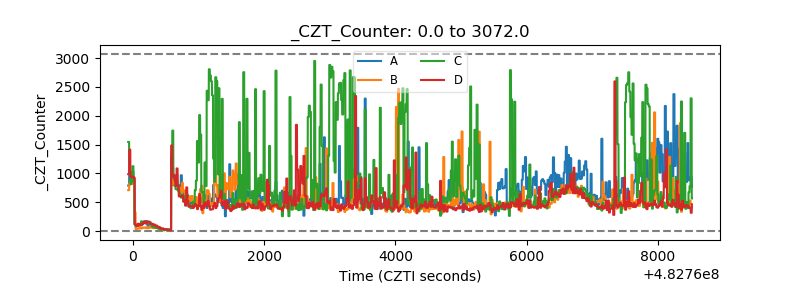 |
| +2.5 Volts monitor | 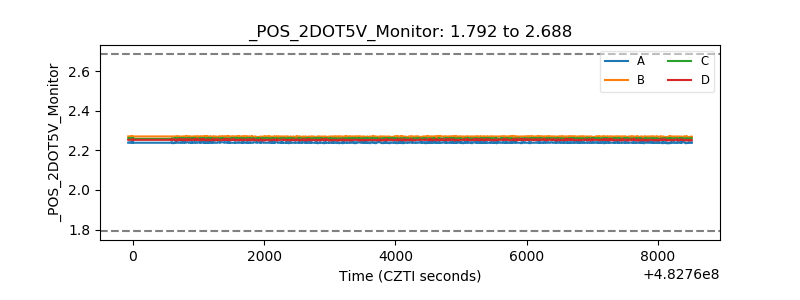 |
| +5 Volts monitor | 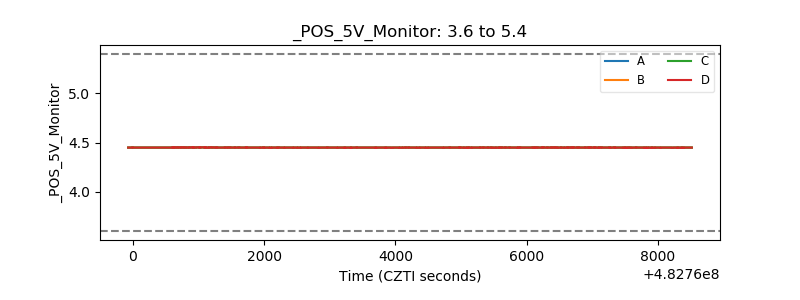 |
| _ROLL_ROT | 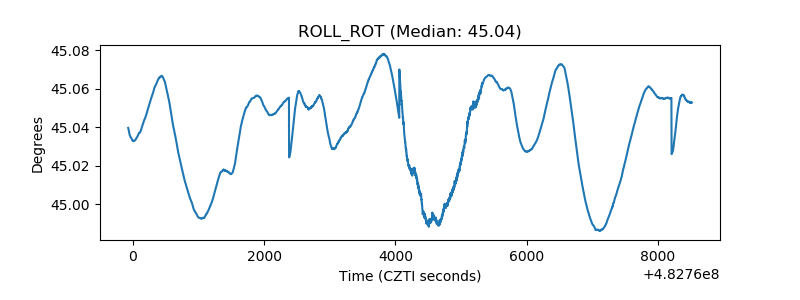 |
| _Roll_DEC | 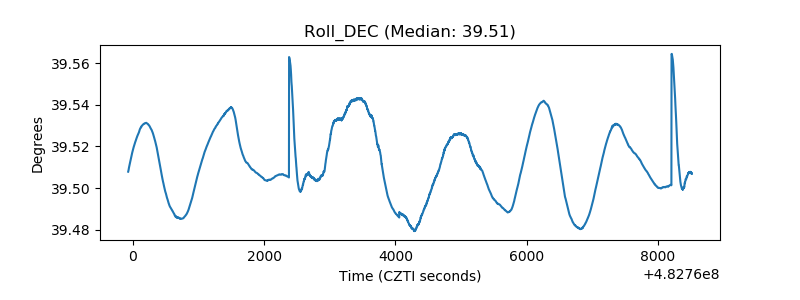 |
| _Roll_RA | 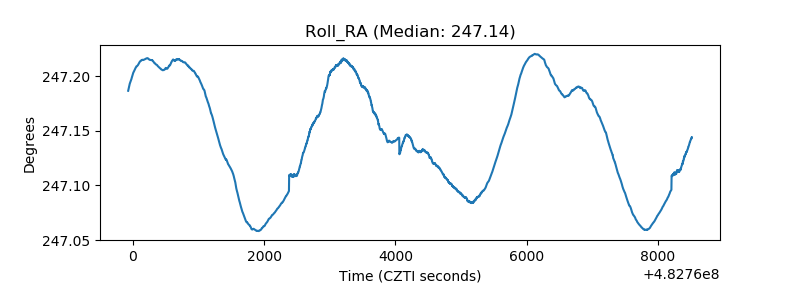 |
| Veto Counter | 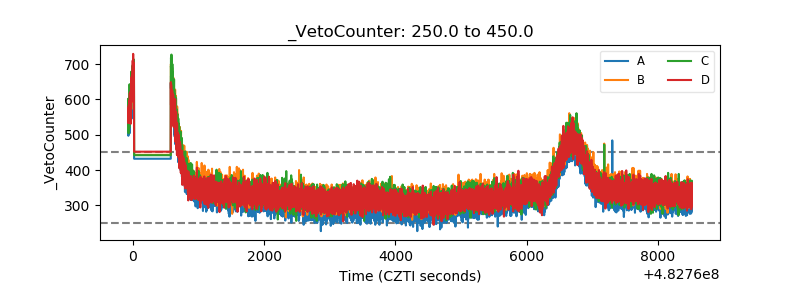 |