| Param | Original file | Final file |
|---|---|---|
| Filename | modeM0/AS1A13_031T01_9000006462_51707cztM0_level2.fits | modeM0/AS1A13_031T01_9000006462_51707cztM0_level2_quad_clean.evt |
| Size (bytes) | 1,515,588,480 | 268,513,920 |
| Size | 1.4 GB | 256.1 MB |
| Events in quadrant A | 13,252,698 | 1,784,575 |
| Events in quadrant B | 15,134,144 | 1,777,257 |
| Events in quadrant C | 14,288,234 | 1,634,931 |
| Events in quadrant D | 11,928,877 | 1,596,526 |
| Mode M9 | |||
|---|---|---|---|
| Quadrant | BADHDUFLAG | Total packets | Discarded packets |
| A | 0 | 12 | 0 |
| B | 0 | 12 | 0 |
| C | 0 | 12 | 0 |
| D | 0 | 12 | 0 |
| Mode M0 | |||
|---|---|---|---|
| Quadrant | BADHDUFLAG | Total packets | Discarded packets |
| A | 0 | 52745 | 3 |
| B | 0 | 58531 | 3 |
| C | 0 | 56015 | 3 |
| D | 0 | 49556 | 3 |
| Mode SS | |||
|---|---|---|---|
| Quadrant | BADHDUFLAG | Total packets | Discarded packets |
| A | 0 | 392 | 0 |
| B | 0 | 392 | 0 |
| C | 0 | 392 | 0 |
| D | 0 | 392 | 0 |
| Quadrant | Total seconds | Saturated seconds | Saturation percentage |
|---|---|---|---|
| A | 19394 | 457 | 2.356399% |
| B | 19393 | 1793 | 9.245604% |
| C | 19394 | 1425 | 7.347633% |
| D | 19394 | 590 | 3.042178% |
Noise dominated data is calculated using 1-second bins in cleaned event files. If a bin has >2000 counts, and if more than 50% of those come from <1% of pixels, then it is considered to be noise-dominated and hence unusable.
| Quadrant | # 1 sec bins | Bins with >0 counts | Bins with >2000 counts | High rate bins dominated by noise | Noise dominated (total time) | Noise dominated (detector-on time) | Marked lightcurve |
|---|---|---|---|---|---|---|---|
| A | 20554 | 19397 | 215 | 215 | 1.05% | 1.11% | 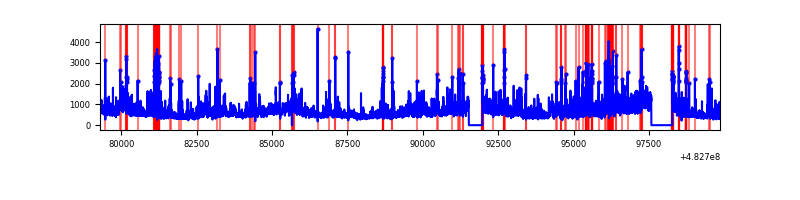 |
| B | 20553 | 19396 | 1037 | 1037 | 5.05% | 5.35% | 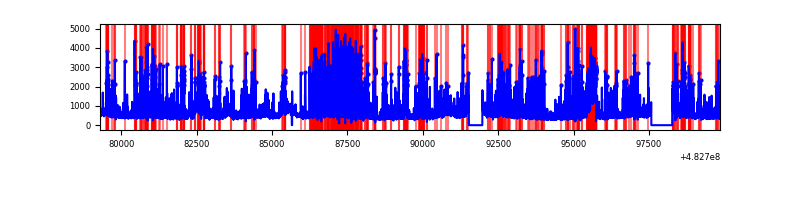 |
| C | 20554 | 19396 | 1078 | 1078 | 5.24% | 5.56% | 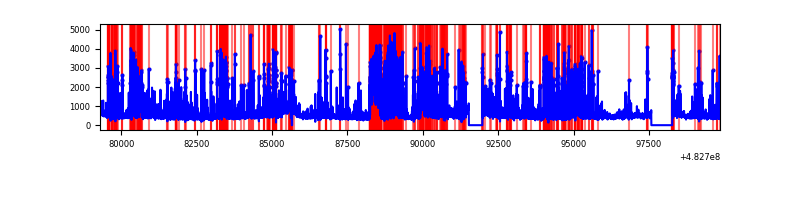 |
| D | 20554 | 19397 | 434 | 434 | 2.11% | 2.24% | 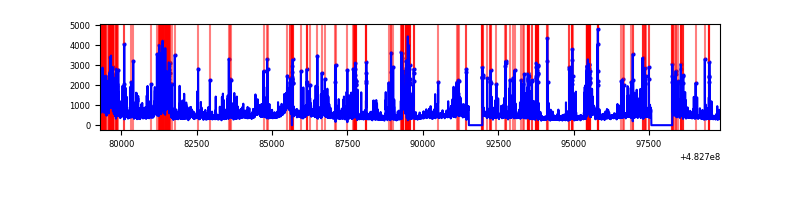 |
Top three noisy pixels from each quadrant. If the there are fewer than three noisy pixels in the level2.evt file, extra rows are filled as -1
| Pixel properties | Quadrant properties | ||||||
|---|---|---|---|---|---|---|---|
| Quadrant | DetID | PixID | Counts | Sigma | Mean | Median | Sigma |
| A | 12 | 3 | 1280876 | 2519.17 | 2065 | 2017 | 507.7 |
| A | 9 | 191 | 1068785 | 2101.38 | 2065 | 2017 | 507.7 |
| A | 3 | 14 | 1066419 | 2096.72 | 2065 | 2017 | 507.7 |
| B | 8 | 128 | 2871220 | 6742.85 | 2004 | 1935 | 425.5 |
| B | 1 | 223 | 1568859 | 3682.29 | 2004 | 1935 | 425.5 |
| B | 12 | 32 | 1161229 | 2724.35 | 2004 | 1935 | 425.5 |
| C | 15 | 147 | 1548969 | 2866.3 | 1992 | 1974 | 539.7 |
| C | 13 | 3 | 1228073 | 2271.74 | 1992 | 1974 | 539.7 |
| C | 12 | 254 | 860923 | 1591.47 | 1992 | 1974 | 539.7 |
| D | 3 | 12 | 1233087 | 2190.54 | 2005 | 1936 | 562.0 |
| D | 7 | 60 | 1020756 | 1812.75 | 2005 | 1936 | 562.0 |
| D | 15 | 98 | 349158 | 617.8 | 2005 | 1936 | 562.0 |
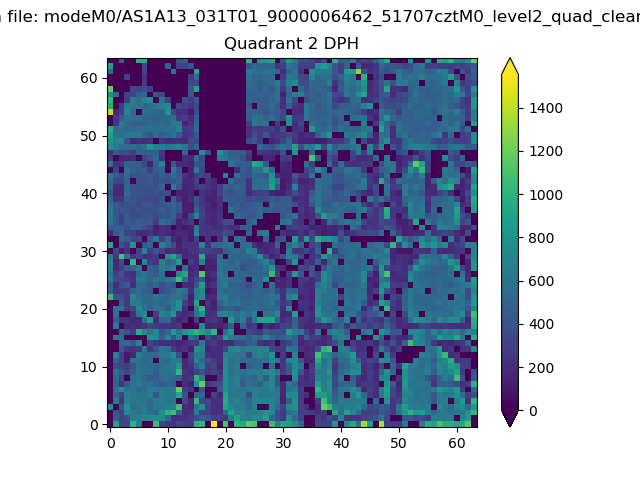
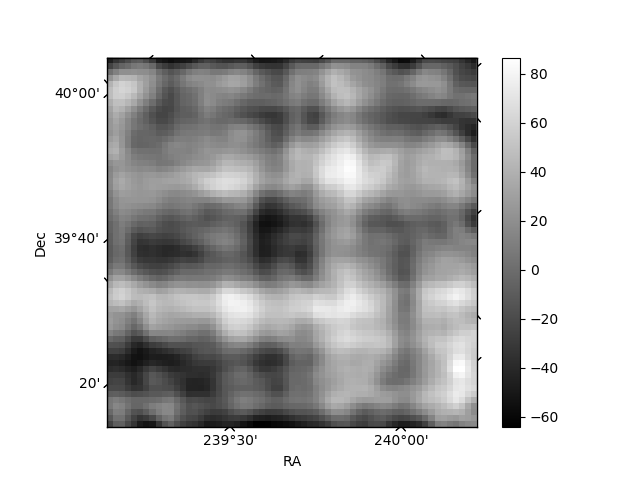
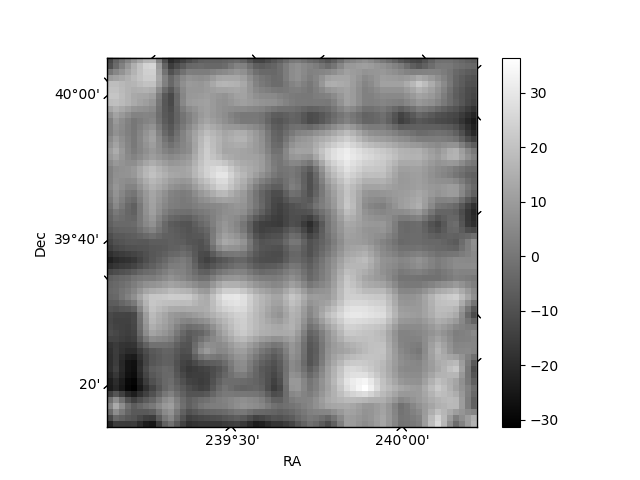
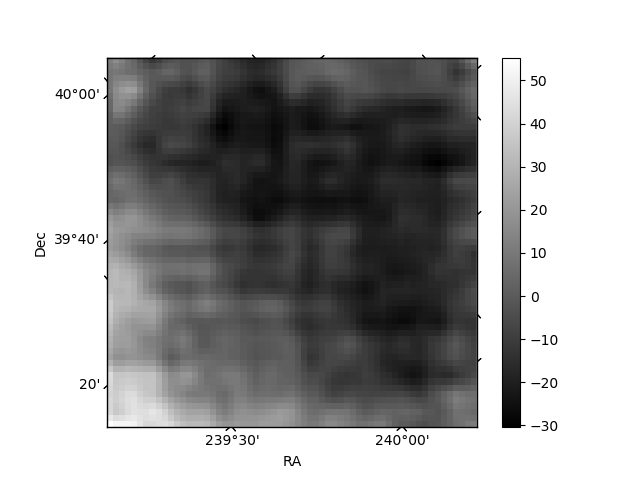
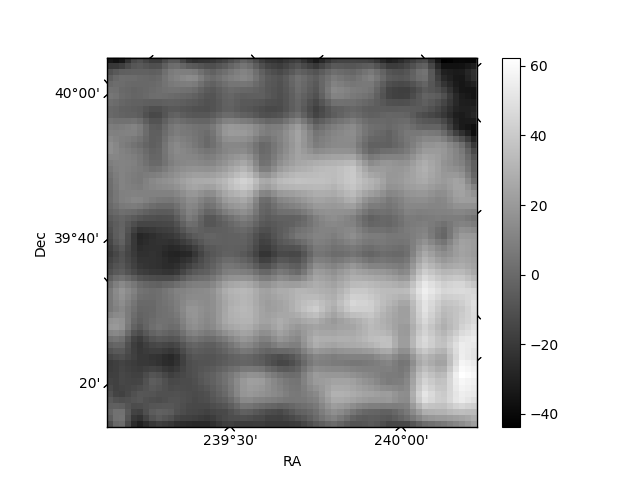
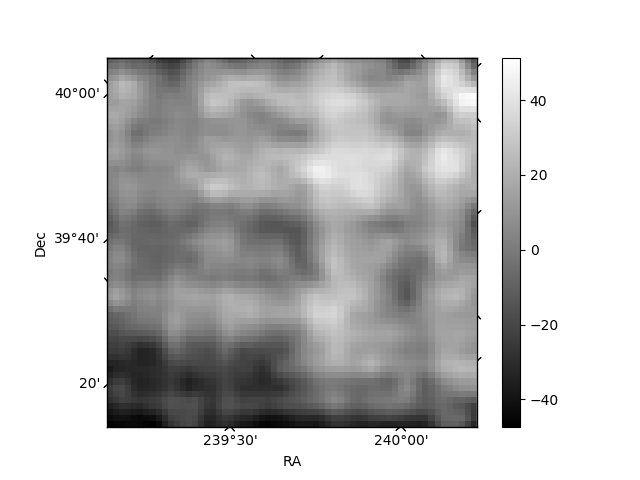
Histogram calculated using DETX and DETY for each event in the final _common_clean file
| Quadrant A | 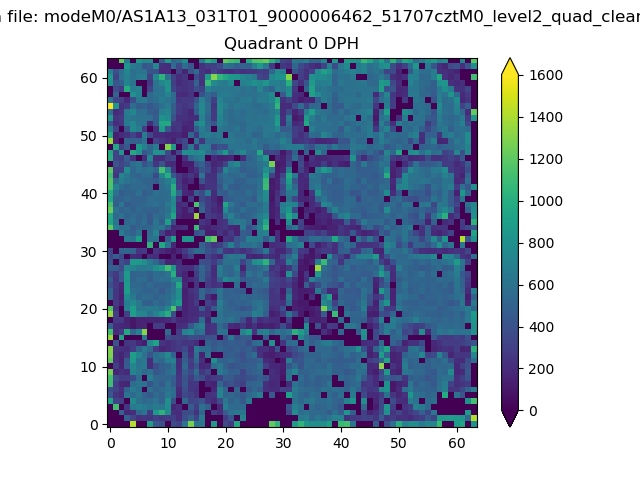 |
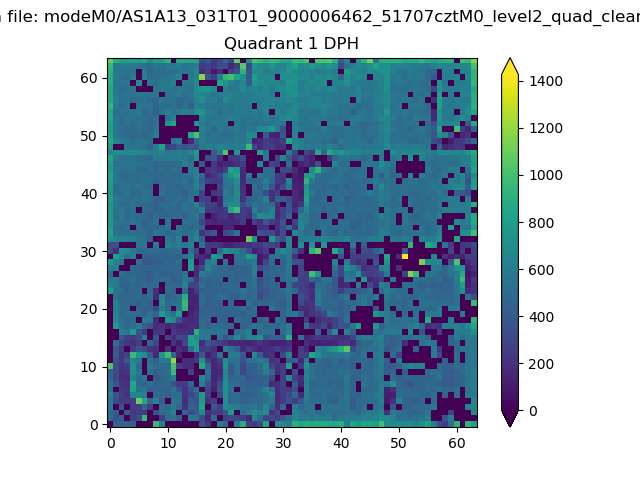 |
Quadrant B |
|---|---|---|---|
| Quadrant D | 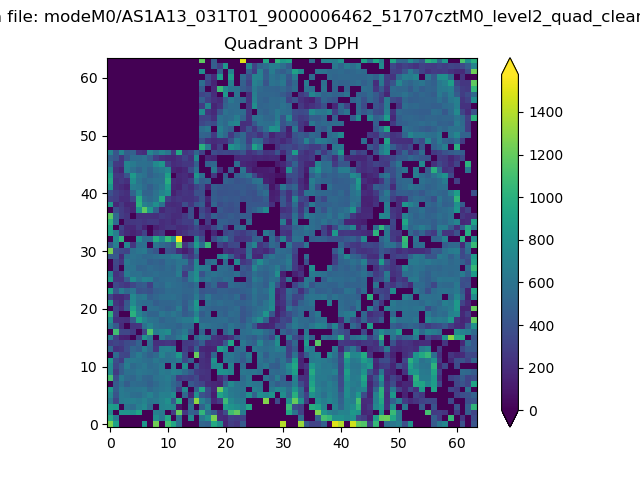 |
 |
Quadrant C |
| Plot type | Count rate plots | Images |
|---|---|---|
| Comparison with Poisson distribution Blue bars denote a histogram of data divided into 1 sec bins. Red curve is a Poisson curve with rate = median count rate of data. |
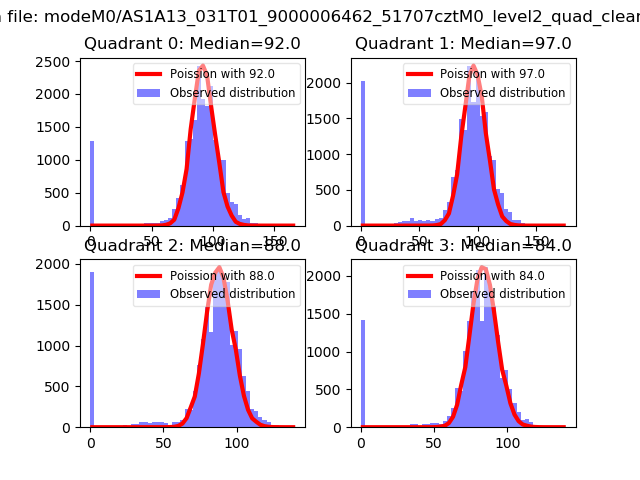 |
 |
| Quadrant-wise count rates Data is divided into 100 sec bins |
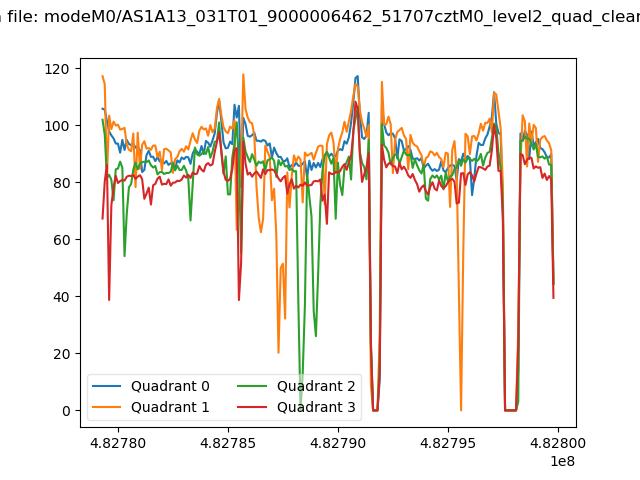 |
|
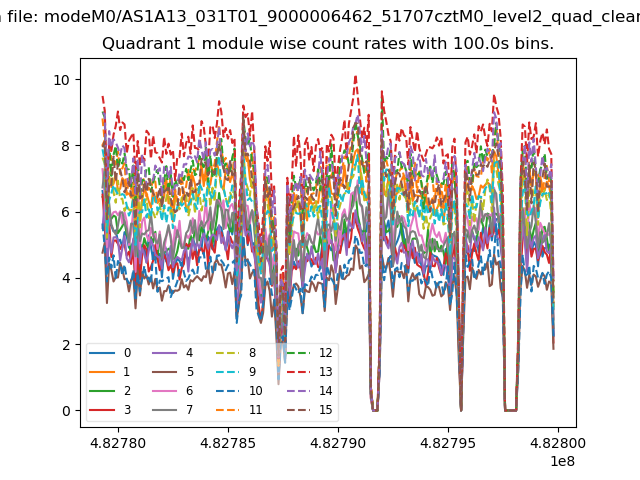
| Module-wise count rates for Quadrant A Data is divided into 100 sec bins |
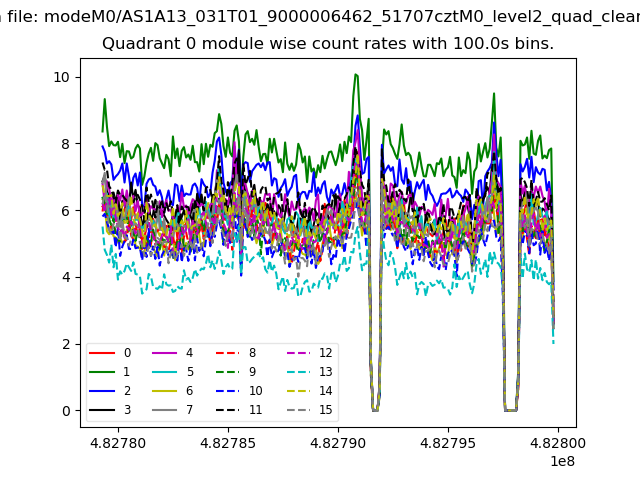 |
 |
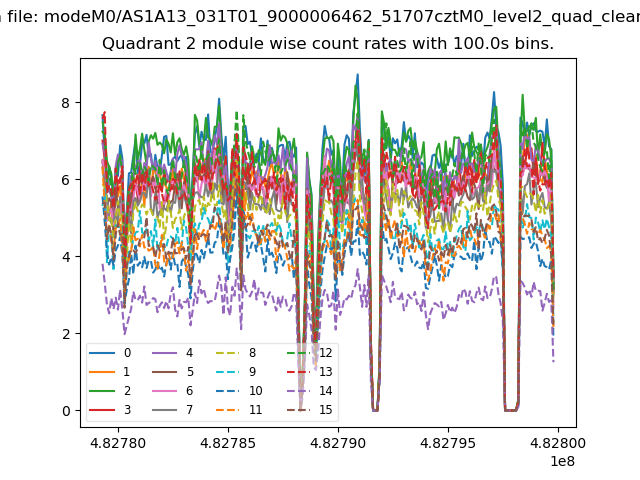
| Module-wise count rates for Quadrant B Data is divided into 100 sec bins |
 |
 |
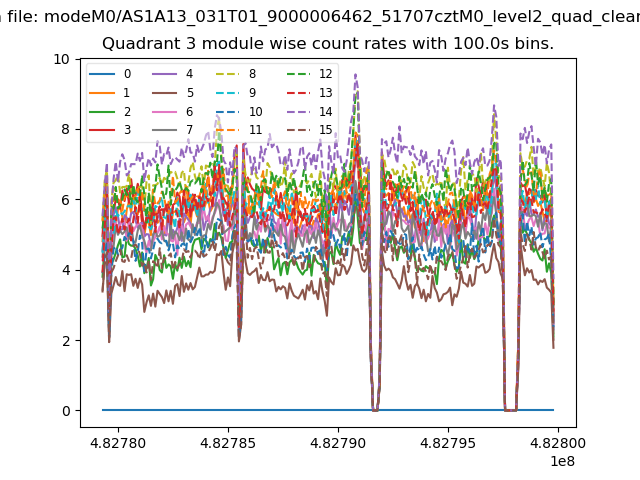
| Module-wise count rates for Quadrant C Data is divided into 100 sec bins |
 |
 |
| Module-wise count rates for Quadrant D Data is divided into 100 sec bins |
 |
 |
| Parameter | Plot |
|---|---|
| CZT HV Monitor | 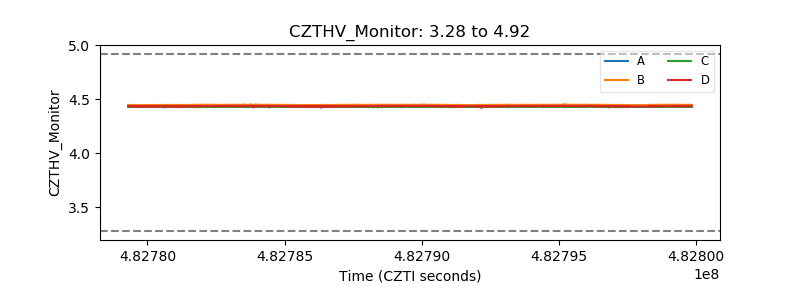 |
| D_VDD | 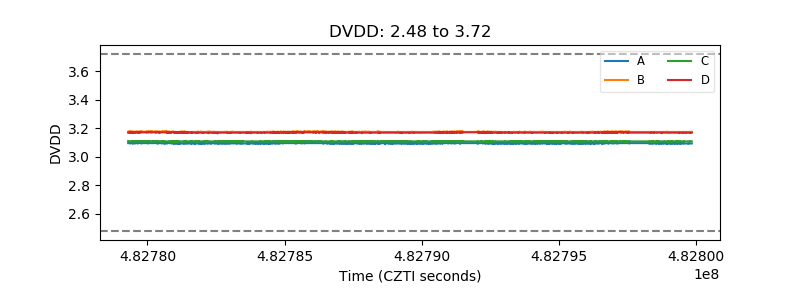 |
| Temperature 1 | 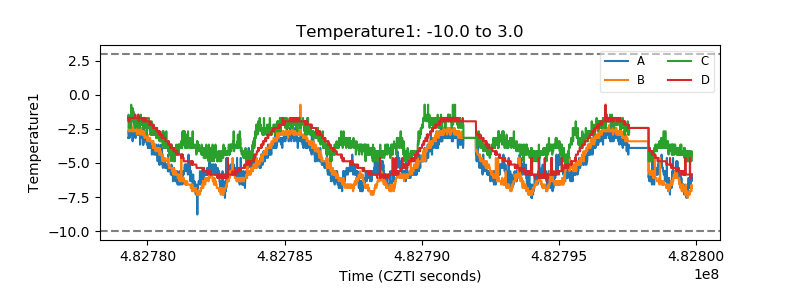 |
| Veto HV Monitor | 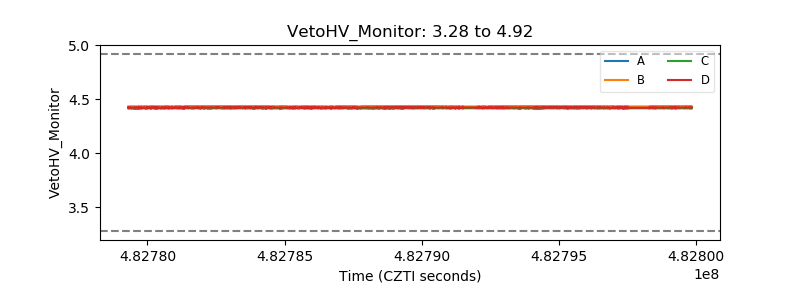 |
| Veto LLD | 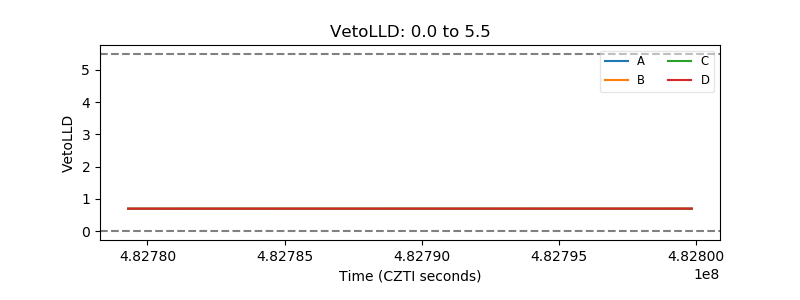 |
| Alpha Counter | 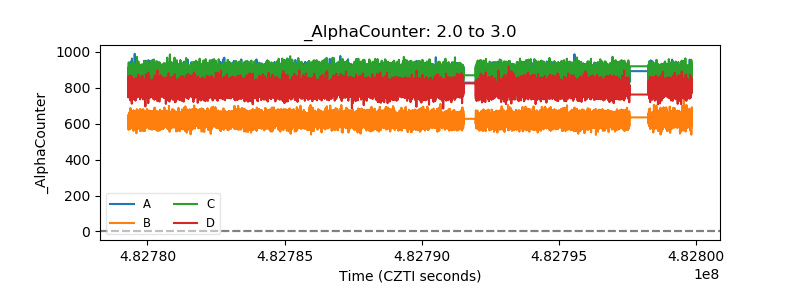 |
| _CPM_Rate | 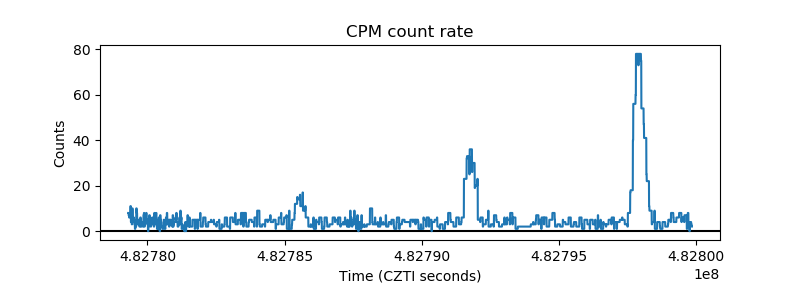 |
| CZT Counter | 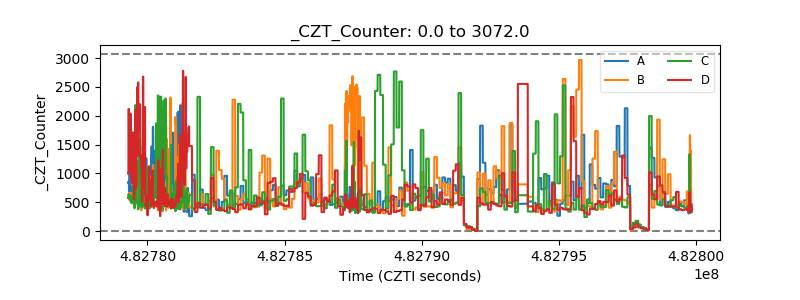 |
| +2.5 Volts monitor | 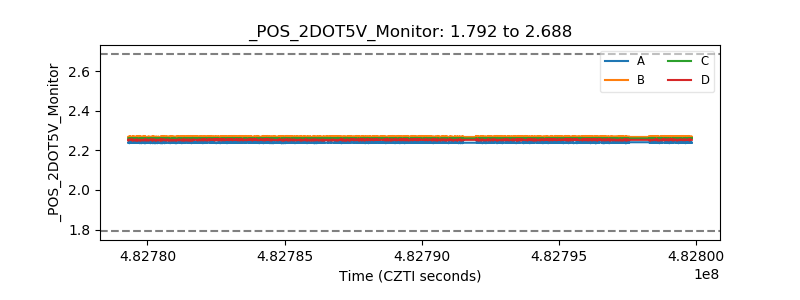 |
| +5 Volts monitor | 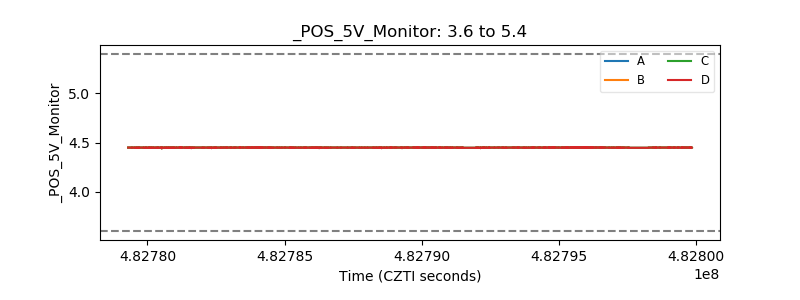 |
| _ROLL_ROT | 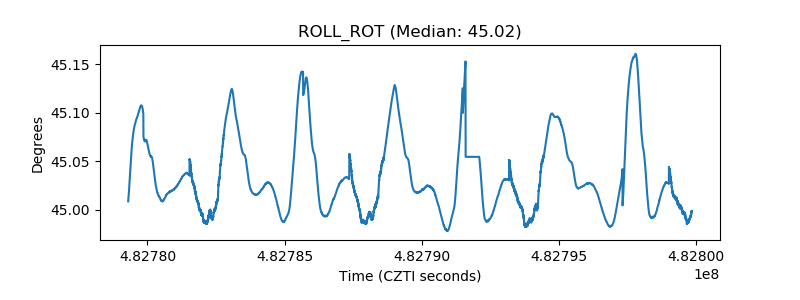 |
| _Roll_DEC | 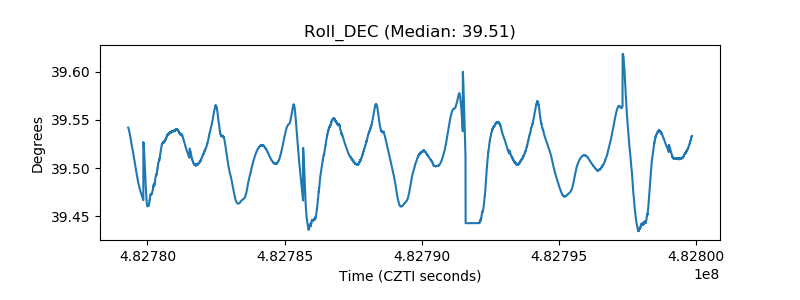 |
| _Roll_RA | 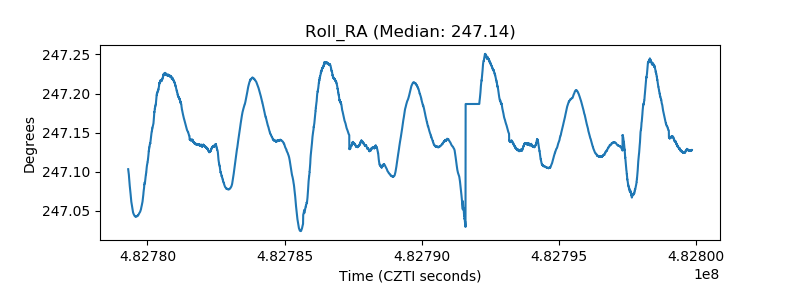 |
| Veto Counter | 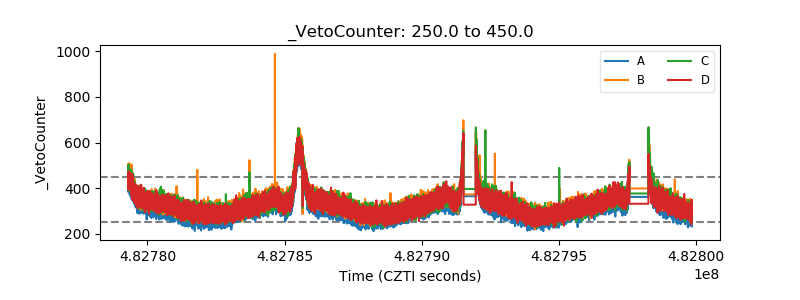 |