| Param | Original file | Final file |
|---|---|---|
| Filename | modeM0/AS1A13_031T01_9000006462_51710cztM0_level2.fits | modeM0/AS1A13_031T01_9000006462_51710cztM0_level2_quad_clean.evt |
| Size (bytes) | 553,970,880 | 113,088,960 |
| Size | 528.3 MB | 107.9 MB |
| Events in quadrant A | 5,931,412 | 723,707 |
| Events in quadrant B | 4,258,006 | 788,909 |
| Events in quadrant C | 5,519,458 | 698,008 |
| Events in quadrant D | 4,196,808 | 675,514 |
| Mode M9 | |||
|---|---|---|---|
| Quadrant | BADHDUFLAG | Total packets | Discarded packets |
| A | 0 | 18 | 0 |
| B | 0 | 18 | 0 |
| C | 0 | 18 | 0 |
| D | 0 | 18 | 0 |
| Mode M0 | |||
|---|---|---|---|
| Quadrant | BADHDUFLAG | Total packets | Discarded packets |
| A | 0 | 22836 | 2 |
| B | 0 | 18044 | 2 |
| C | 0 | 21929 | 2 |
| D | 0 | 17833 | 2 |
| Mode SS | |||
|---|---|---|---|
| Quadrant | BADHDUFLAG | Total packets | Discarded packets |
| A | 0 | 158 | 0 |
| B | 0 | 158 | 0 |
| C | 0 | 158 | 0 |
| D | 0 | 158 | 0 |
| Quadrant | Total seconds | Saturated seconds | Saturation percentage |
|---|---|---|---|
| A | 7737 | 373 | 4.820990% |
| B | 7738 | 202 | 2.610494% |
| C | 7738 | 470 | 6.073921% |
| D | 7738 | 146 | 1.886792% |
Noise dominated data is calculated using 1-second bins in cleaned event files. If a bin has >2000 counts, and if more than 50% of those come from <1% of pixels, then it is considered to be noise-dominated and hence unusable.
| Quadrant | # 1 sec bins | Bins with >0 counts | Bins with >2000 counts | High rate bins dominated by noise | Noise dominated (total time) | Noise dominated (detector-on time) | Marked lightcurve |
|---|---|---|---|---|---|---|---|
| A | 9557 | 7739 | 233 | 233 | 2.44% | 3.01% | 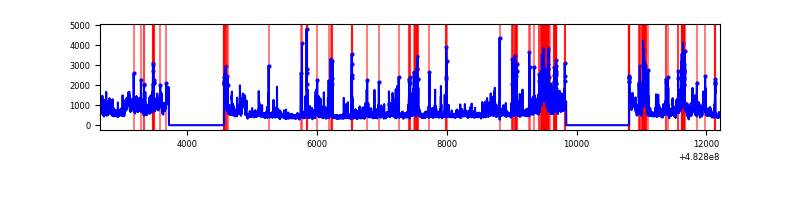 |
| B | 9558 | 7739 | 88 | 88 | 0.92% | 1.14% | 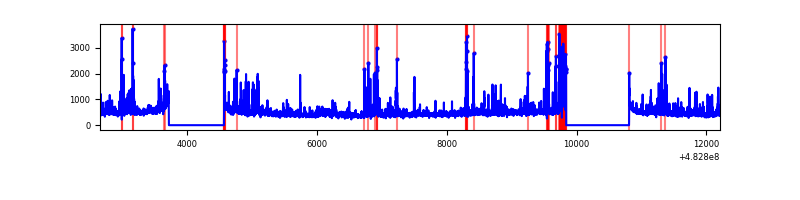 |
| C | 9558 | 7740 | 383 | 383 | 4.01% | 4.95% | 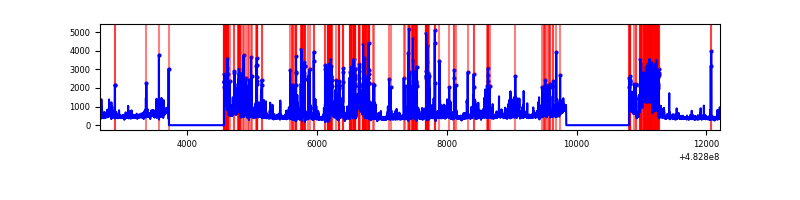 |
| D | 9558 | 7739 | 127 | 127 | 1.33% | 1.64% | 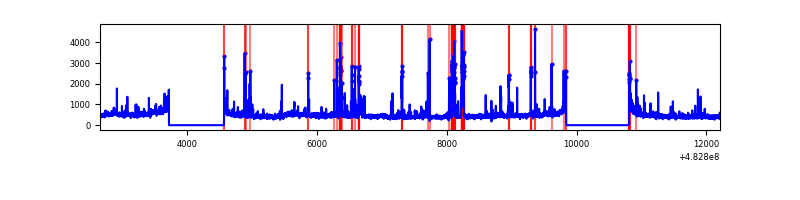 |
Top three noisy pixels from each quadrant. If the there are fewer than three noisy pixels in the level2.evt file, extra rows are filled as -1
| Pixel properties | Quadrant properties | ||||||
|---|---|---|---|---|---|---|---|
| Quadrant | DetID | PixID | Counts | Sigma | Mean | Median | Sigma |
| A | 3 | 78 | 1105937 | 5483.37 | 819 | 801 | 201.5 |
| A | 3 | 14 | 447281 | 2215.31 | 819 | 801 | 201.5 |
| A | 12 | 3 | 375942 | 1861.34 | 819 | 801 | 201.5 |
| B | 8 | 128 | 293872 | 1674.02 | 819 | 792 | 175.1 |
| B | 1 | 223 | 261660 | 1490.03 | 819 | 792 | 175.1 |
| B | 0 | 213 | 84257 | 476.74 | 819 | 792 | 175.1 |
| C | 0 | 192 | 1003358 | 4577.29 | 802 | 796 | 219.0 |
| C | 12 | 254 | 530046 | 2416.34 | 802 | 796 | 219.0 |
| C | 13 | 3 | 436941 | 1991.26 | 802 | 796 | 219.0 |
| D | 8 | 176 | 241482 | 1067.11 | 800 | 770 | 225.6 |
| D | 5 | 157 | 184950 | 816.49 | 800 | 770 | 225.6 |
| D | 2 | 120 | 166034 | 732.64 | 800 | 770 | 225.6 |
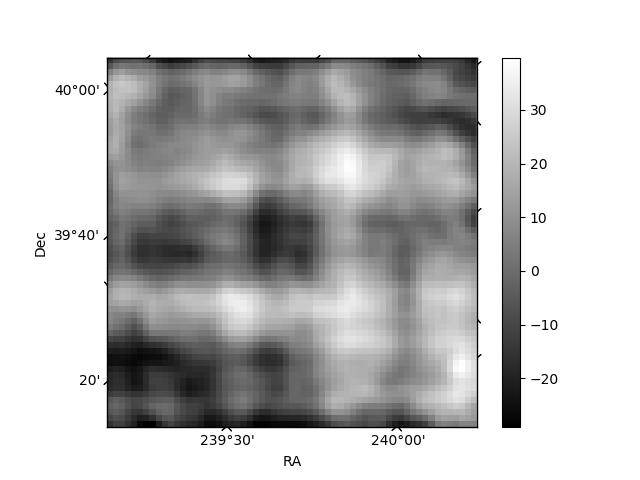
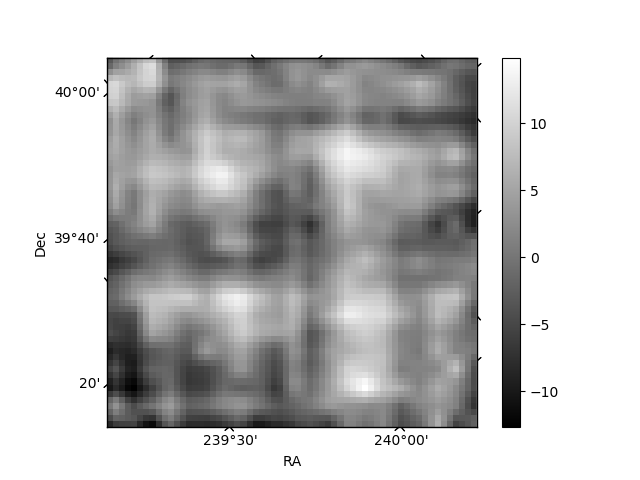
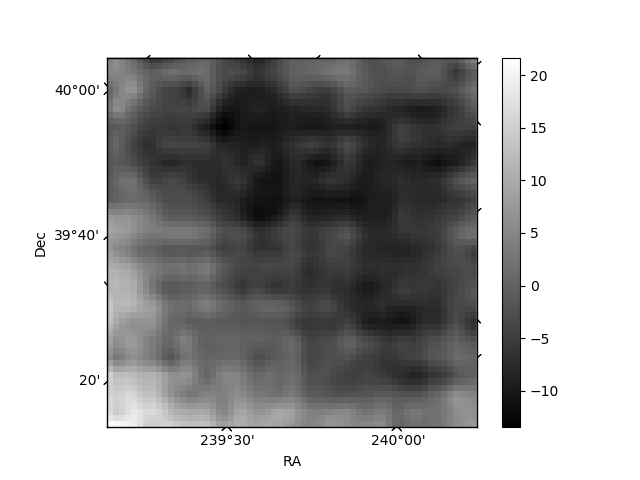
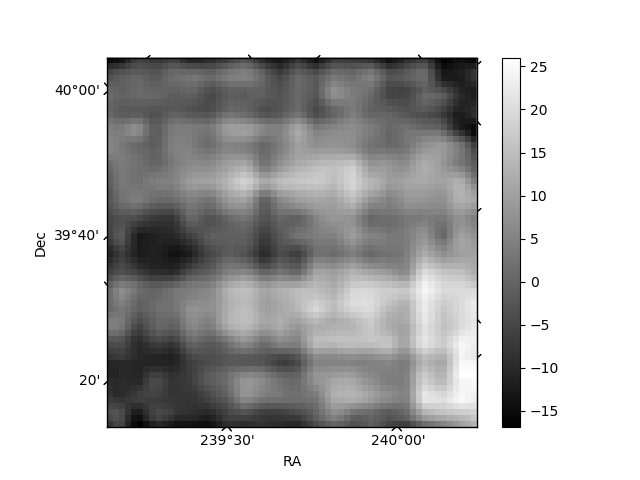
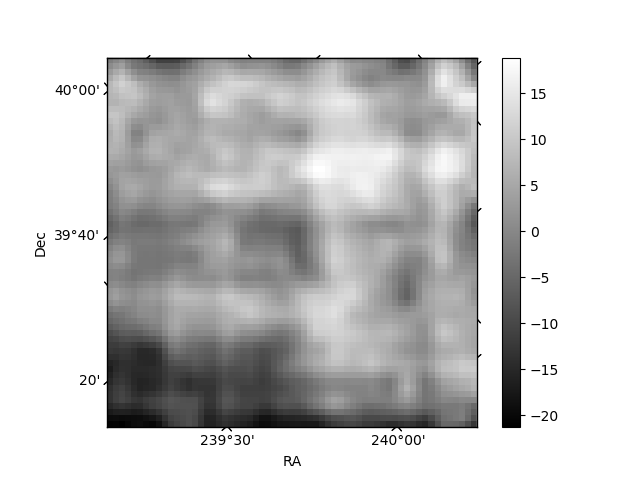
Histogram calculated using DETX and DETY for each event in the final _common_clean file
| Quadrant A | 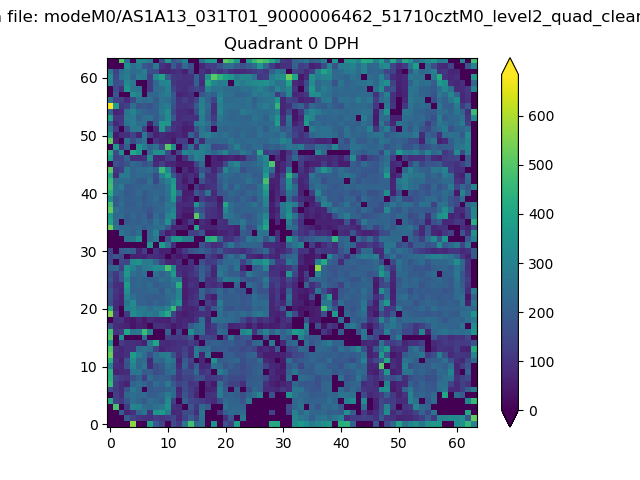 |
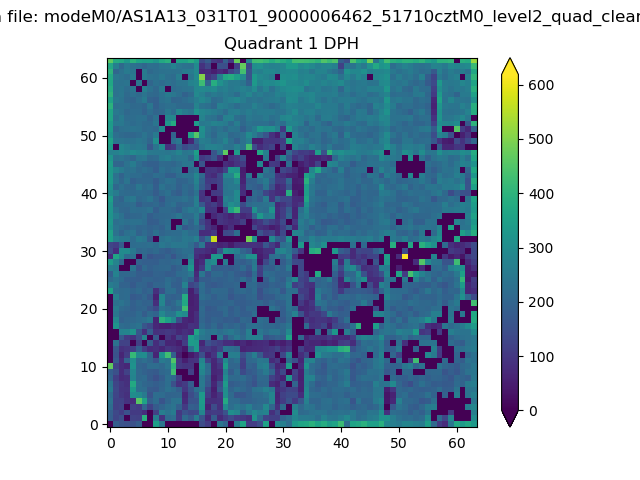 |
Quadrant B |
|---|---|---|---|
| Quadrant D | 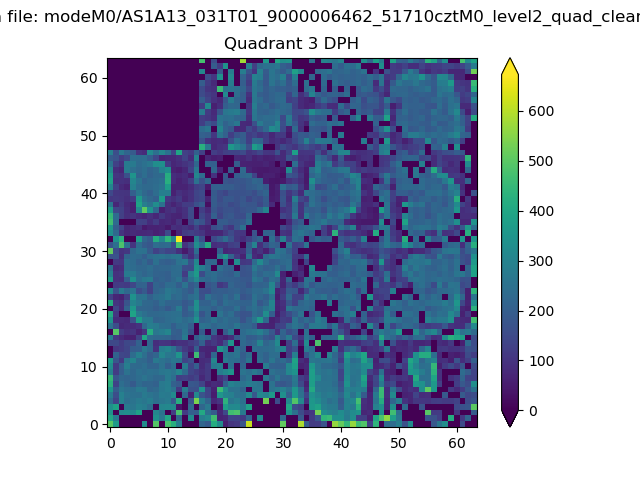 |
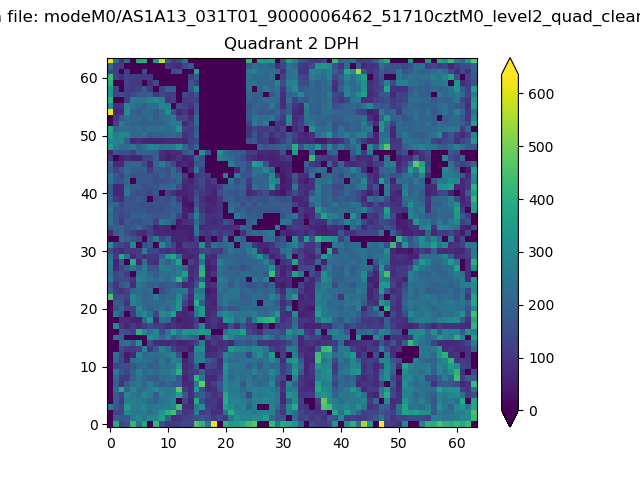 |
Quadrant C |
| Plot type | Count rate plots | Images |
|---|---|---|
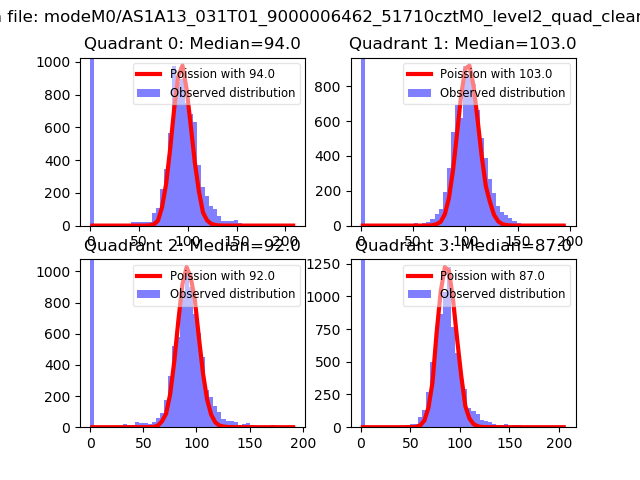
| Comparison with Poisson distribution Blue bars denote a histogram of data divided into 1 sec bins. Red curve is a Poisson curve with rate = median count rate of data. |
 |
 |
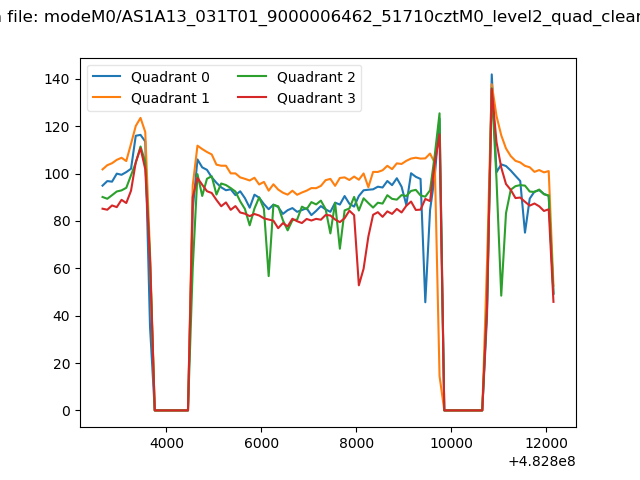
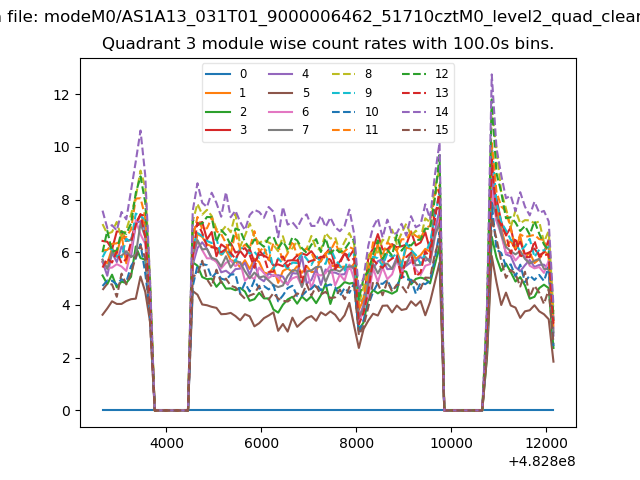
| Quadrant-wise count rates Data is divided into 100 sec bins |
 |
|
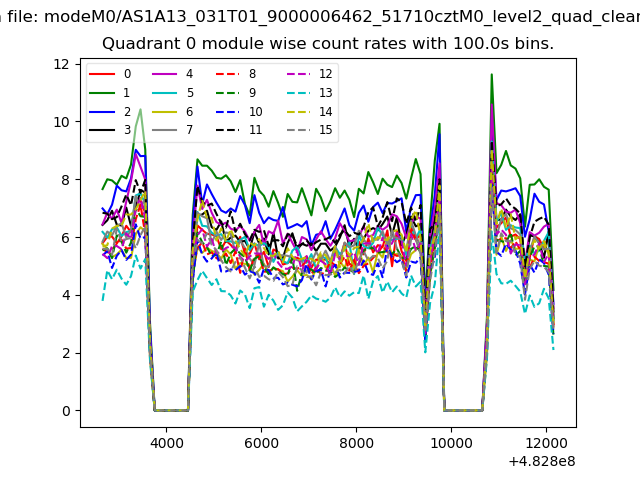
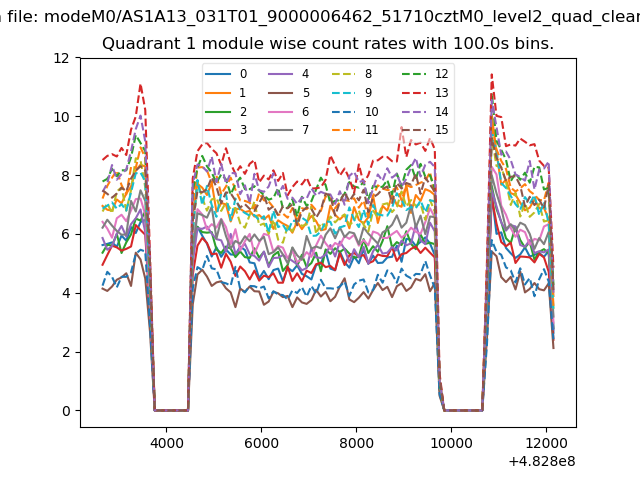
| Module-wise count rates for Quadrant A Data is divided into 100 sec bins |
 |
 |
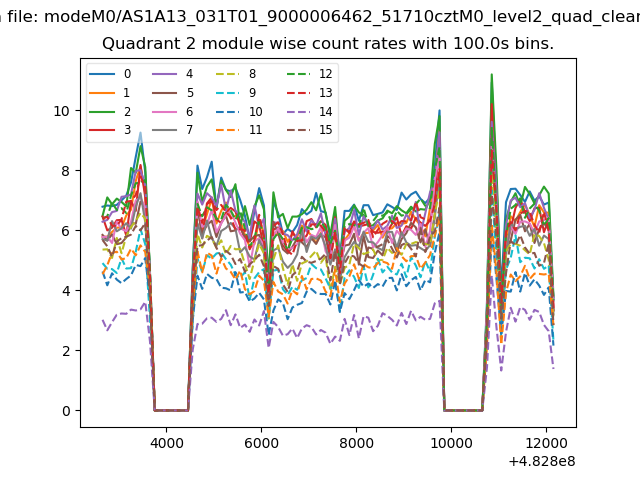
| Module-wise count rates for Quadrant B Data is divided into 100 sec bins |
 |
 |
| Module-wise count rates for Quadrant C Data is divided into 100 sec bins |
 |
 |
| Module-wise count rates for Quadrant D Data is divided into 100 sec bins |
 |
 |
| Parameter | Plot |
|---|---|
| CZT HV Monitor | 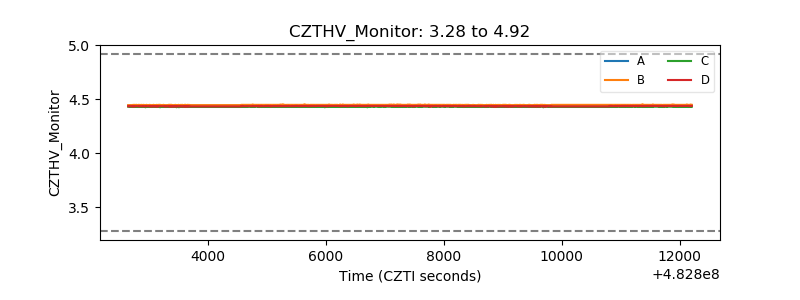 |
| D_VDD | 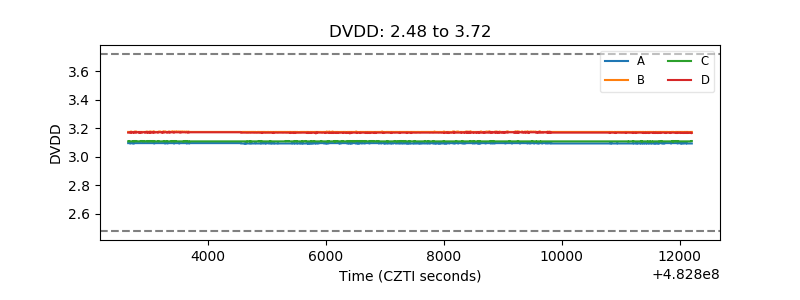 |
| Temperature 1 | 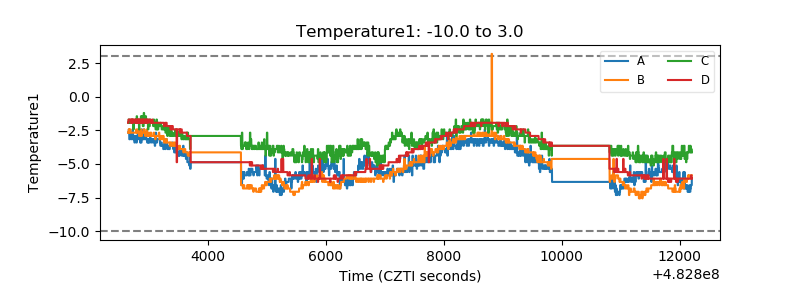 |
| Veto HV Monitor | 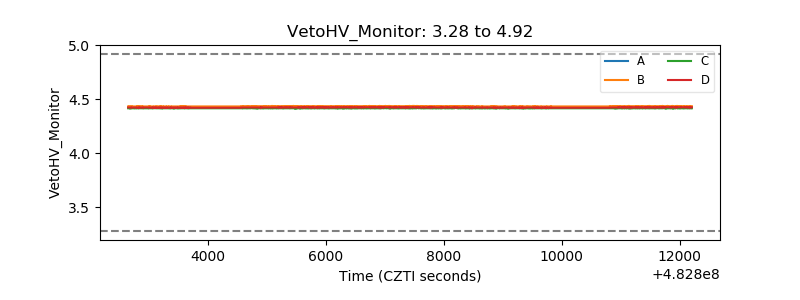 |
| Veto LLD | 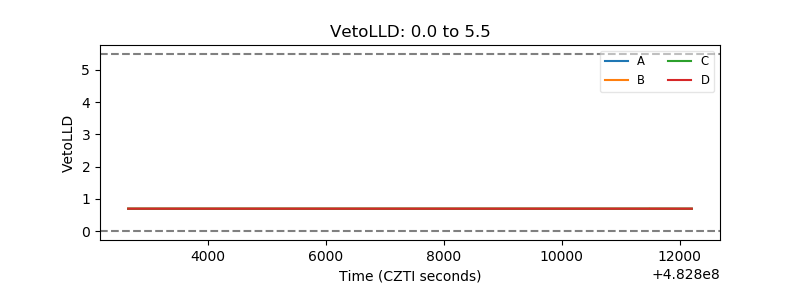 |
| Alpha Counter | 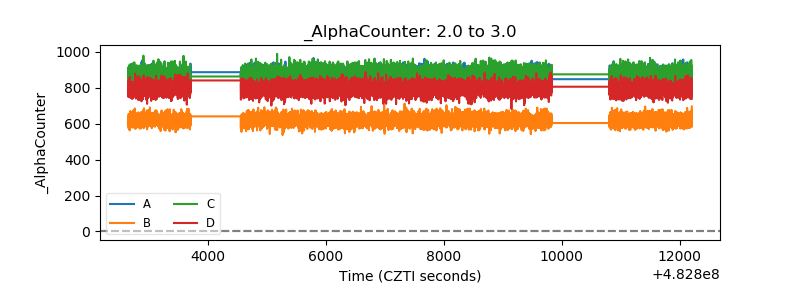 |
| _CPM_Rate | 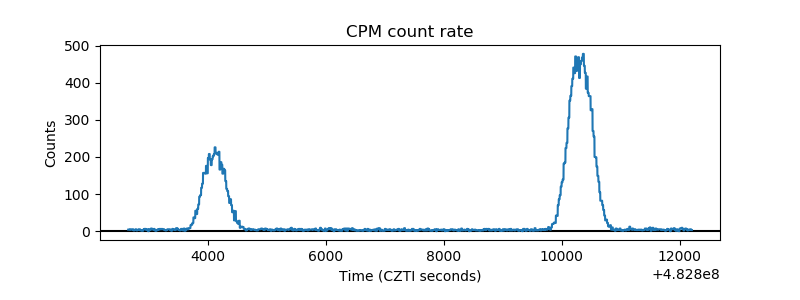 |
| CZT Counter | 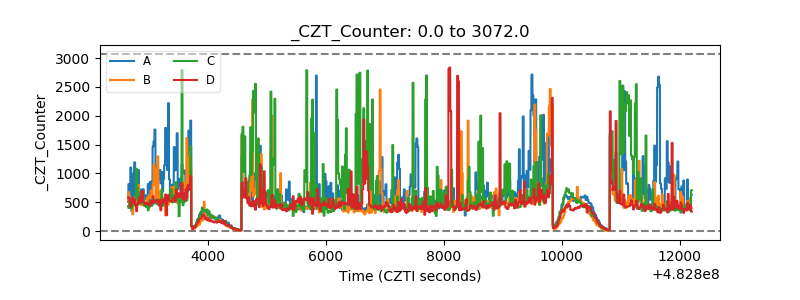 |
| +2.5 Volts monitor |  |
| +5 Volts monitor | 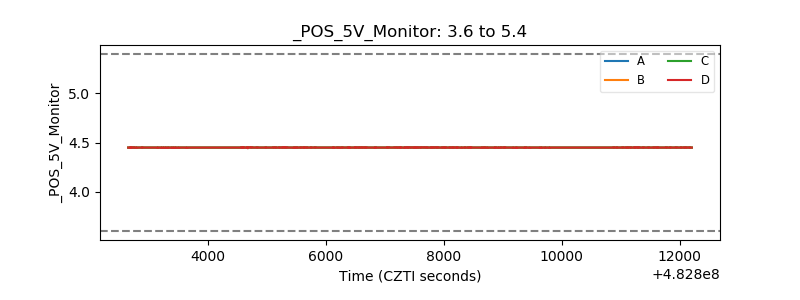 |
| _ROLL_ROT | 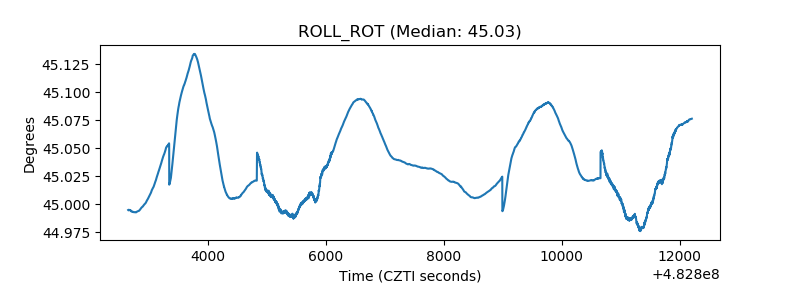 |
| _Roll_DEC |  |
| _Roll_RA | 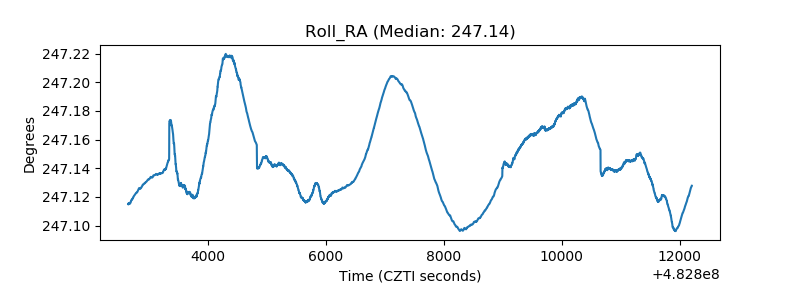 |
| Veto Counter | 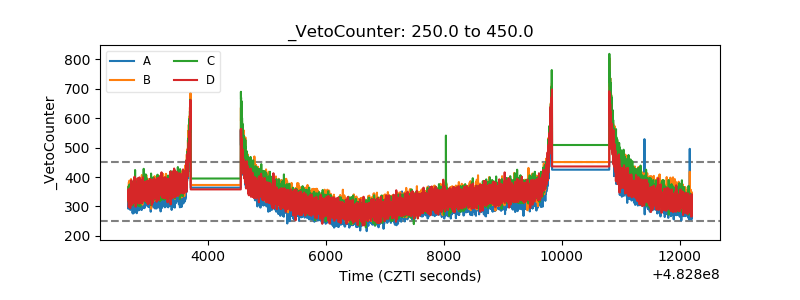 |