| Param | Original file | Final file |
|---|---|---|
| Filename | modeM0/AS1A13_031T01_9000006462_51711cztM0_level2.fits | modeM0/AS1A13_031T01_9000006462_51711cztM0_level2_quad_clean.evt |
| Size (bytes) | 581,163,840 | 100,978,560 |
| Size | 554.2 MB | 96.3 MB |
| Events in quadrant A | 5,603,263 | 668,318 |
| Events in quadrant B | 4,641,545 | 697,822 |
| Events in quadrant C | 6,960,032 | 576,307 |
| Events in quadrant D | 3,763,541 | 626,157 |
| Mode M9 | |||
|---|---|---|---|
| Quadrant | BADHDUFLAG | Total packets | Discarded packets |
| A | 0 | 20 | 0 |
| B | 0 | 20 | 0 |
| C | 0 | 20 | 0 |
| D | 0 | 20 | 0 |
| Mode M0 | |||
|---|---|---|---|
| Quadrant | BADHDUFLAG | Total packets | Discarded packets |
| A | 0 | 21441 | 3 |
| B | 0 | 18707 | 2 |
| C | 0 | 25715 | 2 |
| D | 0 | 16245 | 2 |
| Mode SS | |||
|---|---|---|---|
| Quadrant | BADHDUFLAG | Total packets | Discarded packets |
| A | 0 | 146 | 0 |
| B | 0 | 146 | 0 |
| C | 0 | 146 | 0 |
| D | 0 | 146 | 0 |
| Quadrant | Total seconds | Saturated seconds | Saturation percentage |
|---|---|---|---|
| A | 7017 | 314 | 4.474847% |
| B | 7017 | 508 | 7.239561% |
| C | 7017 | 1108 | 15.790224% |
| D | 7018 | 104 | 1.481904% |
Noise dominated data is calculated using 1-second bins in cleaned event files. If a bin has >2000 counts, and if more than 50% of those come from <1% of pixels, then it is considered to be noise-dominated and hence unusable.
| Quadrant | # 1 sec bins | Bins with >0 counts | Bins with >2000 counts | High rate bins dominated by noise | Noise dominated (total time) | Noise dominated (detector-on time) | Marked lightcurve |
|---|---|---|---|---|---|---|---|
| A | 9082 | 7019 | 220 | 220 | 2.42% | 3.13% | 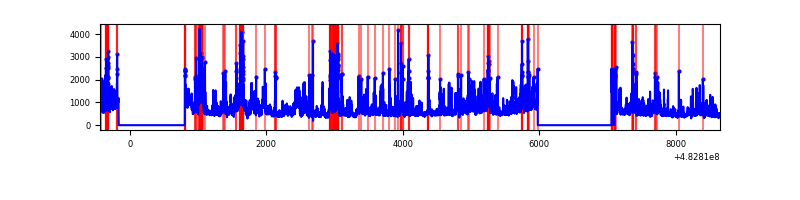 |
| B | 9082 | 7019 | 298 | 298 | 3.28% | 4.25% | 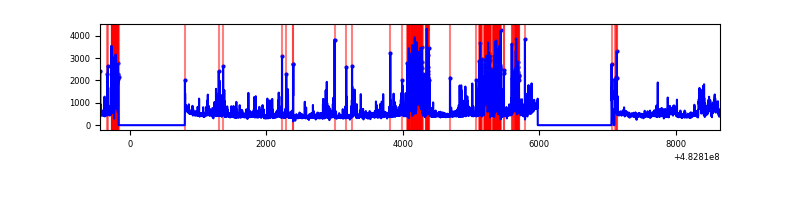 |
| C | 9082 | 7020 | 1186 | 1186 | 13.06% | 16.89% | 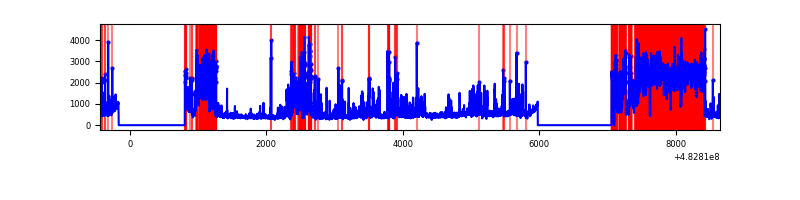 |
| D | 9083 | 7020 | 73 | 73 | 0.80% | 1.04% | 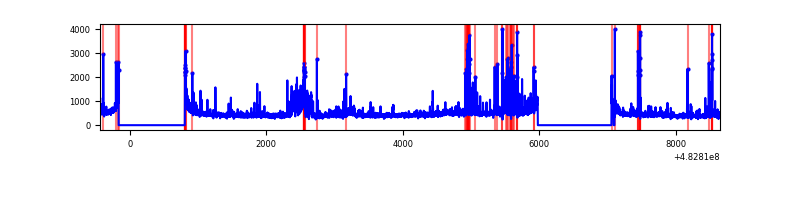 |
Top three noisy pixels from each quadrant. If the there are fewer than three noisy pixels in the level2.evt file, extra rows are filled as -1
| Pixel properties | Quadrant properties | ||||||
|---|---|---|---|---|---|---|---|
| Quadrant | DetID | PixID | Counts | Sigma | Mean | Median | Sigma |
| A | 3 | 78 | 1608785 | 8711.41 | 744 | 726 | 184.6 |
| A | 3 | 14 | 375004 | 2027.59 | 744 | 726 | 184.6 |
| A | 12 | 3 | 182110 | 982.62 | 744 | 726 | 184.6 |
| B | 1 | 223 | 750551 | 4770.57 | 727 | 701 | 157.2 |
| B | 12 | 32 | 360397 | 2288.4 | 727 | 701 | 157.2 |
| B | 8 | 128 | 218918 | 1388.3 | 727 | 701 | 157.2 |
| C | 9 | 38 | 2118495 | 11022.95 | 704 | 699 | 192.1 |
| C | 0 | 192 | 1330567 | 6921.85 | 704 | 699 | 192.1 |
| C | 13 | 3 | 330245 | 1715.26 | 704 | 699 | 192.1 |
| D | 3 | 12 | 255803 | 1261.53 | 726 | 701 | 202.2 |
| D | 15 | 107 | 179038 | 881.91 | 726 | 701 | 202.2 |
| D | 6 | 228 | 134237 | 660.36 | 726 | 701 | 202.2 |
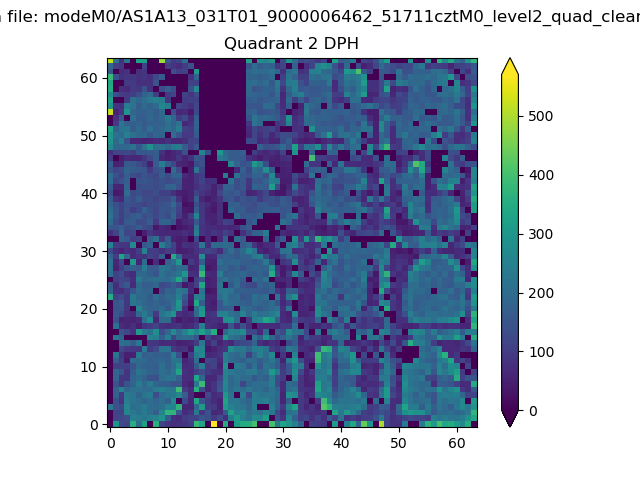
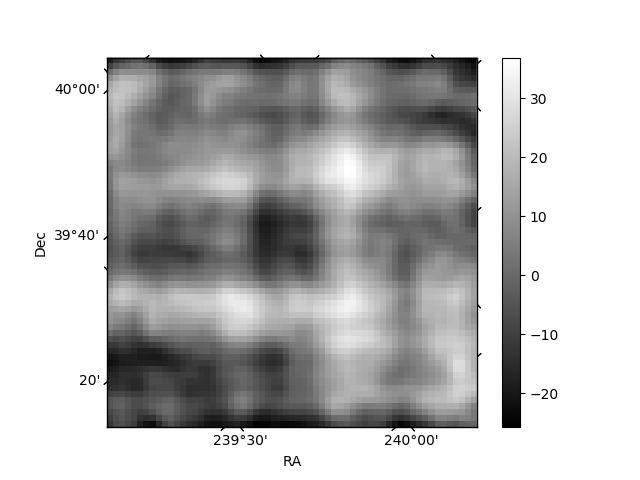
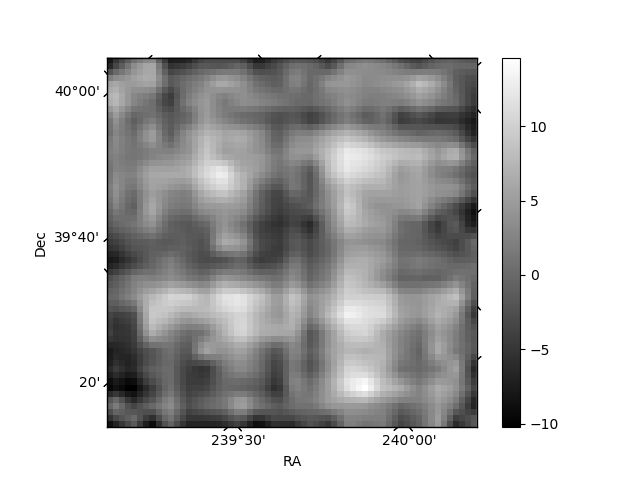
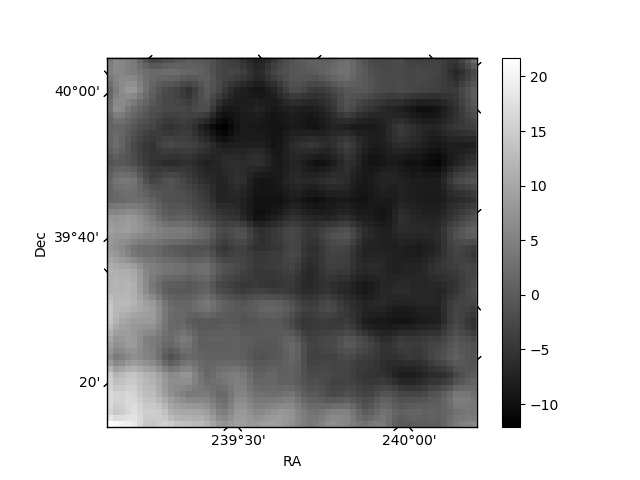
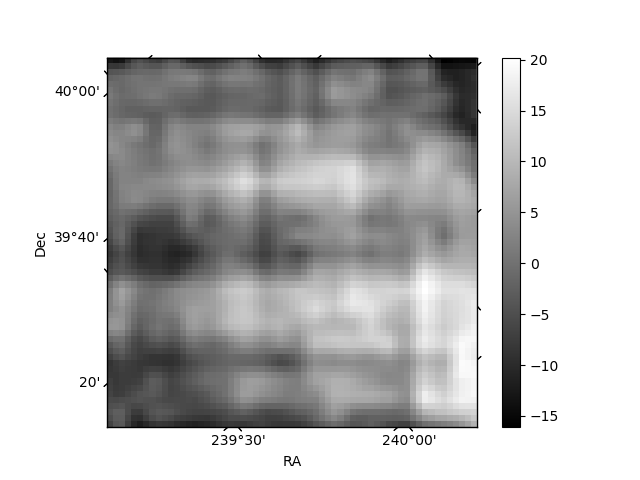
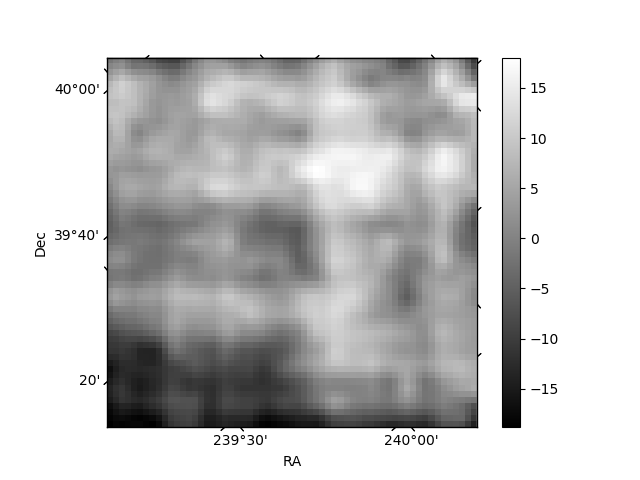
Histogram calculated using DETX and DETY for each event in the final _common_clean file
| Quadrant A | 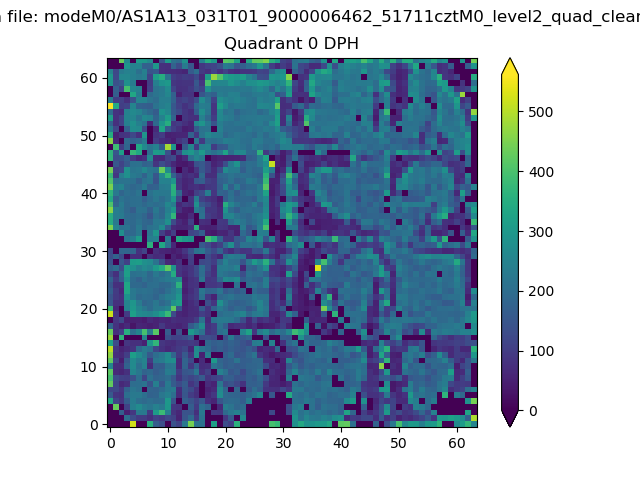 |
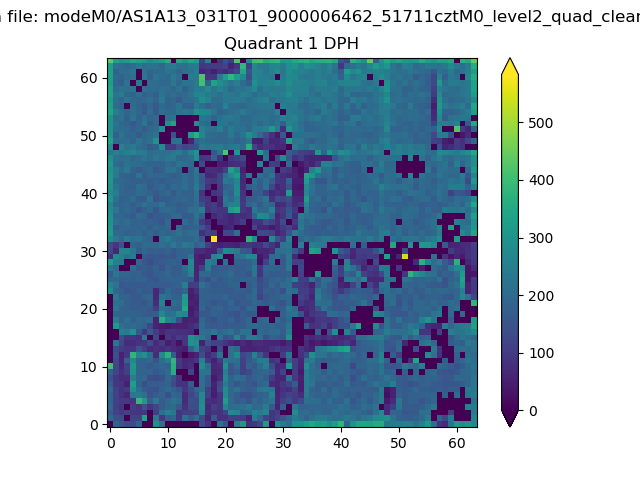 |
Quadrant B |
|---|---|---|---|
| Quadrant D | 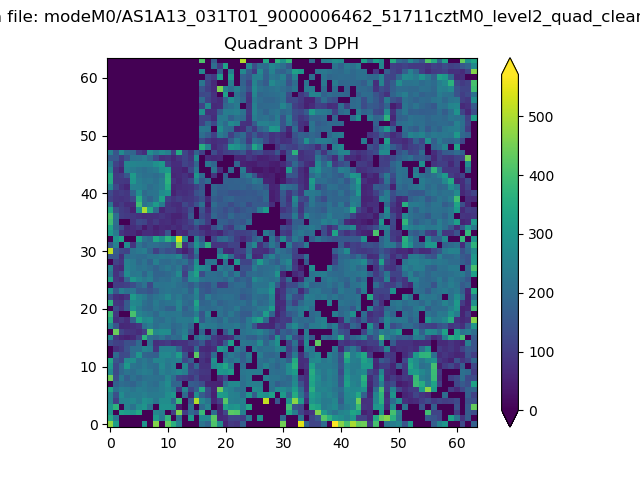 |
 |
Quadrant C |
| Plot type | Count rate plots | Images |
|---|---|---|
| Comparison with Poisson distribution Blue bars denote a histogram of data divided into 1 sec bins. Red curve is a Poisson curve with rate = median count rate of data. |
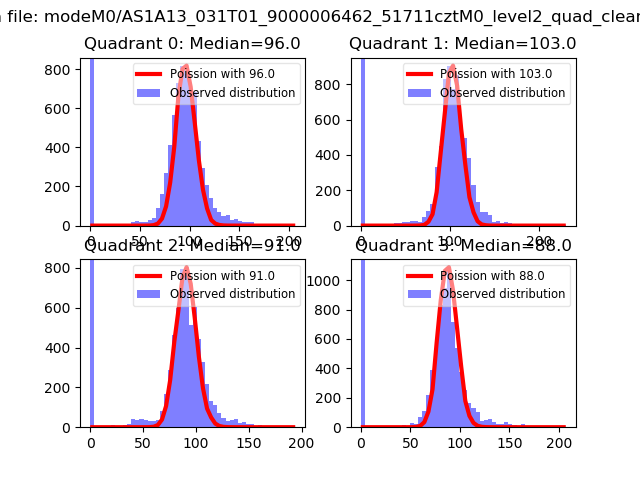 |
 |
| Quadrant-wise count rates Data is divided into 100 sec bins |
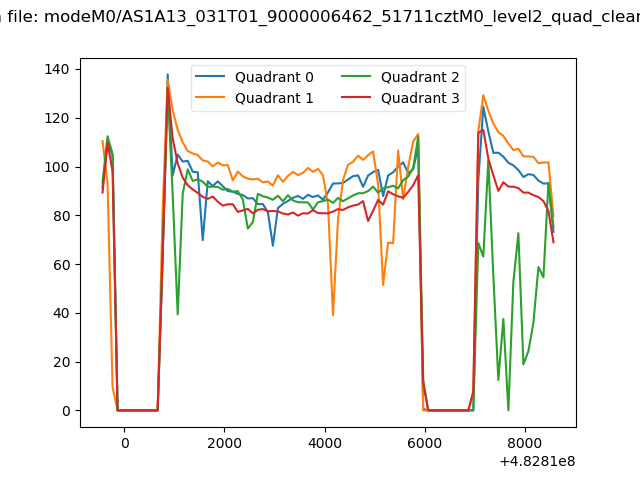 |
|
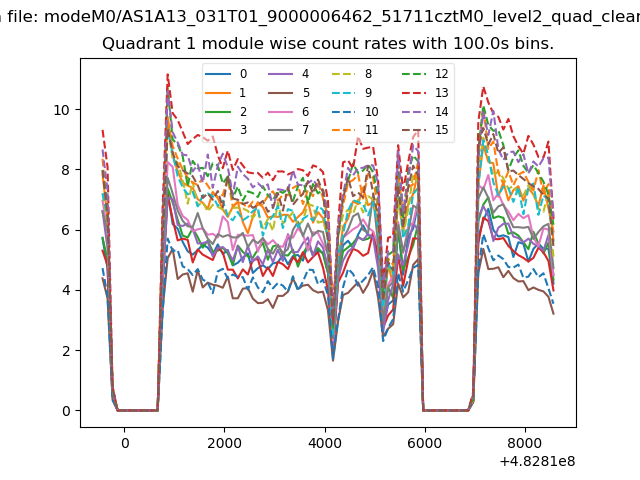
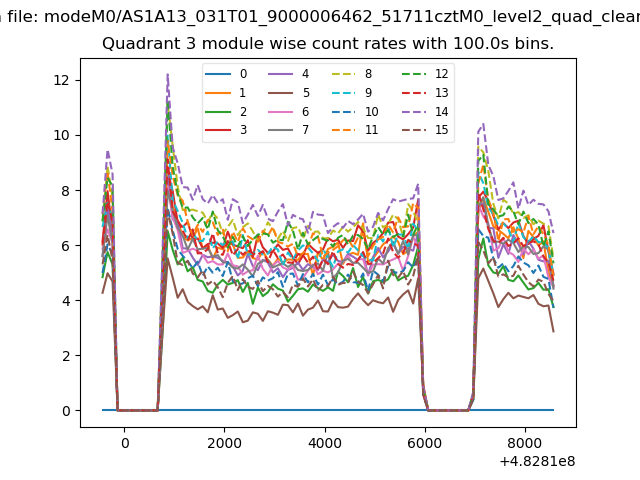
| Module-wise count rates for Quadrant A Data is divided into 100 sec bins |
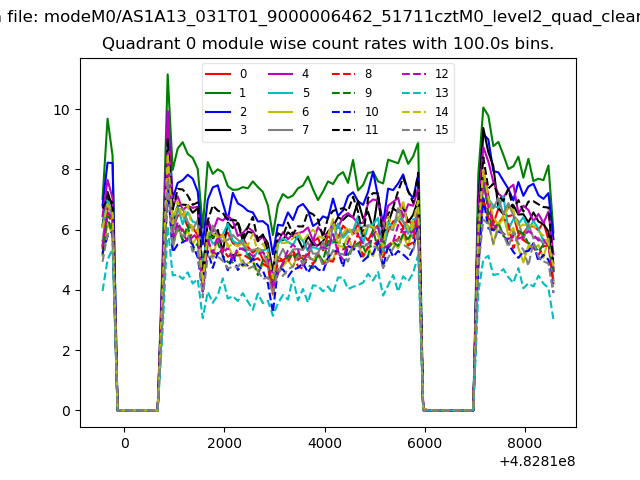 |
 |
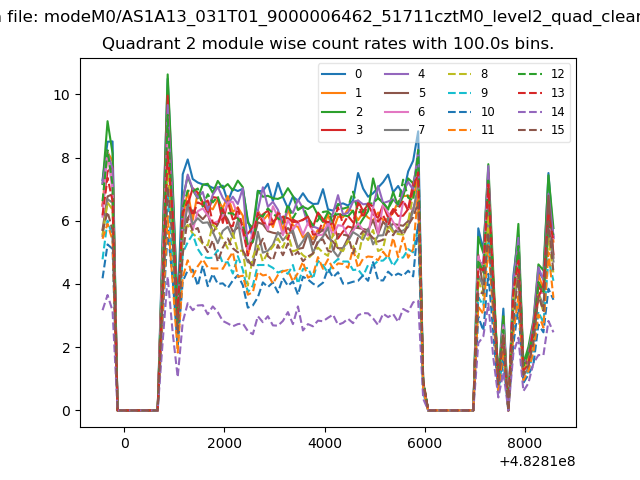
| Module-wise count rates for Quadrant B Data is divided into 100 sec bins |
 |
 |
| Module-wise count rates for Quadrant C Data is divided into 100 sec bins |
 |
 |
| Module-wise count rates for Quadrant D Data is divided into 100 sec bins |
 |
 |
| Parameter | Plot |
|---|---|
| CZT HV Monitor | 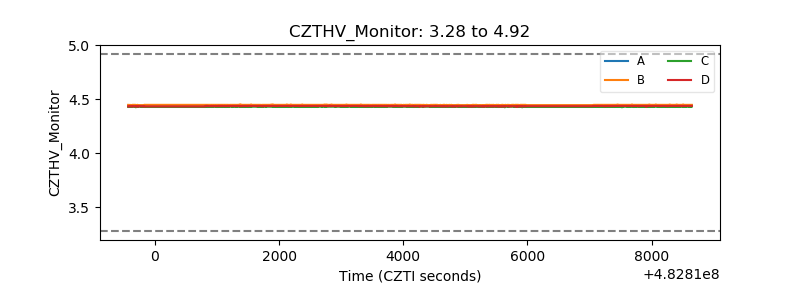 |
| D_VDD | 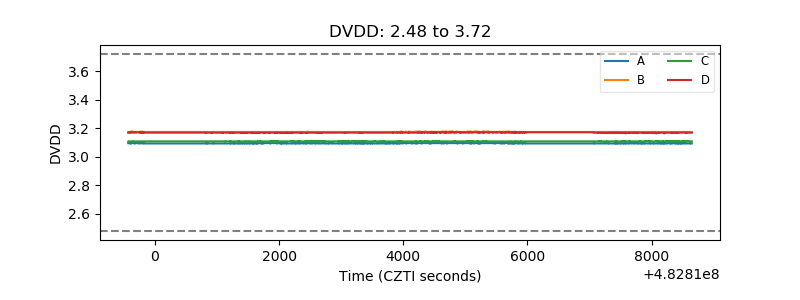 |
| Temperature 1 | 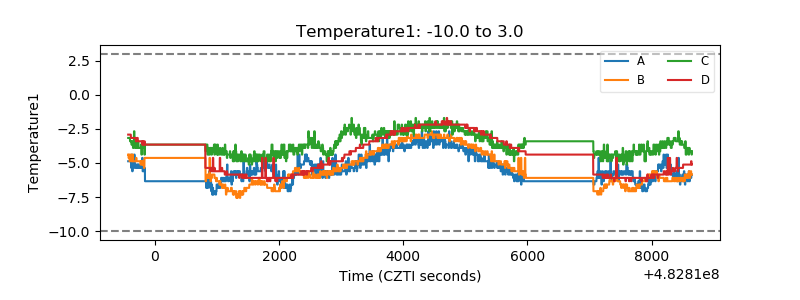 |
| Veto HV Monitor | 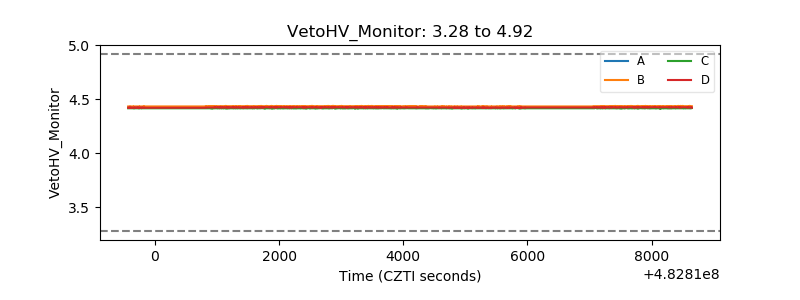 |
| Veto LLD | 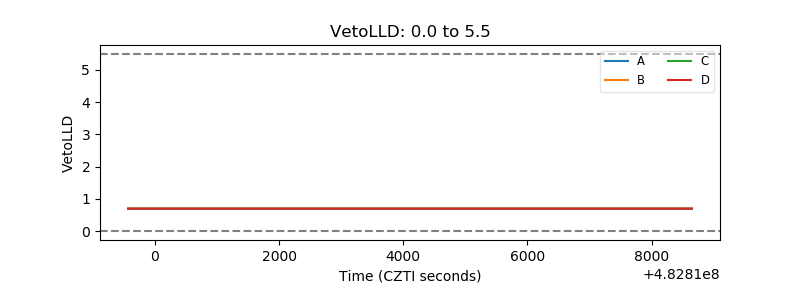 |
| Alpha Counter | 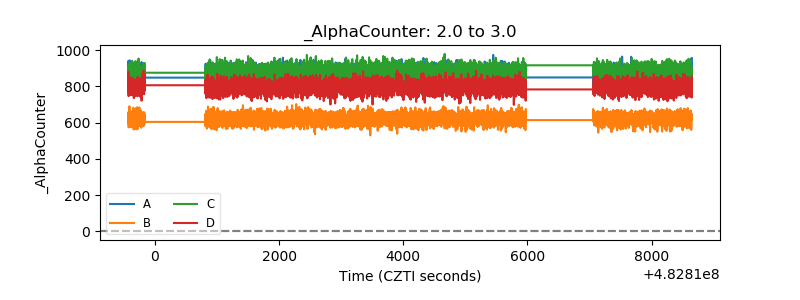 |
| _CPM_Rate | 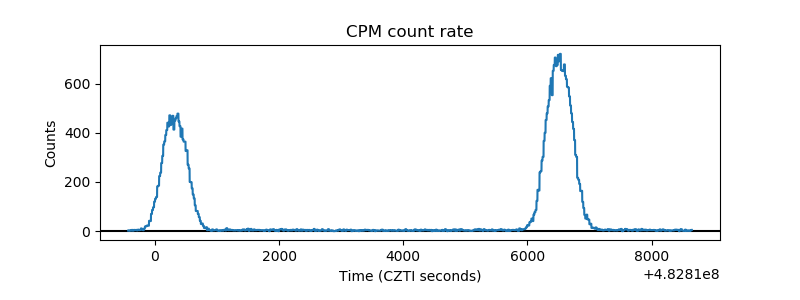 |
| CZT Counter | 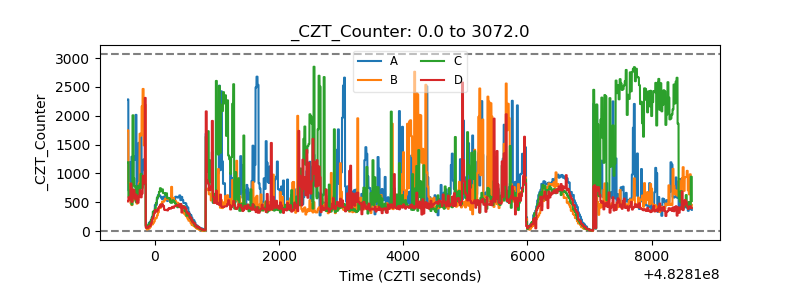 |
| +2.5 Volts monitor | 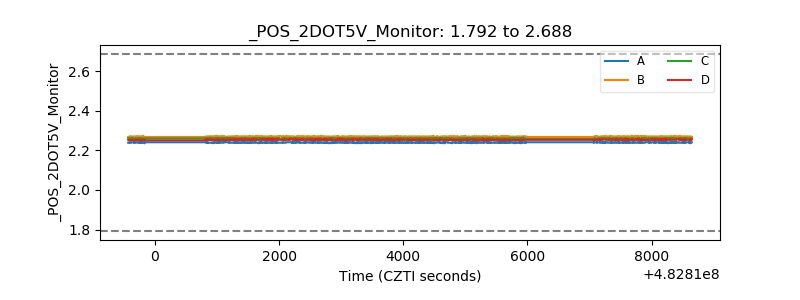 |
| +5 Volts monitor | 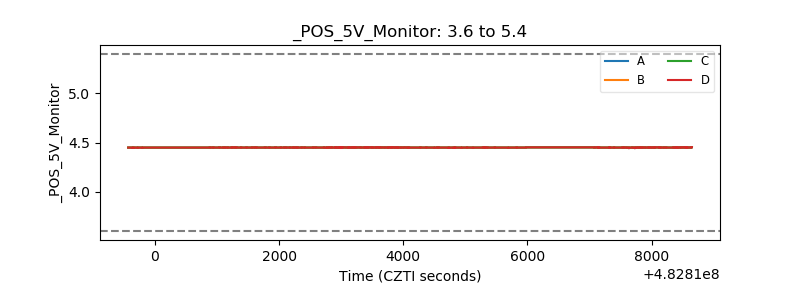 |
| _ROLL_ROT | 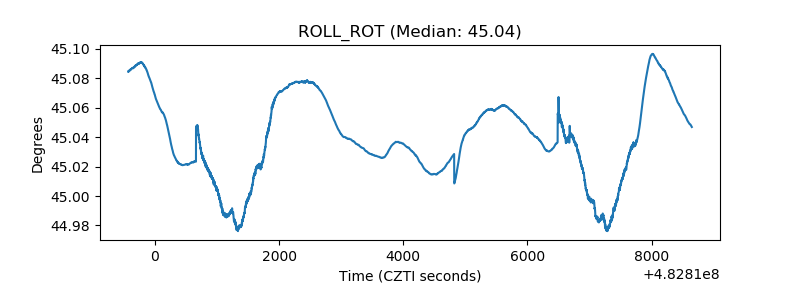 |
| _Roll_DEC | 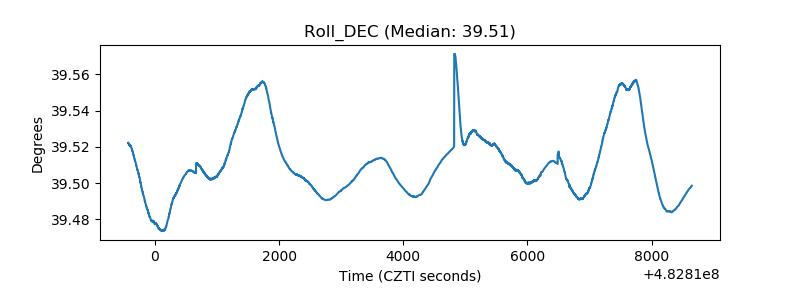 |
| _Roll_RA | 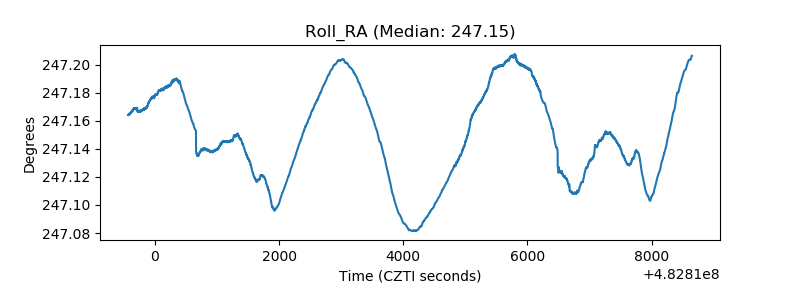 |
| Veto Counter | 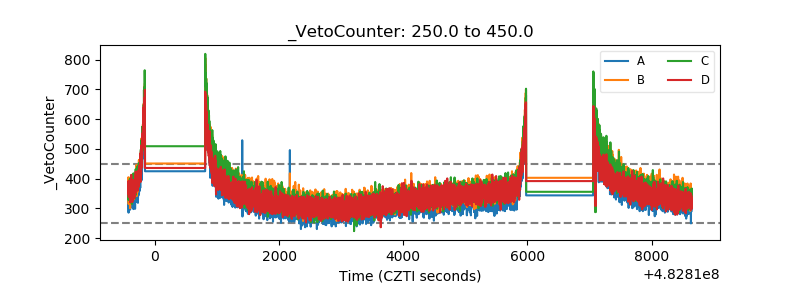 |