| Param | Original file | Final file |
|---|---|---|
| Filename | modeM0/AS1A13_031T01_9000006462_51713cztM0_level2.fits | modeM0/AS1A13_031T01_9000006462_51713cztM0_level2_quad_clean.evt |
| Size (bytes) | 571,884,480 | 97,701,120 |
| Size | 545.4 MB | 93.2 MB |
| Events in quadrant A | 5,670,192 | 638,149 |
| Events in quadrant B | 4,805,330 | 680,233 |
| Events in quadrant C | 6,421,127 | 570,675 |
| Events in quadrant D | 3,749,447 | 598,926 |
| Mode M9 | |||
|---|---|---|---|
| Quadrant | BADHDUFLAG | Total packets | Discarded packets |
| A | 0 | 15 | 0 |
| B | 0 | 16 | 0 |
| C | 0 | 16 | 0 |
| D | 0 | 16 | 0 |
| Mode M0 | |||
|---|---|---|---|
| Quadrant | BADHDUFLAG | Total packets | Discarded packets |
| A | 0 | 21485 | 2 |
| B | 0 | 18867 | 2 |
| C | 0 | 23847 | 2 |
| D | 0 | 15769 | 2 |
| Mode SS | |||
|---|---|---|---|
| Quadrant | BADHDUFLAG | Total packets | Discarded packets |
| A | 0 | 138 | 0 |
| B | 0 | 138 | 0 |
| C | 0 | 138 | 0 |
| D | 0 | 138 | 0 |
| Quadrant | Total seconds | Saturated seconds | Saturation percentage |
|---|---|---|---|
| A | 6744 | 425 | 6.301898% |
| B | 6744 | 548 | 8.125741% |
| C | 6744 | 1081 | 16.029063% |
| D | 6744 | 106 | 1.571767% |
Noise dominated data is calculated using 1-second bins in cleaned event files. If a bin has >2000 counts, and if more than 50% of those come from <1% of pixels, then it is considered to be noise-dominated and hence unusable.
| Quadrant | # 1 sec bins | Bins with >0 counts | Bins with >2000 counts | High rate bins dominated by noise | Noise dominated (total time) | Noise dominated (detector-on time) | Marked lightcurve |
|---|---|---|---|---|---|---|---|
| A | 7874 | 6744 | 281 | 281 | 3.57% | 4.17% | 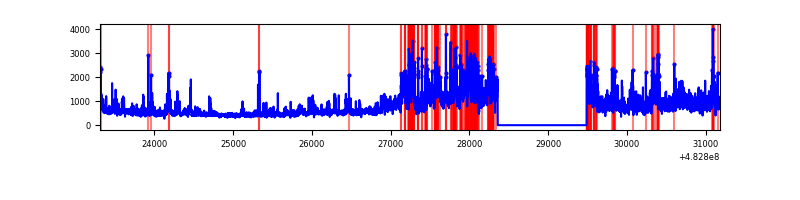 |
| B | 7874 | 6745 | 321 | 321 | 4.08% | 4.76% | 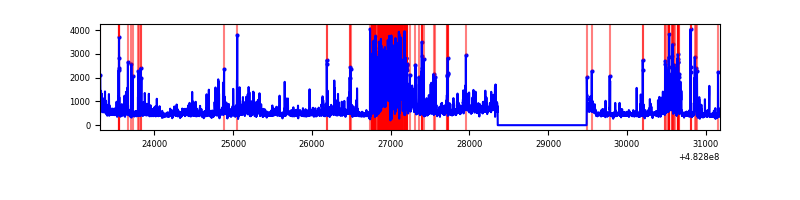 |
| C | 7874 | 6745 | 711 | 711 | 9.03% | 10.54% | 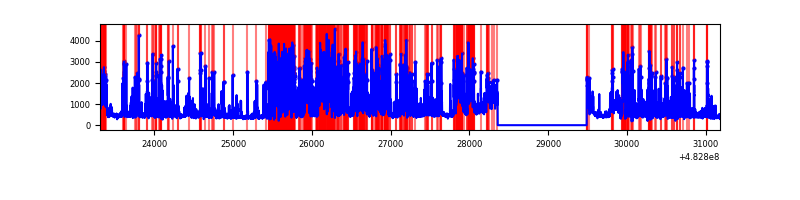 |
| D | 7874 | 6745 | 66 | 66 | 0.84% | 0.98% | 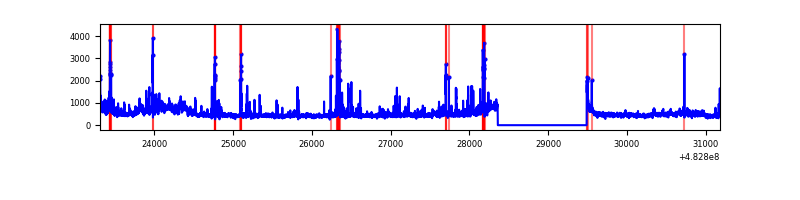 |
Top three noisy pixels from each quadrant. If the there are fewer than three noisy pixels in the level2.evt file, extra rows are filled as -1
| Pixel properties | Quadrant properties | ||||||
|---|---|---|---|---|---|---|---|
| Quadrant | DetID | PixID | Counts | Sigma | Mean | Median | Sigma |
| A | 3 | 14 | 1734485 | 9837.32 | 723 | 707 | 176.2 |
| A | 3 | 78 | 654098 | 3707.29 | 723 | 707 | 176.2 |
| A | 12 | 3 | 148263 | 837.22 | 723 | 707 | 176.2 |
| B | 1 | 223 | 1073113 | 7070.19 | 709 | 685 | 151.7 |
| B | 10 | 254 | 272639 | 1792.91 | 709 | 685 | 151.7 |
| B | 8 | 128 | 225925 | 1484.94 | 709 | 685 | 151.7 |
| C | 12 | 254 | 1432790 | 7753.92 | 670 | 665 | 184.7 |
| C | 15 | 231 | 481019 | 2600.77 | 670 | 665 | 184.7 |
| C | 9 | 38 | 423540 | 2289.56 | 670 | 665 | 184.7 |
| D | 5 | 157 | 177358 | 885.49 | 709 | 681 | 199.5 |
| D | 3 | 12 | 144055 | 718.58 | 709 | 681 | 199.5 |
| D | 15 | 24 | 117014 | 583.05 | 709 | 681 | 199.5 |
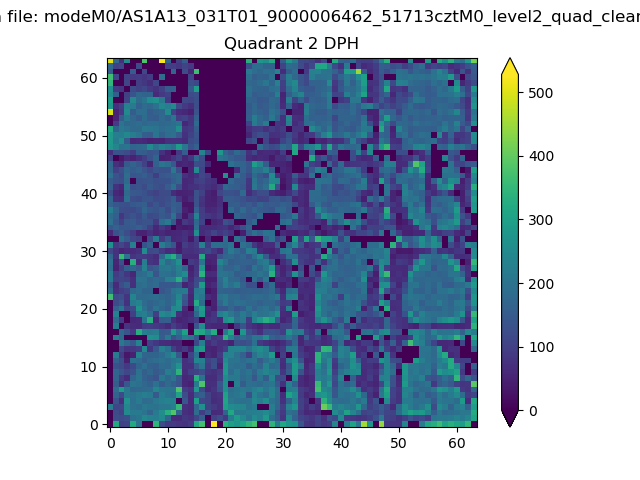
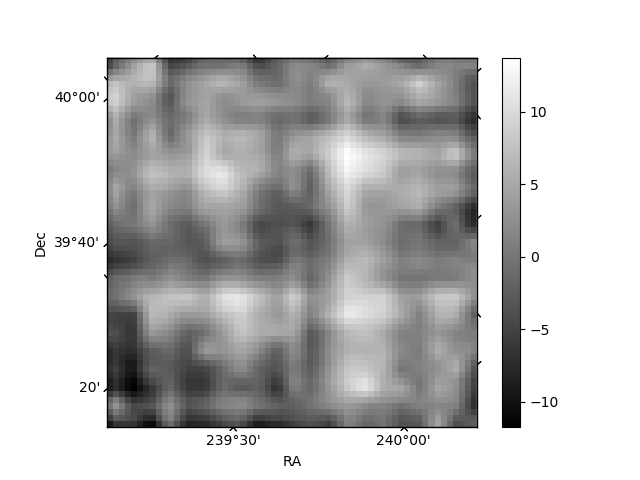
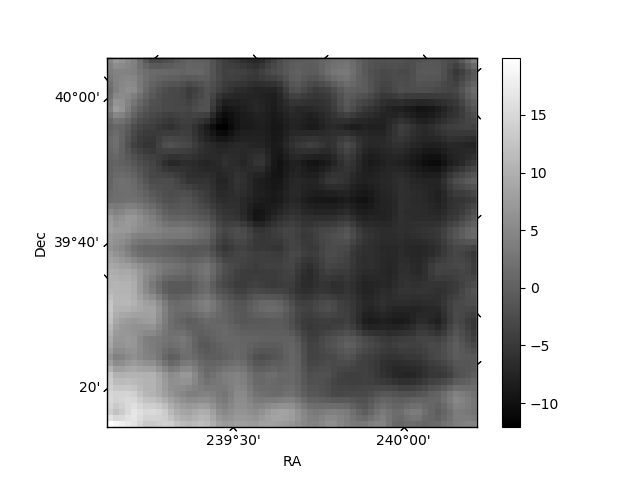
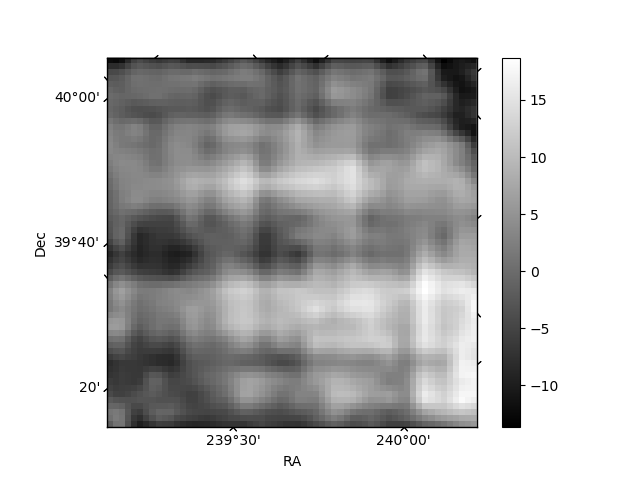
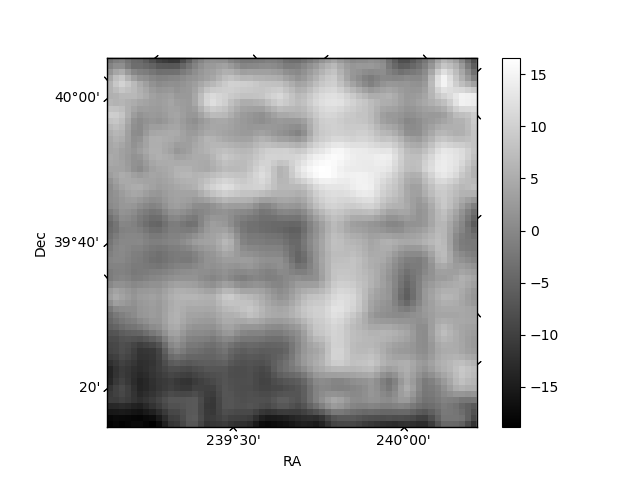
Histogram calculated using DETX and DETY for each event in the final _common_clean file
| Quadrant A | 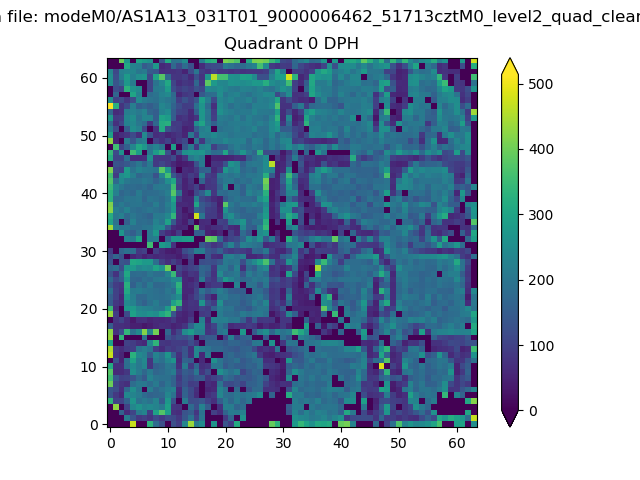 |
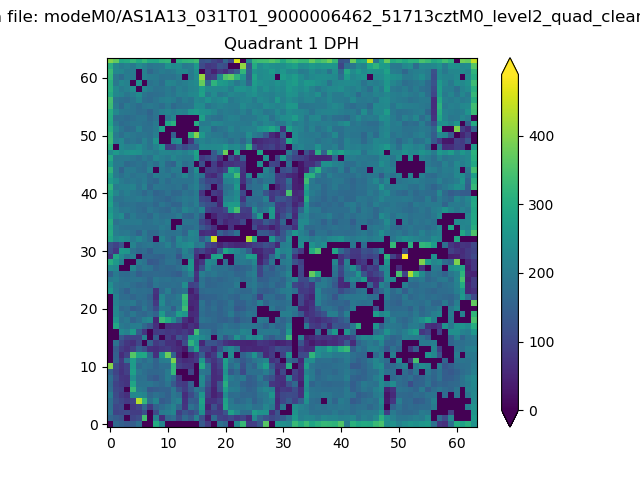 |
Quadrant B |
|---|---|---|---|
| Quadrant D | 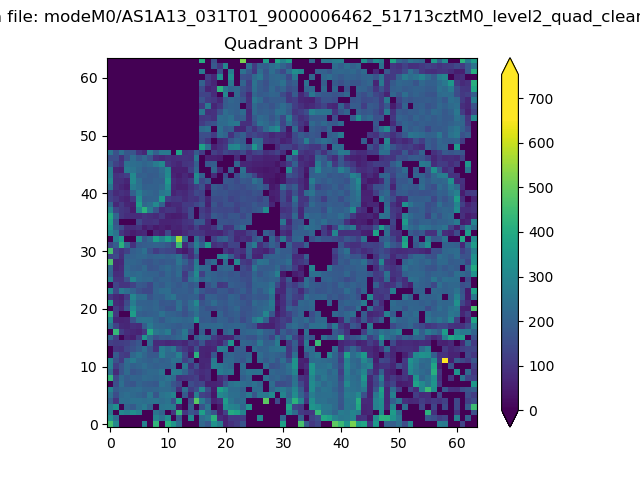 |
 |
Quadrant C |
| Plot type | Count rate plots | Images |
|---|---|---|
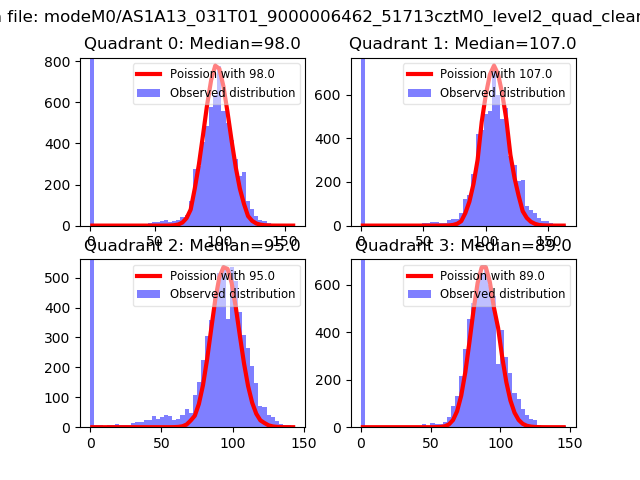
| Comparison with Poisson distribution Blue bars denote a histogram of data divided into 1 sec bins. Red curve is a Poisson curve with rate = median count rate of data. |
 |
 |
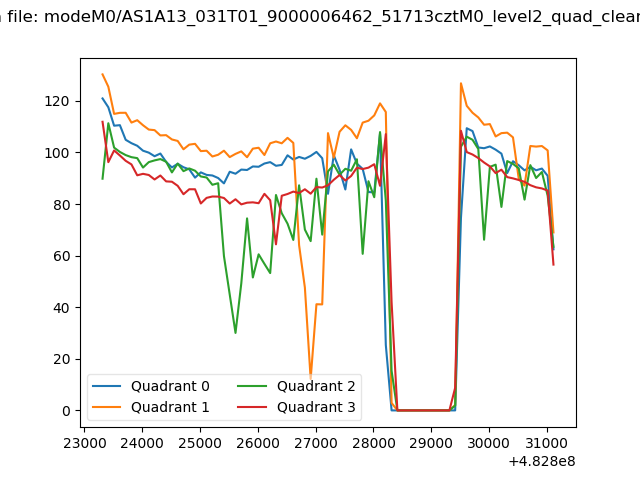
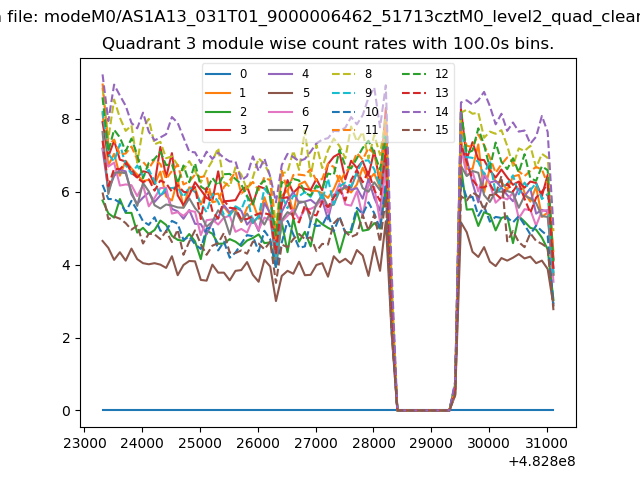
| Quadrant-wise count rates Data is divided into 100 sec bins |
 |
|
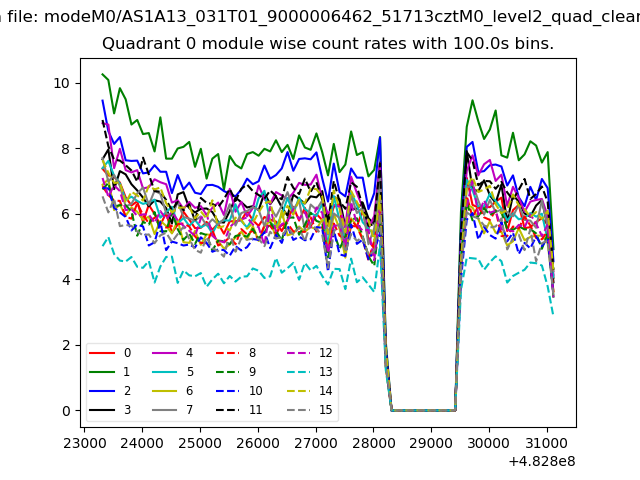
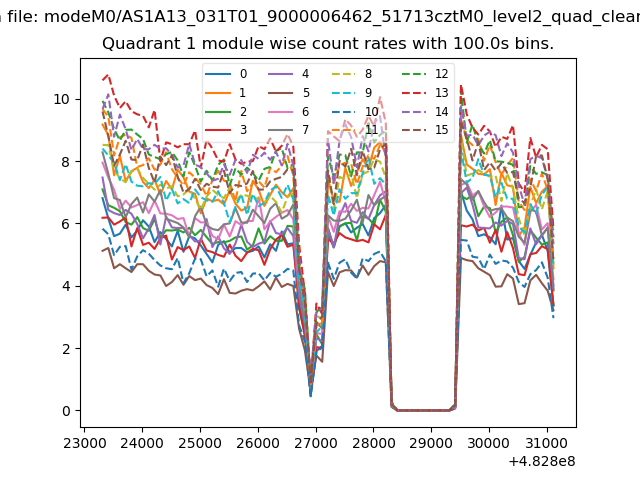
| Module-wise count rates for Quadrant A Data is divided into 100 sec bins |
 |
 |
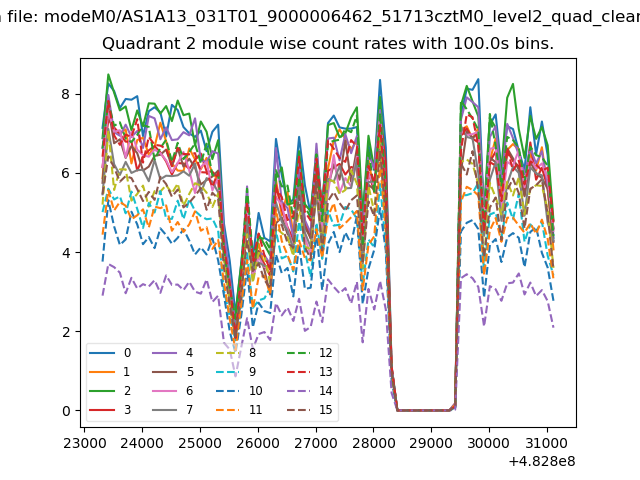
| Module-wise count rates for Quadrant B Data is divided into 100 sec bins |
 |
 |
| Module-wise count rates for Quadrant C Data is divided into 100 sec bins |
 |
 |
| Module-wise count rates for Quadrant D Data is divided into 100 sec bins |
 |
 |
| Parameter | Plot |
|---|---|
| CZT HV Monitor | 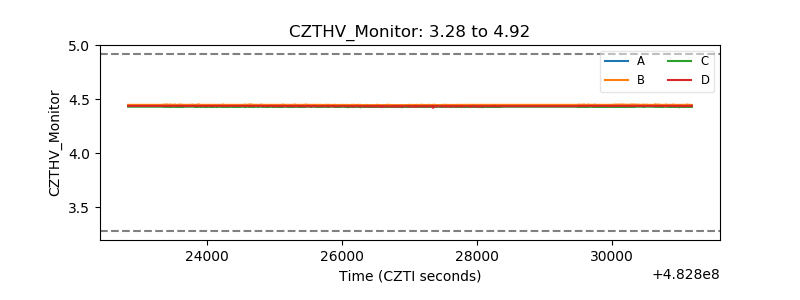 |
| D_VDD | 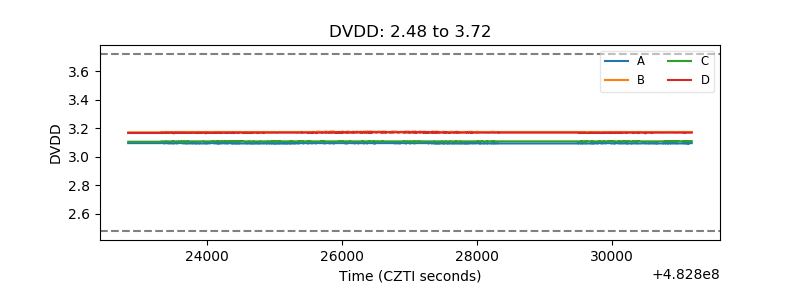 |
| Temperature 1 | 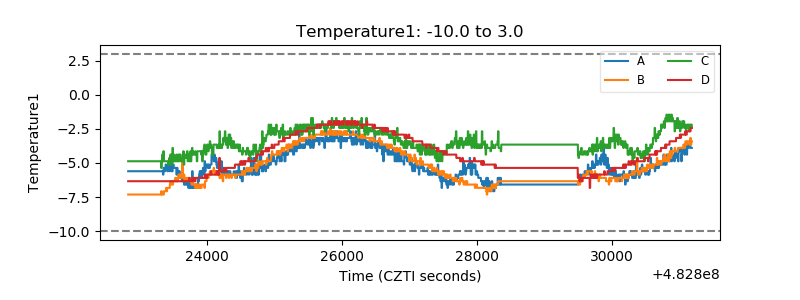 |
| Veto HV Monitor | 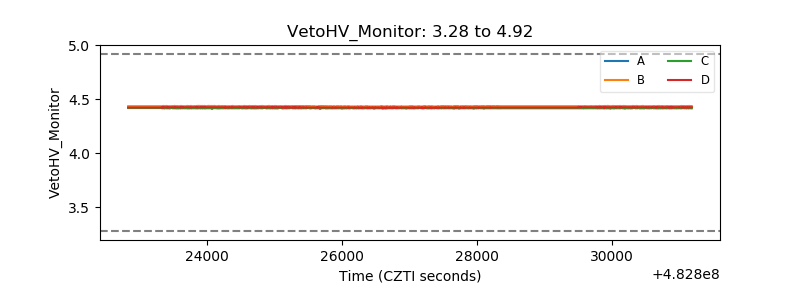 |
| Veto LLD | 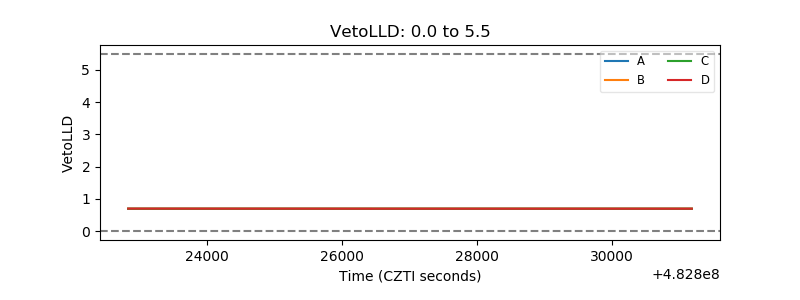 |
| Alpha Counter | 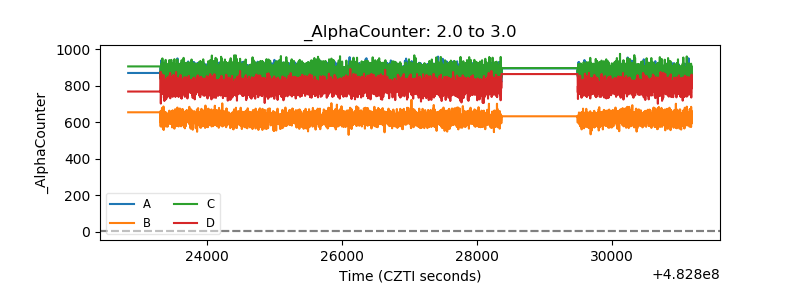 |
| _CPM_Rate | 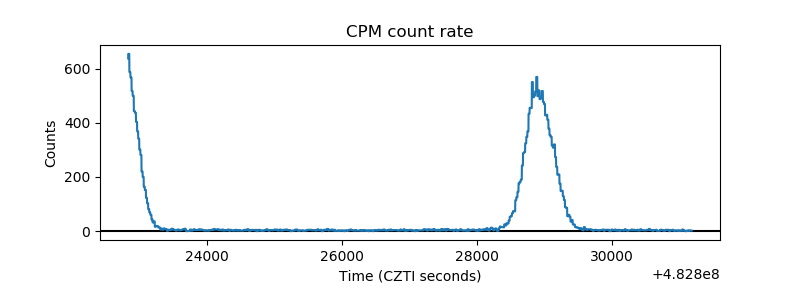 |
| CZT Counter | 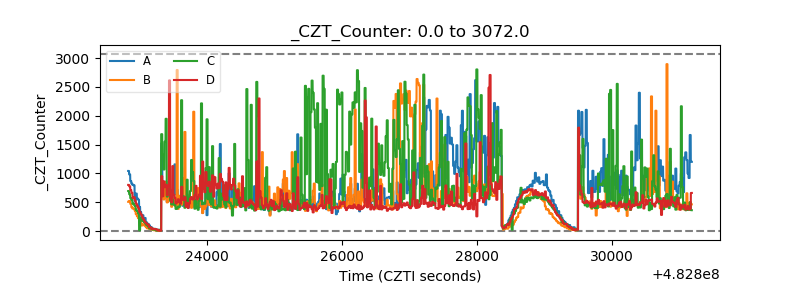 |
| +2.5 Volts monitor | 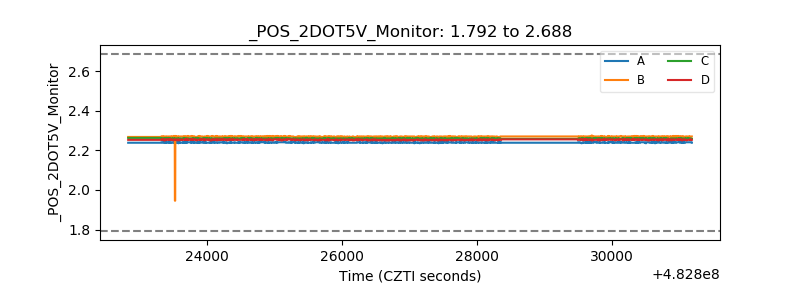 |
| +5 Volts monitor | 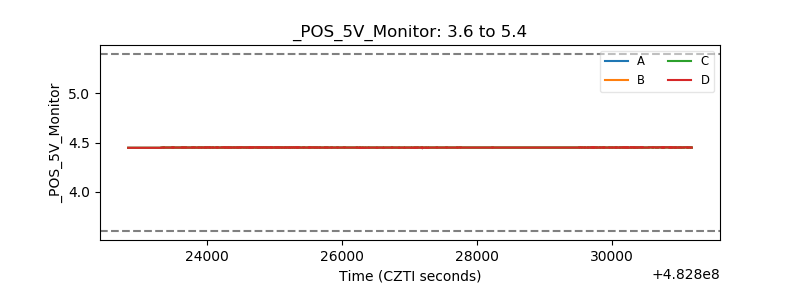 |
| _ROLL_ROT | 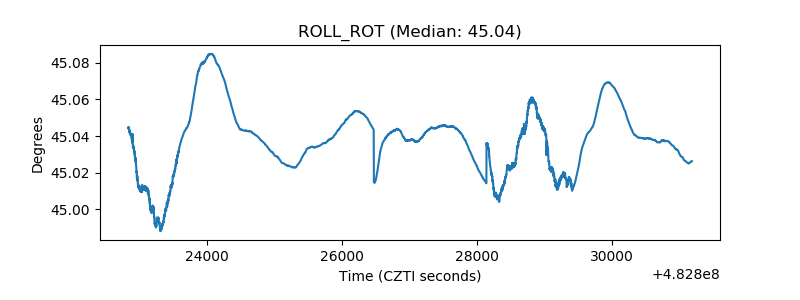 |
| _Roll_DEC | 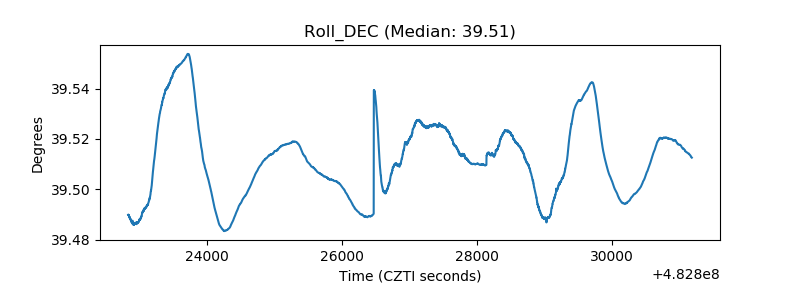 |
| _Roll_RA | 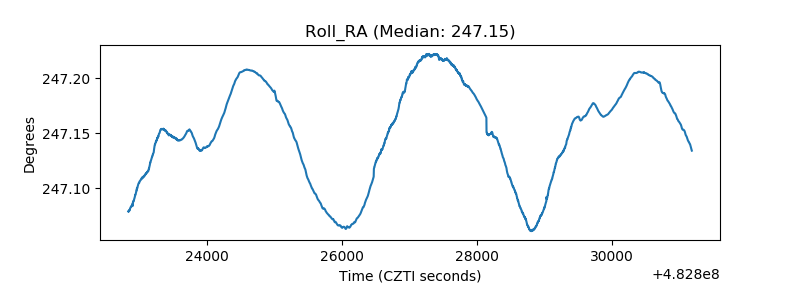 |
| Veto Counter | 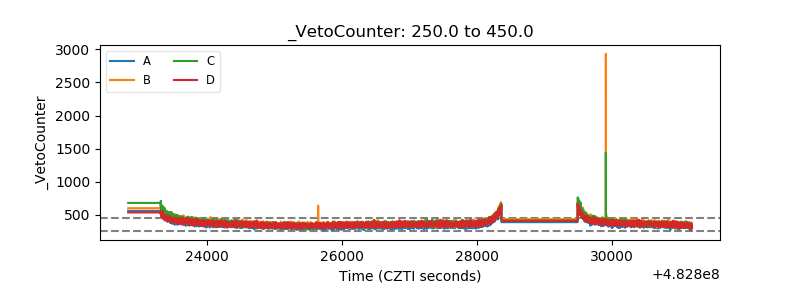 |