| Param | Original file | Final file |
|---|---|---|
| Filename | modeM0/AS1A13_031T01_9000006462_51714cztM0_level2.fits | modeM0/AS1A13_031T01_9000006462_51714cztM0_level2_quad_clean.evt |
| Size (bytes) | 1,310,342,400 | 226,975,680 |
| Size | 1.2 GB | 216.5 MB |
| Events in quadrant A | 14,381,153 | 1,443,009 |
| Events in quadrant B | 10,813,850 | 1,619,104 |
| Events in quadrant C | 13,490,143 | 1,322,327 |
| Events in quadrant D | 8,577,979 | 1,378,936 |
| Mode M9 | |||
|---|---|---|---|
| Quadrant | BADHDUFLAG | Total packets | Discarded packets |
| A | 0 | 33 | 0 |
| B | 0 | 33 | 0 |
| C | 0 | 33 | 0 |
| D | 0 | 33 | 0 |
| Mode M0 | |||
|---|---|---|---|
| Quadrant | BADHDUFLAG | Total packets | Discarded packets |
| A | 0 | 53760 | 3 |
| B | 0 | 43064 | 3 |
| C | 0 | 51381 | 3 |
| D | 0 | 36816 | 3 |
| Mode SS | |||
|---|---|---|---|
| Quadrant | BADHDUFLAG | Total packets | Discarded packets |
| A | 0 | 330 | 0 |
| B | 0 | 330 | 0 |
| C | 0 | 330 | 0 |
| D | 0 | 330 | 0 |
| Quadrant | Total seconds | Saturated seconds | Saturation percentage |
|---|---|---|---|
| A | 16067 | 1316 | 8.190701% |
| B | 16067 | 910 | 5.663783% |
| C | 16066 | 1897 | 11.807544% |
| D | 16066 | 256 | 1.593427% |
Noise dominated data is calculated using 1-second bins in cleaned event files. If a bin has >2000 counts, and if more than 50% of those come from <1% of pixels, then it is considered to be noise-dominated and hence unusable.
| Quadrant | # 1 sec bins | Bins with >0 counts | Bins with >2000 counts | High rate bins dominated by noise | Noise dominated (total time) | Noise dominated (detector-on time) | Marked lightcurve |
|---|---|---|---|---|---|---|---|
| A | 19437 | 16069 | 915 | 915 | 4.71% | 5.69% | 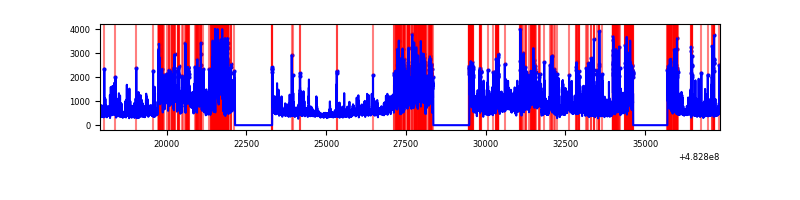 |
| B | 19437 | 16070 | 480 | 480 | 2.47% | 2.99% | 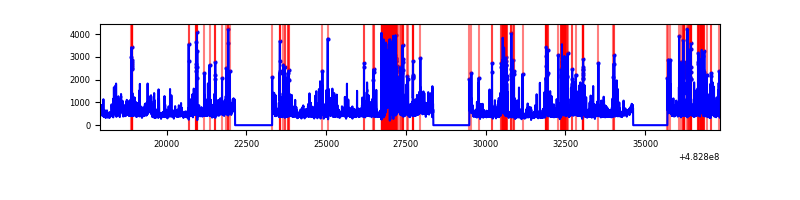 |
| C | 19436 | 16068 | 1413 | 1413 | 7.27% | 8.79% | 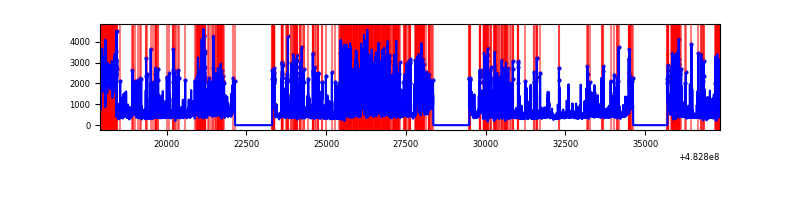 |
| D | 19436 | 16069 | 149 | 149 | 0.77% | 0.93% | 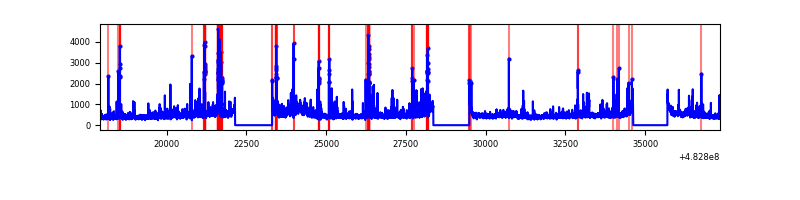 |
Top three noisy pixels from each quadrant. If the there are fewer than three noisy pixels in the level2.evt file, extra rows are filled as -1
| Pixel properties | Quadrant properties | ||||||
|---|---|---|---|---|---|---|---|
| Quadrant | DetID | PixID | Counts | Sigma | Mean | Median | Sigma |
| A | 3 | 78 | 3156469 | 7628.86 | 1698 | 1658 | 413.5 |
| A | 3 | 14 | 2406845 | 5816.15 | 1698 | 1658 | 413.5 |
| A | 12 | 3 | 1122524 | 2710.44 | 1698 | 1658 | 413.5 |
| B | 1 | 223 | 1245796 | 3429.11 | 1705 | 1641 | 362.8 |
| B | 10 | 254 | 718491 | 1975.77 | 1705 | 1641 | 362.8 |
| B | 8 | 128 | 525871 | 1444.87 | 1705 | 1641 | 362.8 |
| C | 12 | 254 | 1916585 | 4332.91 | 1628 | 1615 | 442.0 |
| C | 9 | 38 | 1576396 | 3563.18 | 1628 | 1615 | 442.0 |
| C | 15 | 231 | 1107446 | 2502.11 | 1628 | 1615 | 442.0 |
| D | 3 | 12 | 447751 | 953.81 | 1689 | 1627 | 467.7 |
| D | 5 | 157 | 338451 | 720.12 | 1689 | 1627 | 467.7 |
| D | 8 | 176 | 178237 | 377.59 | 1689 | 1627 | 467.7 |
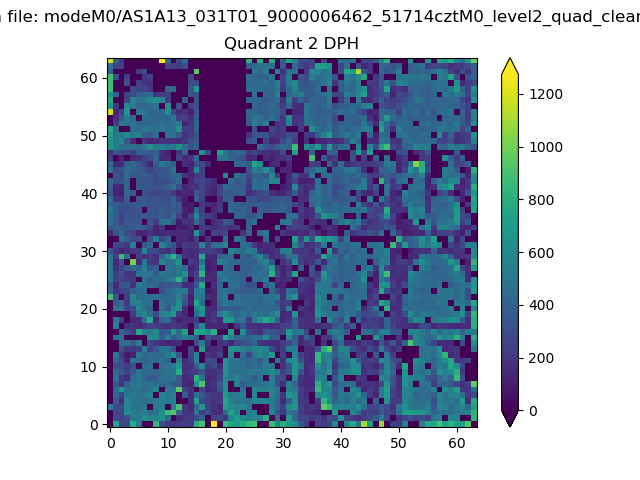
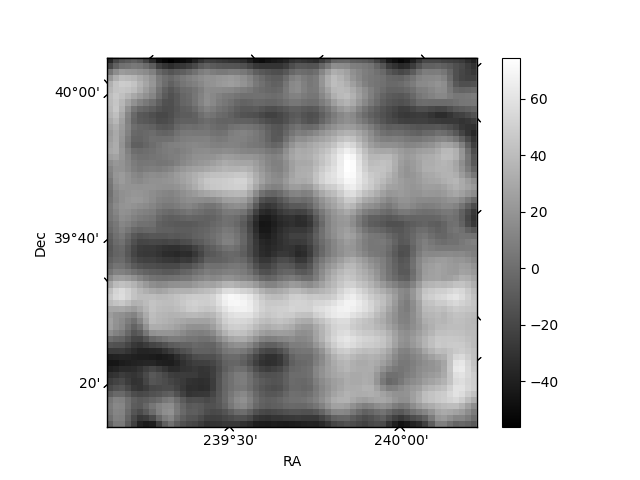
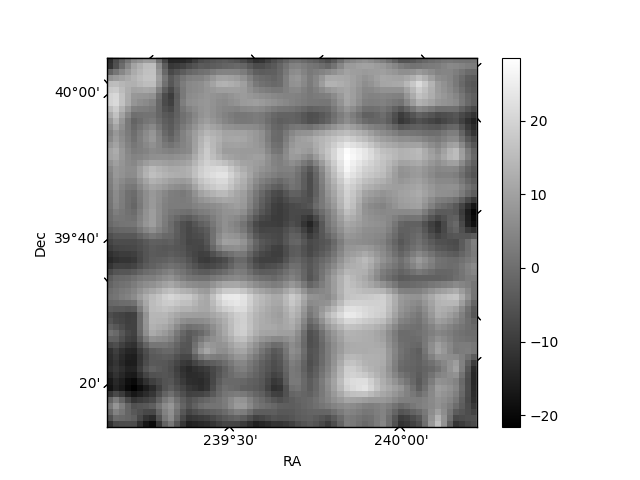
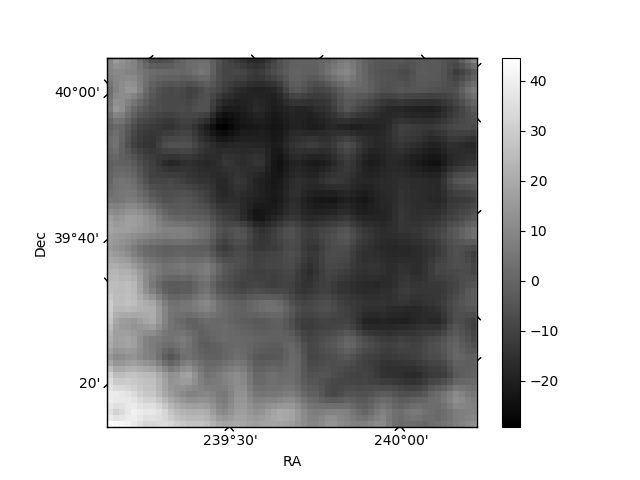
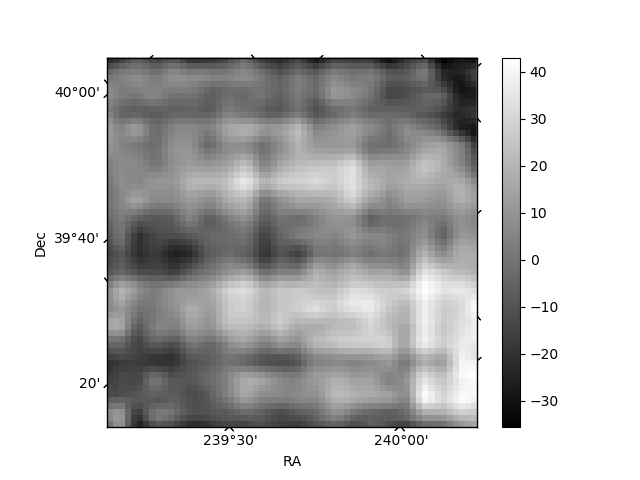
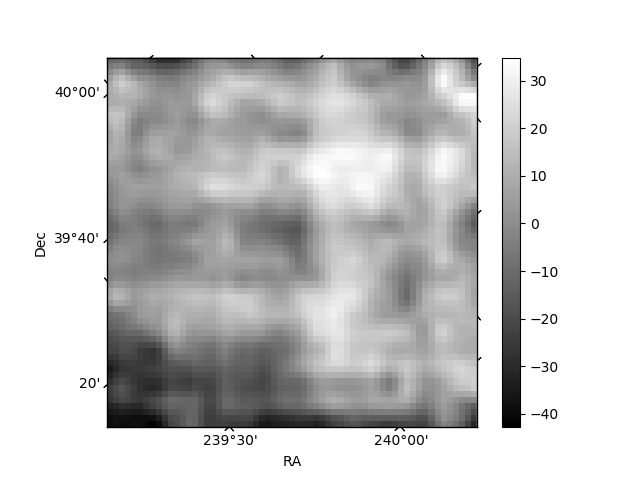
Histogram calculated using DETX and DETY for each event in the final _common_clean file
| Quadrant A | 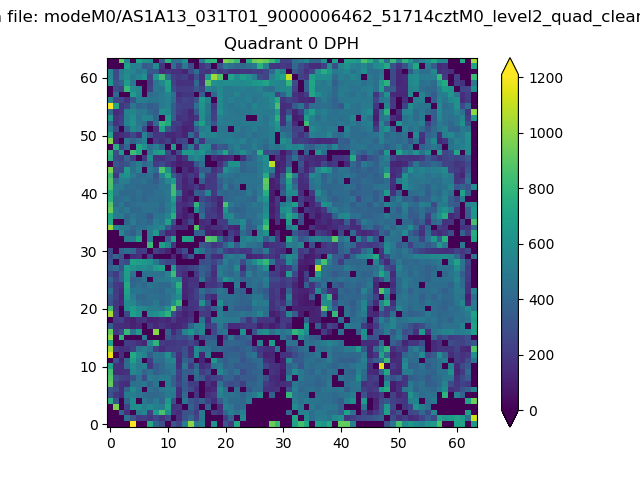 |
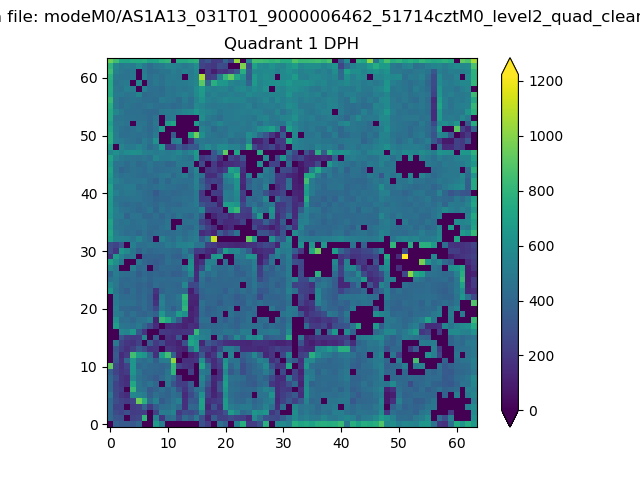 |
Quadrant B |
|---|---|---|---|
| Quadrant D | 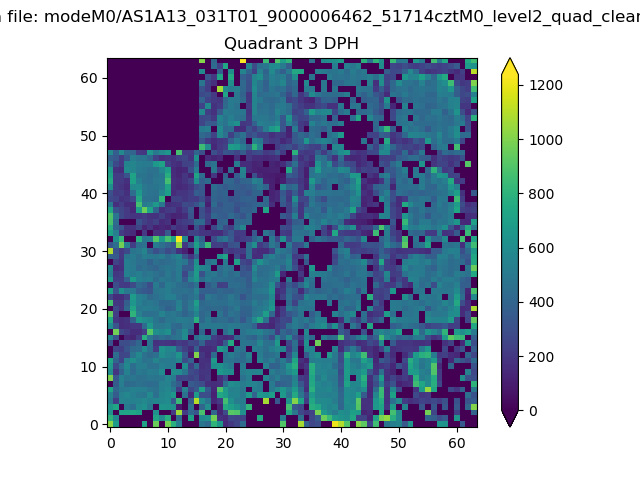 |
 |
Quadrant C |
| Plot type | Count rate plots | Images |
|---|---|---|
| Comparison with Poisson distribution Blue bars denote a histogram of data divided into 1 sec bins. Red curve is a Poisson curve with rate = median count rate of data. |
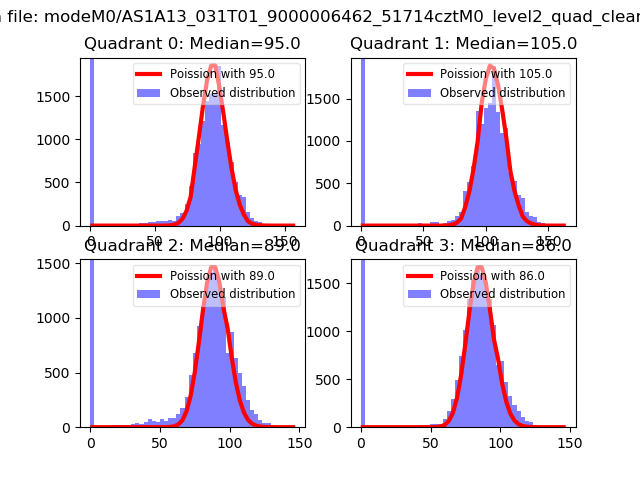 |
 |
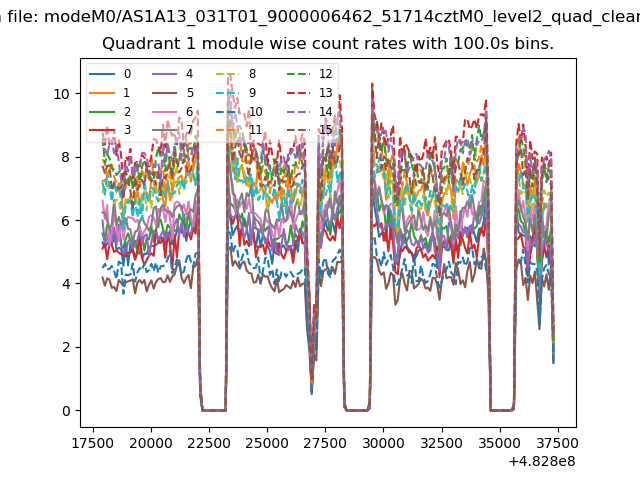
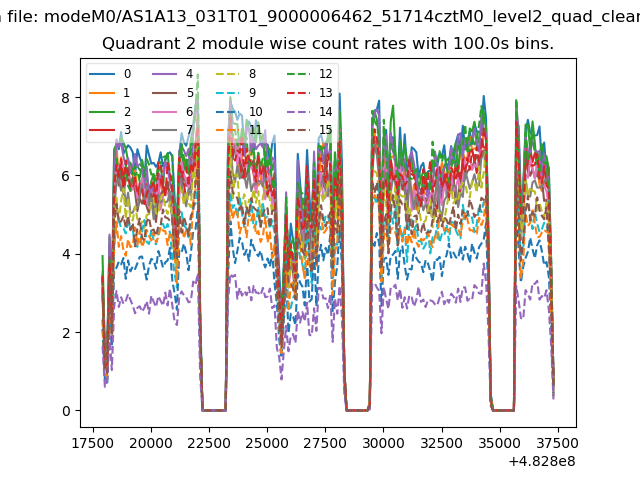
| Quadrant-wise count rates Data is divided into 100 sec bins |
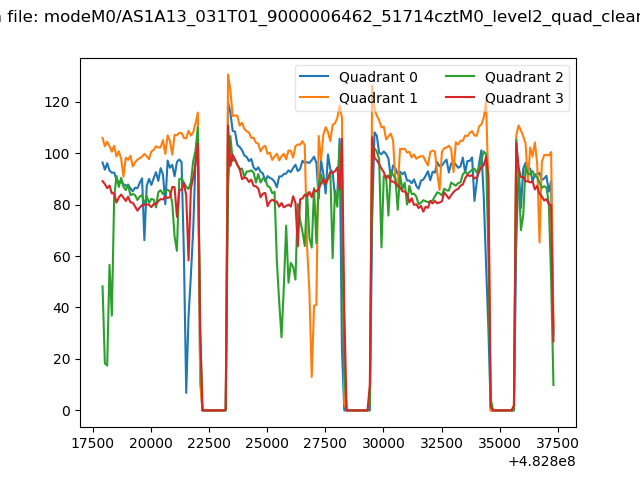 |
|
| Module-wise count rates for Quadrant A Data is divided into 100 sec bins |
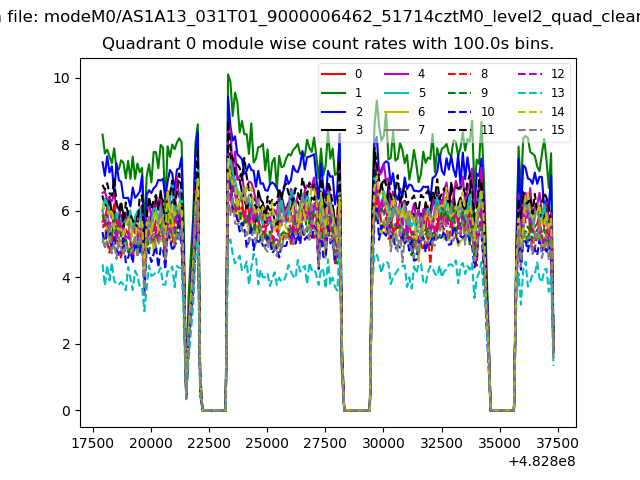 |
 |
| Module-wise count rates for Quadrant B Data is divided into 100 sec bins |
 |
 |
| Module-wise count rates for Quadrant C Data is divided into 100 sec bins |
 |
 |
| Module-wise count rates for Quadrant D Data is divided into 100 sec bins |
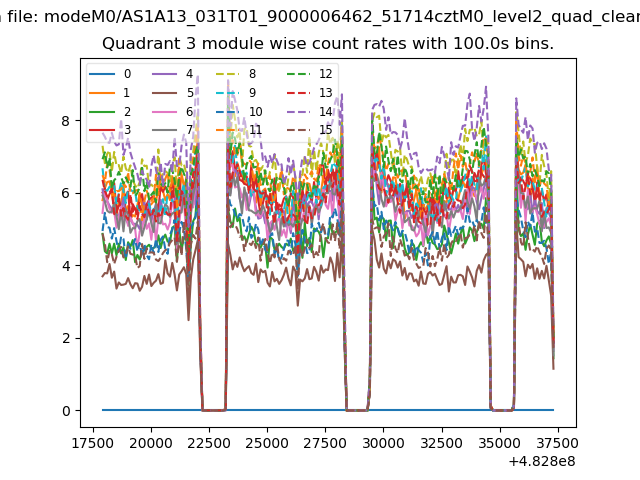 |
 |
| Parameter | Plot |
|---|---|
| CZT HV Monitor | 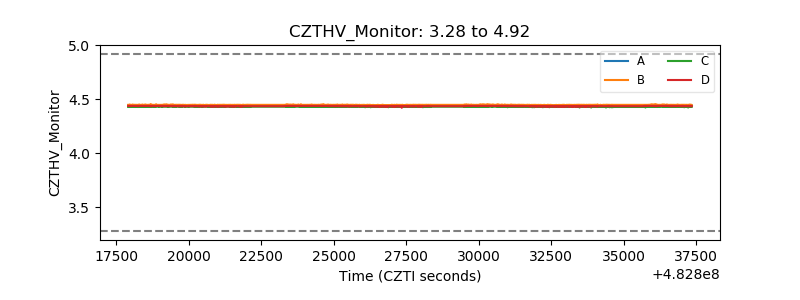 |
| D_VDD | 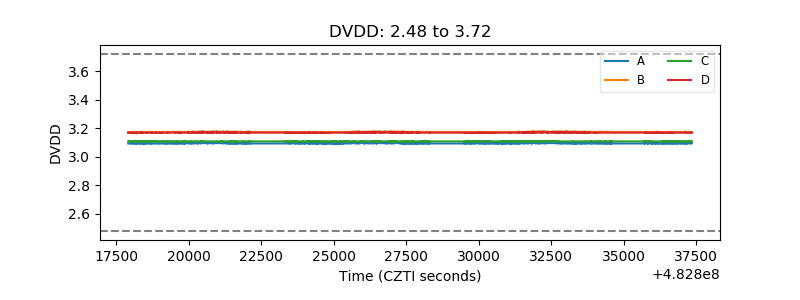 |
| Temperature 1 | 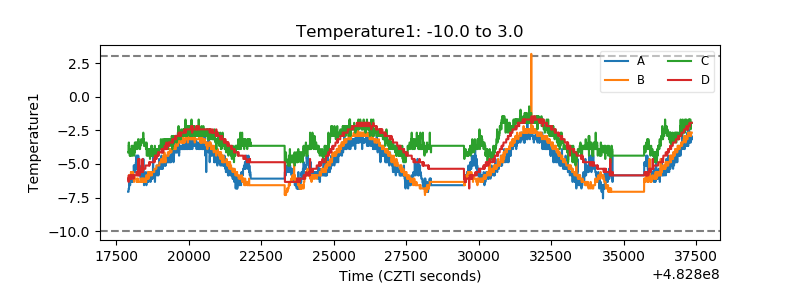 |
| Veto HV Monitor |  |
| Veto LLD | 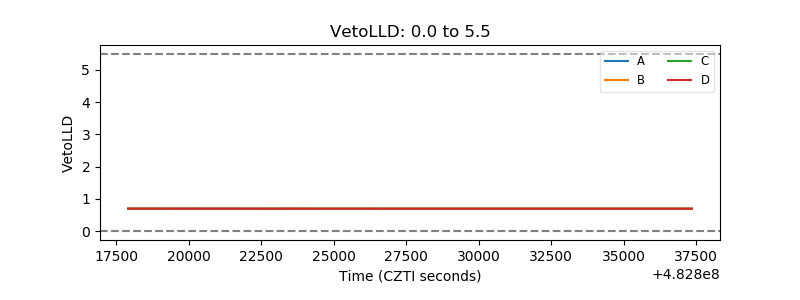 |
| Alpha Counter | 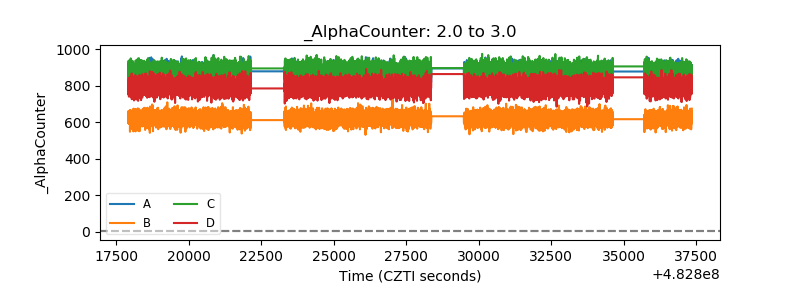 |
| _CPM_Rate | 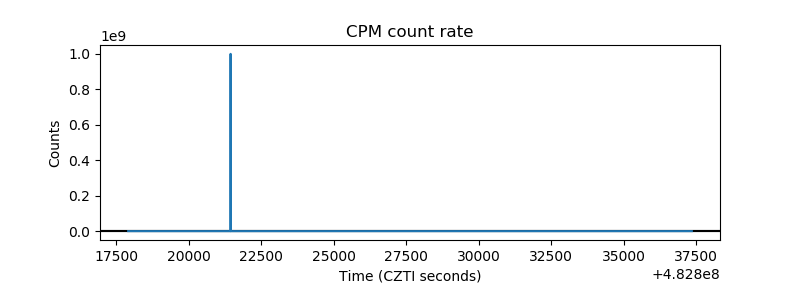 |
| CZT Counter | 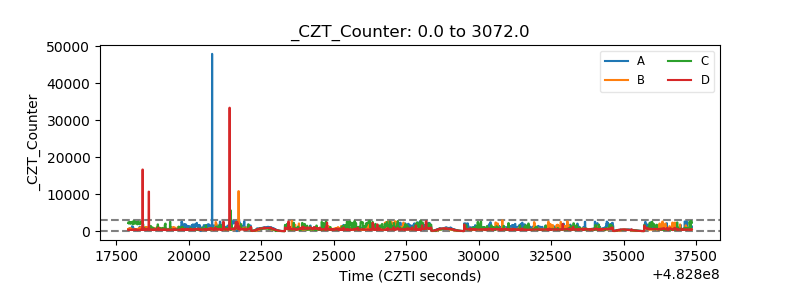 |
| +2.5 Volts monitor | 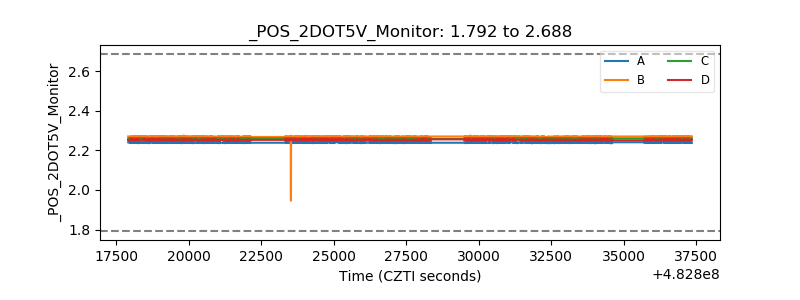 |
| +5 Volts monitor | 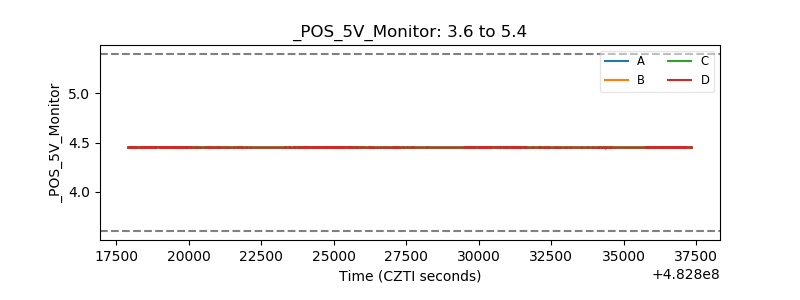 |
| _ROLL_ROT | 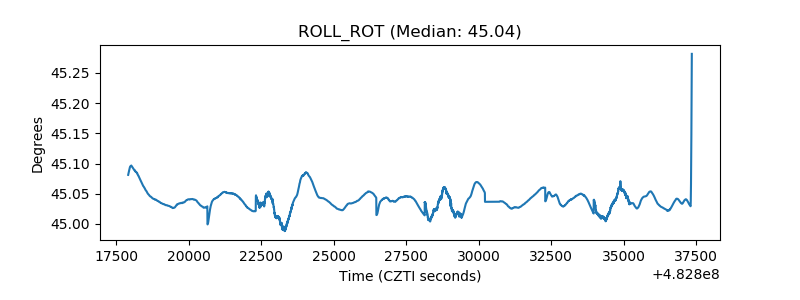 |
| _Roll_DEC | 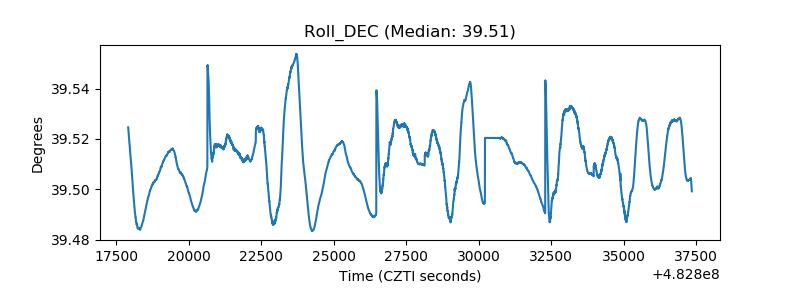 |
| _Roll_RA | 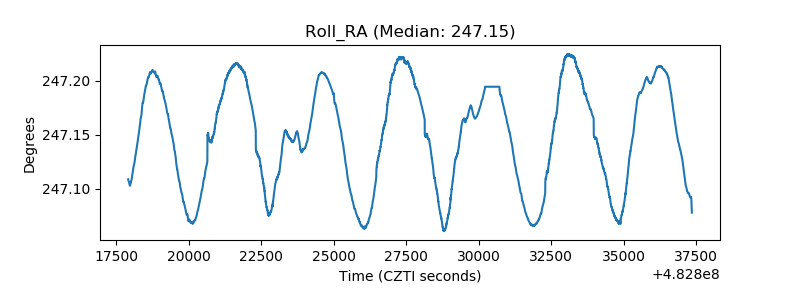 |
| Veto Counter | 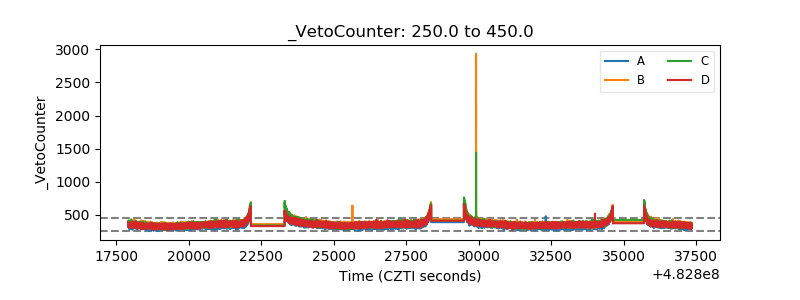 |