| Param | Original file | Final file |
|---|---|---|
| Filename | modeM0/AS1A13_031T01_9000006462_51715cztM0_level2.fits | modeM0/AS1A13_031T01_9000006462_51715cztM0_level2_quad_clean.evt |
| Size (bytes) | 584,251,200 | 91,975,680 |
| Size | 557.2 MB | 87.7 MB |
| Events in quadrant A | 7,610,170 | 518,444 |
| Events in quadrant B | 4,602,350 | 652,994 |
| Events in quadrant C | 5,560,570 | 574,469 |
| Events in quadrant D | 3,332,322 | 570,168 |
| Mode M9 | |||
|---|---|---|---|
| Quadrant | BADHDUFLAG | Total packets | Discarded packets |
| A | 0 | 8 | 0 |
| B | 0 | 8 | 0 |
| C | 0 | 8 | 0 |
| D | 0 | 8 | 0 |
| Mode M0 | |||
|---|---|---|---|
| Quadrant | BADHDUFLAG | Total packets | Discarded packets |
| A | 0 | 27190 | 2 |
| B | 0 | 18254 | 1 |
| C | 0 | 21258 | 1 |
| D | 0 | 14731 | 1 |
| Mode SS | |||
|---|---|---|---|
| Quadrant | BADHDUFLAG | Total packets | Discarded packets |
| A | 0 | 138 | 0 |
| B | 0 | 138 | 0 |
| C | 0 | 138 | 0 |
| D | 0 | 138 | 0 |
| Quadrant | Total seconds | Saturated seconds | Saturation percentage |
|---|---|---|---|
| A | 6718 | 1453 | 21.628461% |
| B | 6719 | 513 | 7.635065% |
| C | 6719 | 659 | 9.808007% |
| D | 6719 | 145 | 2.158059% |
Noise dominated data is calculated using 1-second bins in cleaned event files. If a bin has >2000 counts, and if more than 50% of those come from <1% of pixels, then it is considered to be noise-dominated and hence unusable.
| Quadrant | # 1 sec bins | Bins with >0 counts | Bins with >2000 counts | High rate bins dominated by noise | Noise dominated (total time) | Noise dominated (detector-on time) | Marked lightcurve |
|---|---|---|---|---|---|---|---|
| A | 7513 | 6719 | 1103 | 1103 | 14.68% | 16.42% | 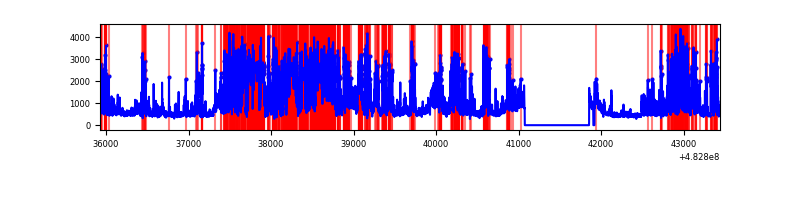 |
| B | 7514 | 6721 | 222 | 222 | 2.95% | 3.30% | 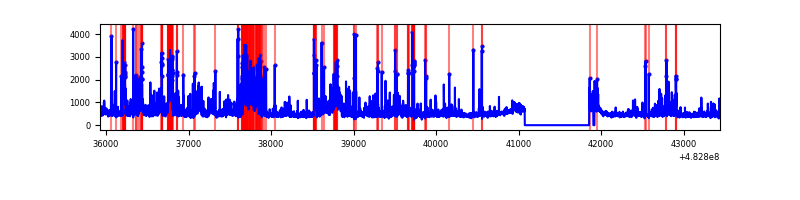 |
| C | 7514 | 6721 | 420 | 420 | 5.59% | 6.25% | 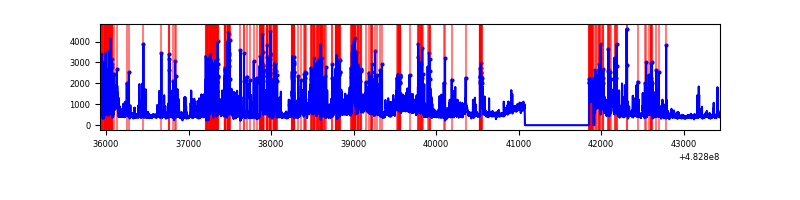 |
| D | 7514 | 6720 | 12 | 12 | 0.16% | 0.18% | 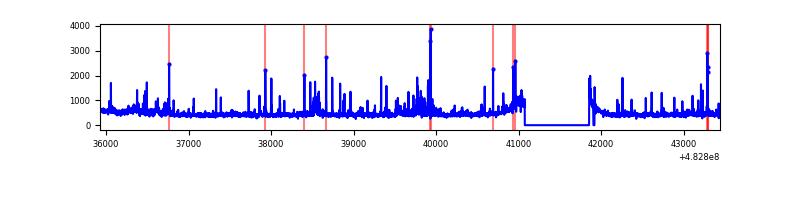 |
Top three noisy pixels from each quadrant. If the there are fewer than three noisy pixels in the level2.evt file, extra rows are filled as -1
| Pixel properties | Quadrant properties | ||||||
|---|---|---|---|---|---|---|---|
| Quadrant | DetID | PixID | Counts | Sigma | Mean | Median | Sigma |
| A | 3 | 78 | 4133861 | 25121.55 | 671 | 654 | 164.5 |
| A | 12 | 3 | 239850 | 1453.83 | 671 | 654 | 164.5 |
| A | 3 | 14 | 139299 | 842.68 | 671 | 654 | 164.5 |
| B | 5 | 173 | 817560 | 5245.53 | 717 | 690 | 155.7 |
| B | 8 | 128 | 183962 | 1176.88 | 717 | 690 | 155.7 |
| B | 6 | 51 | 159912 | 1022.44 | 717 | 690 | 155.7 |
| C | 12 | 254 | 964306 | 5146.14 | 691 | 687 | 187.3 |
| C | 15 | 231 | 665005 | 3547.75 | 691 | 687 | 187.3 |
| C | 9 | 38 | 433131 | 2309.44 | 691 | 687 | 187.3 |
| D | 8 | 176 | 137755 | 692.22 | 716 | 690 | 198.0 |
| D | 3 | 12 | 74565 | 373.09 | 716 | 690 | 198.0 |
| D | 5 | 157 | 66744 | 333.59 | 716 | 690 | 198.0 |
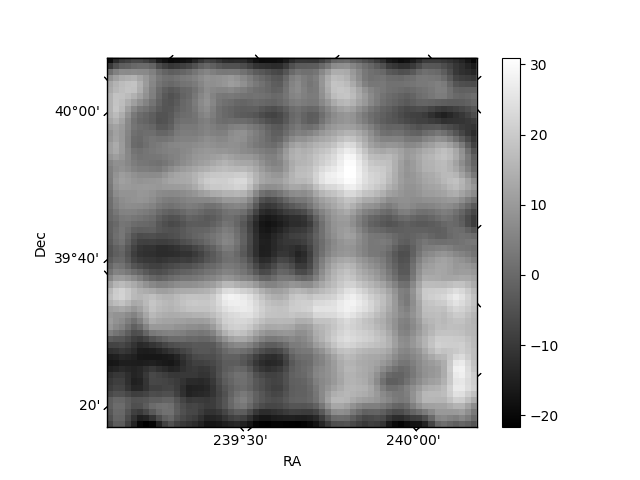
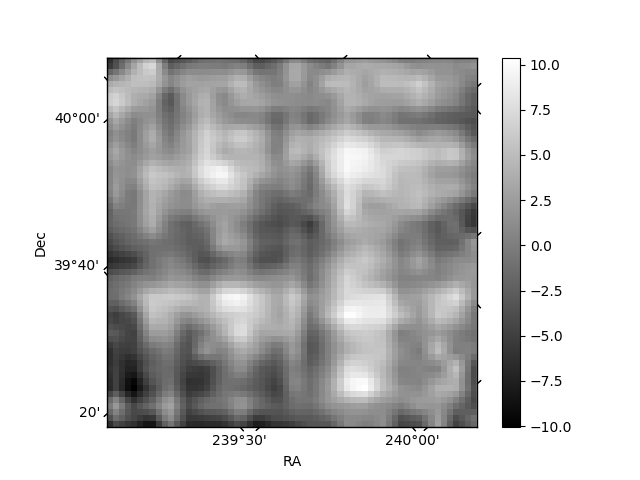
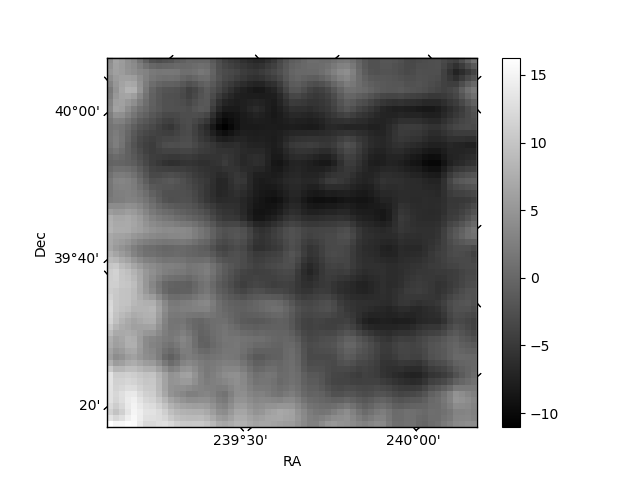
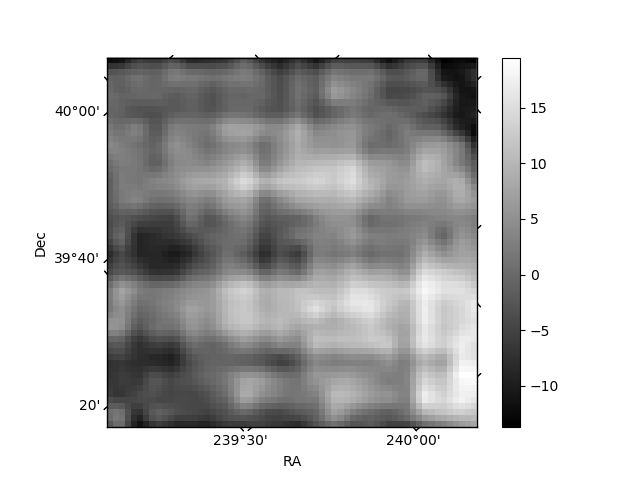
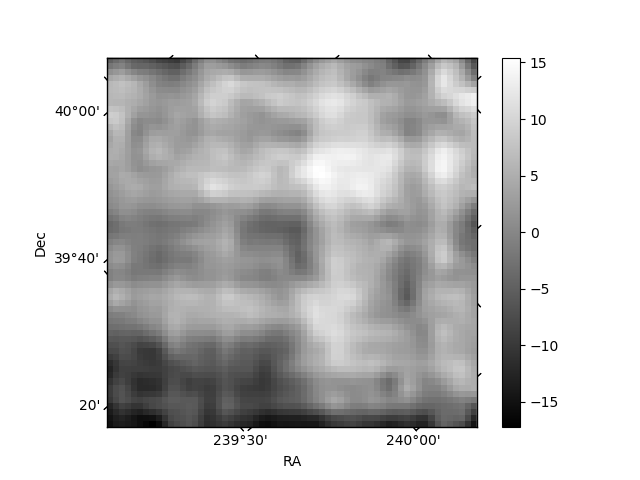
Histogram calculated using DETX and DETY for each event in the final _common_clean file
| Quadrant A | 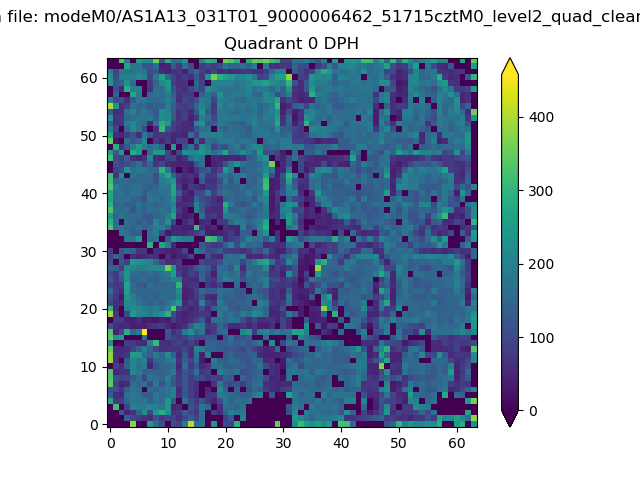 |
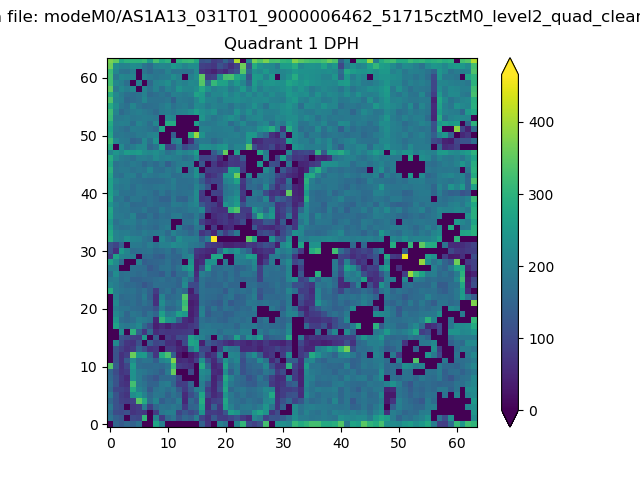 |
Quadrant B |
|---|---|---|---|
| Quadrant D | 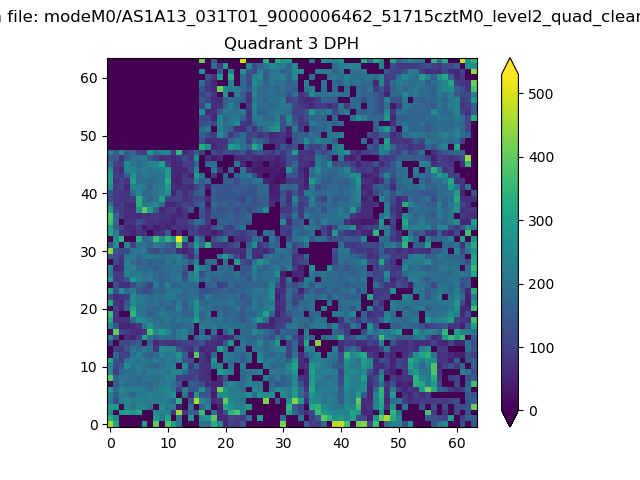 |
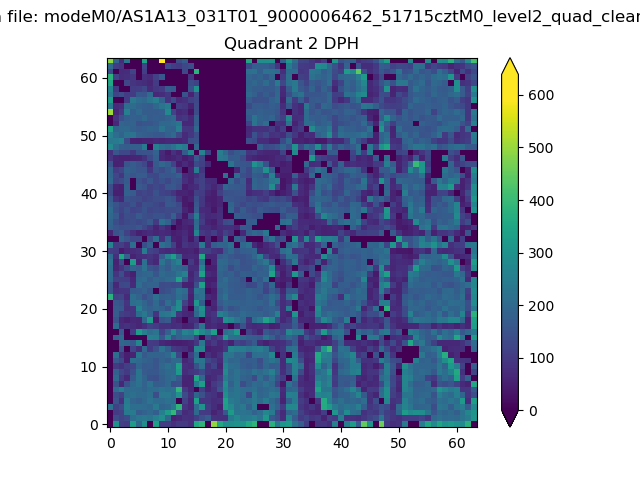 |
Quadrant C |
| Plot type | Count rate plots | Images |
|---|---|---|
| Comparison with Poisson distribution Blue bars denote a histogram of data divided into 1 sec bins. Red curve is a Poisson curve with rate = median count rate of data. |
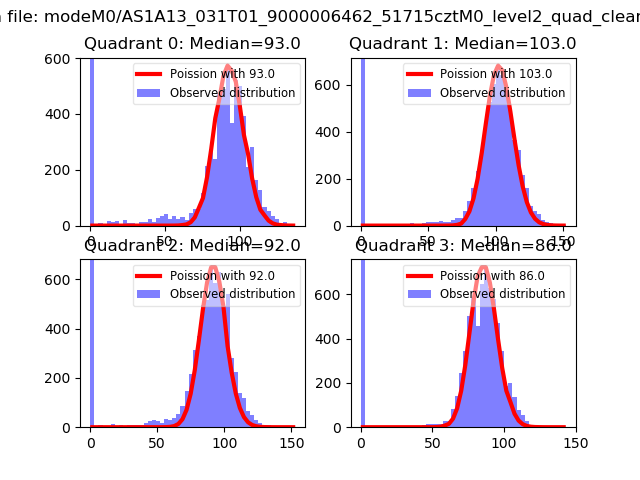 |
 |
| Quadrant-wise count rates Data is divided into 100 sec bins |
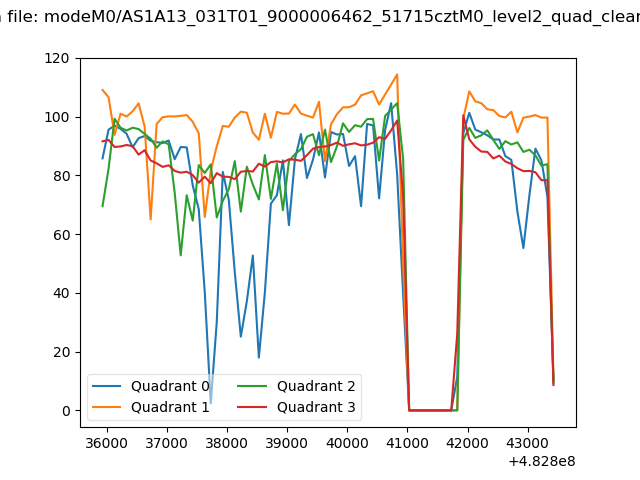 |
|
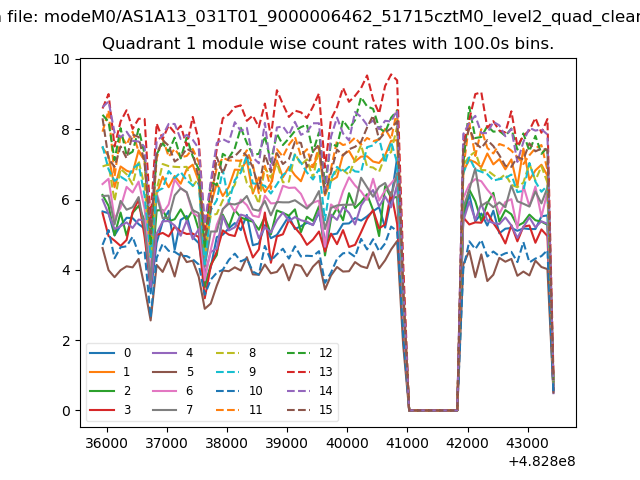
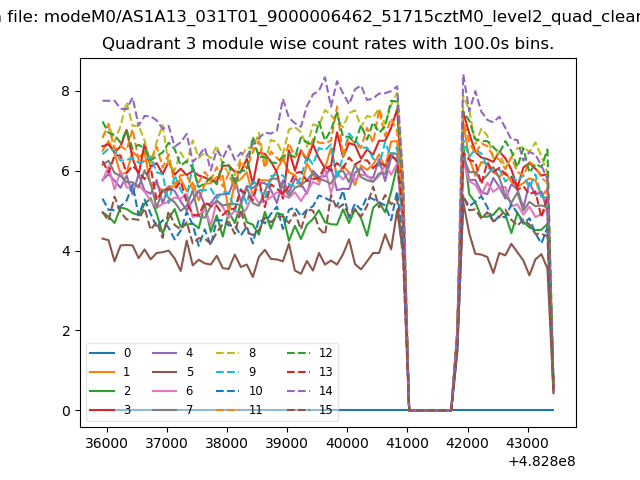
| Module-wise count rates for Quadrant A Data is divided into 100 sec bins |
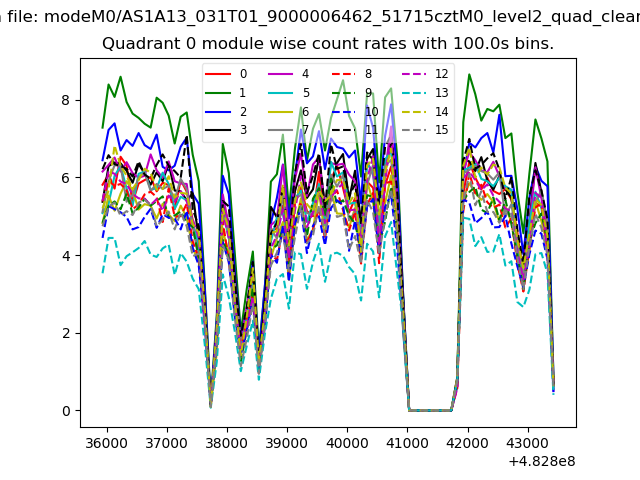 |
 |
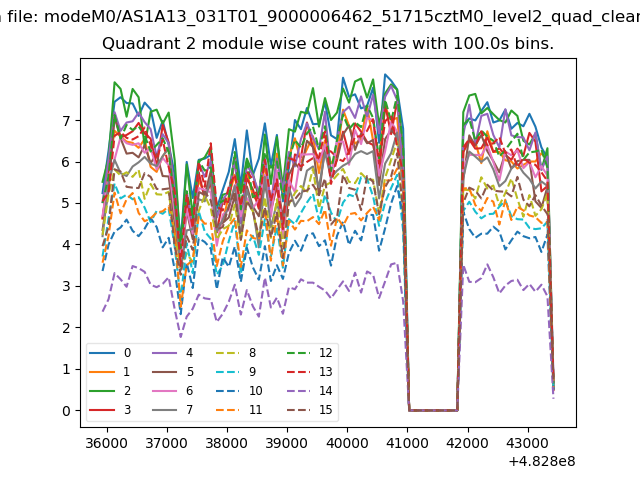
| Module-wise count rates for Quadrant B Data is divided into 100 sec bins |
 |
 |
| Module-wise count rates for Quadrant C Data is divided into 100 sec bins |
 |
 |
| Module-wise count rates for Quadrant D Data is divided into 100 sec bins |
 |
 |
| Parameter | Plot |
|---|---|
| CZT HV Monitor | 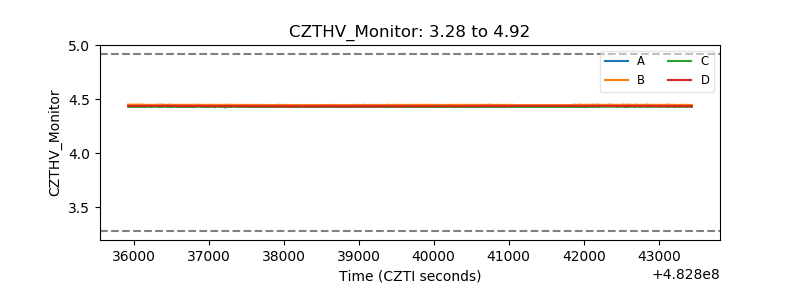 |
| D_VDD | 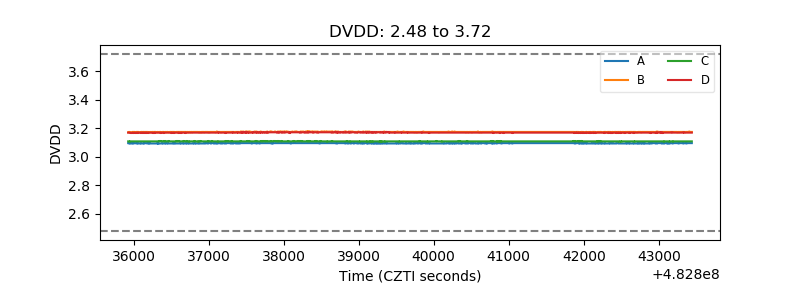 |
| Temperature 1 | 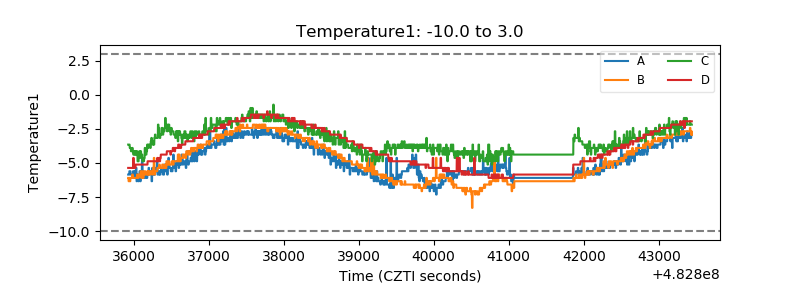 |
| Veto HV Monitor | 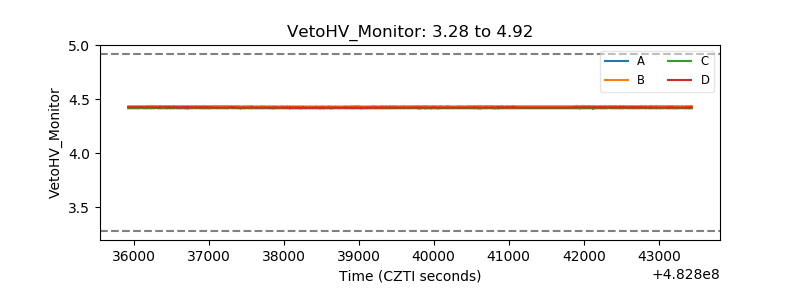 |
| Veto LLD | 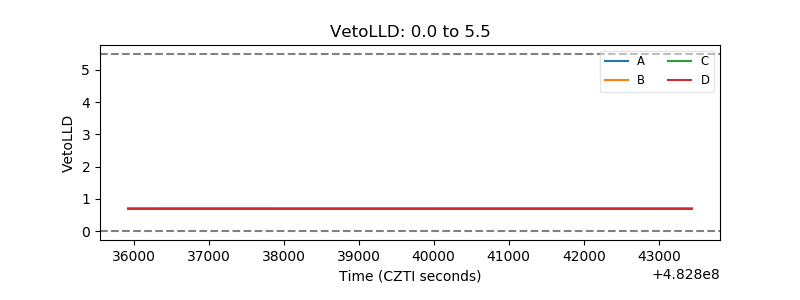 |
| Alpha Counter | 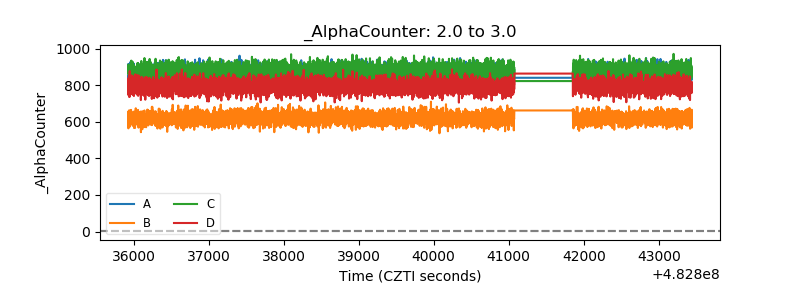 |
| _CPM_Rate | 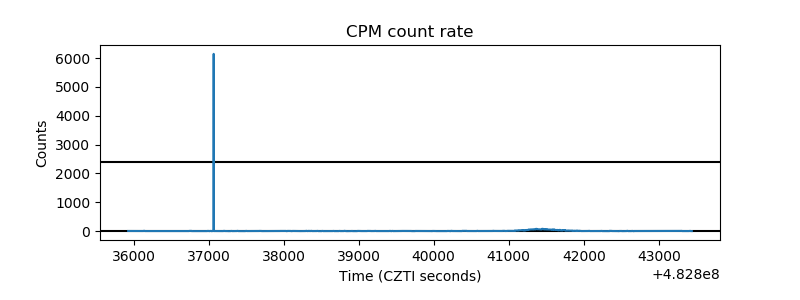 |
| CZT Counter | 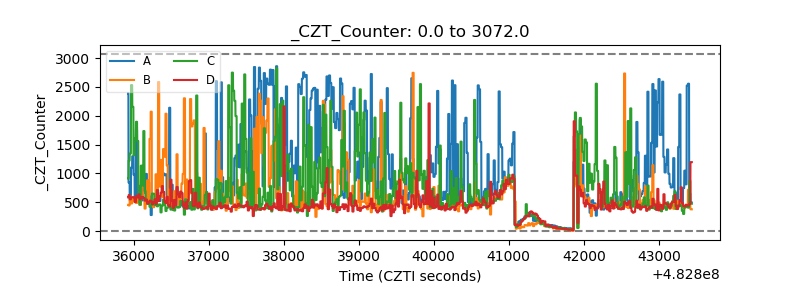 |
| +2.5 Volts monitor | 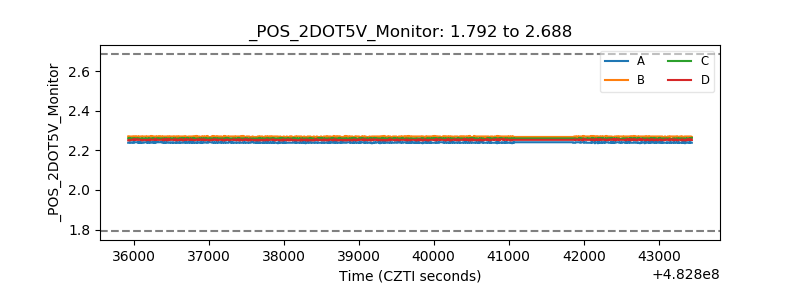 |
| +5 Volts monitor | 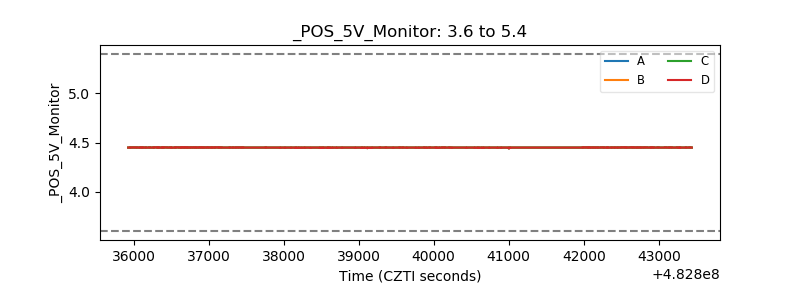 |
| _ROLL_ROT | 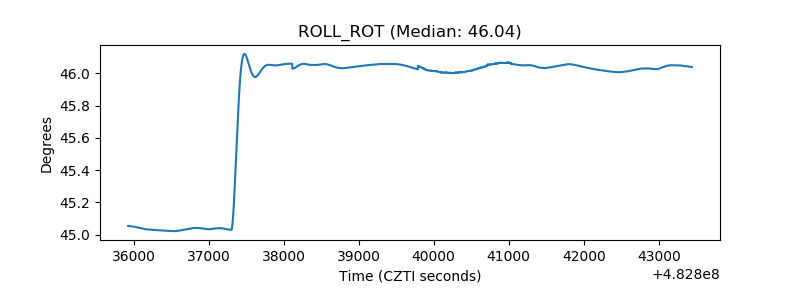 |
| _Roll_DEC | 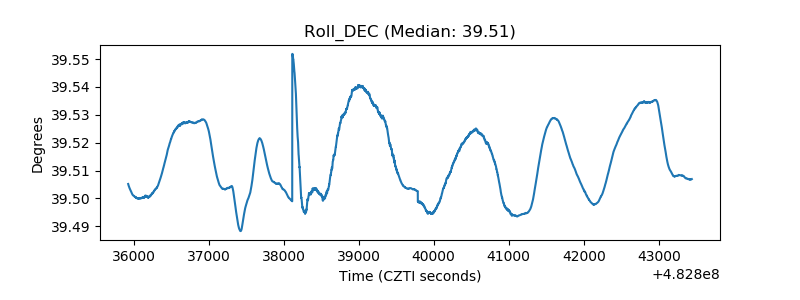 |
| _Roll_RA | 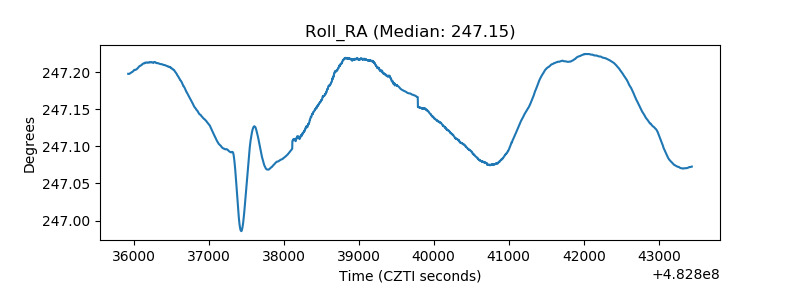 |
| Veto Counter | 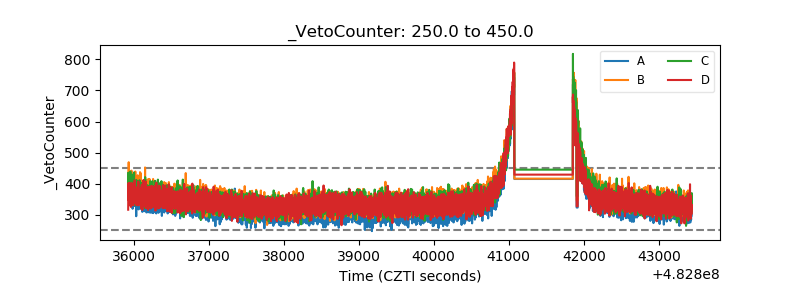 |