| Param | Original file | Final file |
|---|---|---|
| Filename | modeM0/AS1A13_031T01_9000006462_51716cztM0_level2.fits | modeM0/AS1A13_031T01_9000006462_51716cztM0_level2_quad_clean.evt |
| Size (bytes) | 550,851,840 | 105,756,480 |
| Size | 525.3 MB | 100.9 MB |
| Events in quadrant A | 6,523,368 | 650,439 |
| Events in quadrant B | 4,062,969 | 742,890 |
| Events in quadrant C | 5,588,255 | 644,035 |
| Events in quadrant D | 3,626,041 | 636,360 |
| Mode M9 | |||
|---|---|---|---|
| Quadrant | BADHDUFLAG | Total packets | Discarded packets |
| A | 0 | 9 | 0 |
| B | 0 | 10 | 0 |
| C | 0 | 10 | 0 |
| D | 0 | 10 | 0 |
| Mode M0 | |||
|---|---|---|---|
| Quadrant | BADHDUFLAG | Total packets | Discarded packets |
| A | 0 | 24574 | 3 |
| B | 0 | 17450 | 2 |
| C | 0 | 21992 | 2 |
| D | 0 | 16387 | 2 |
| Mode SS | |||
|---|---|---|---|
| Quadrant | BADHDUFLAG | Total packets | Discarded packets |
| A | 0 | 154 | 0 |
| B | 0 | 154 | 0 |
| C | 0 | 154 | 0 |
| D | 0 | 154 | 0 |
| Quadrant | Total seconds | Saturated seconds | Saturation percentage |
|---|---|---|---|
| A | 7596 | 842 | 11.084781% |
| B | 7596 | 419 | 5.516061% |
| C | 7596 | 672 | 8.846761% |
| D | 7596 | 211 | 2.777778% |
Noise dominated data is calculated using 1-second bins in cleaned event files. If a bin has >2000 counts, and if more than 50% of those come from <1% of pixels, then it is considered to be noise-dominated and hence unusable.
| Quadrant | # 1 sec bins | Bins with >0 counts | Bins with >2000 counts | High rate bins dominated by noise | Noise dominated (total time) | Noise dominated (detector-on time) | Marked lightcurve |
|---|---|---|---|---|---|---|---|
| A | 7906 | 7598 | 410 | 410 | 5.19% | 5.40% | 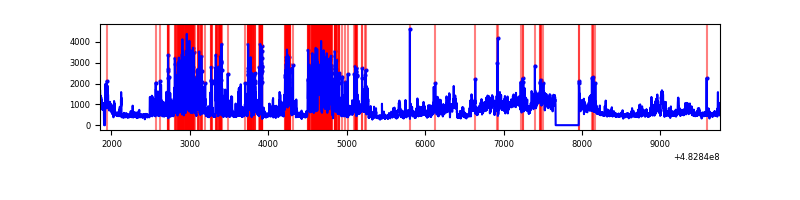 |
| B | 7906 | 7598 | 44 | 44 | 0.56% | 0.58% | 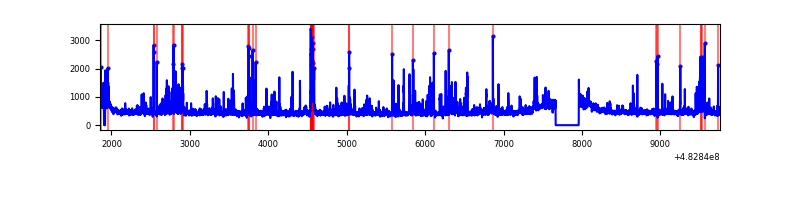 |
| C | 7906 | 7598 | 354 | 354 | 4.48% | 4.66% | 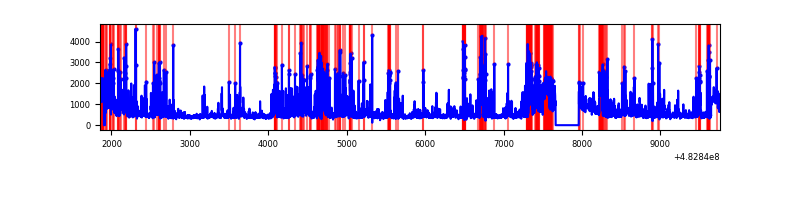 |
| D | 7906 | 7598 | 13 | 13 | 0.16% | 0.17% | 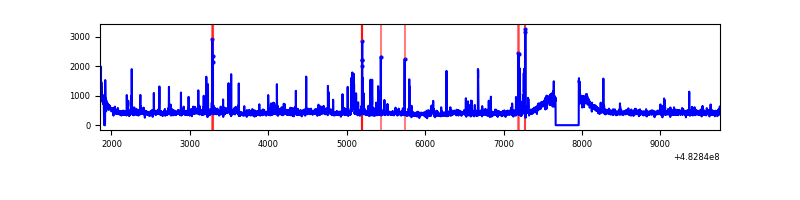 |
Top three noisy pixels from each quadrant. If the there are fewer than three noisy pixels in the level2.evt file, extra rows are filled as -1
| Pixel properties | Quadrant properties | ||||||
|---|---|---|---|---|---|---|---|
| Quadrant | DetID | PixID | Counts | Sigma | Mean | Median | Sigma |
| A | 3 | 78 | 1734358 | 8731.3 | 823 | 801 | 198.5 |
| A | 12 | 3 | 930310 | 4681.6 | 823 | 801 | 198.5 |
| A | 3 | 14 | 155622 | 779.78 | 823 | 801 | 198.5 |
| B | 1 | 223 | 242475 | 1346.24 | 832 | 798 | 179.5 |
| B | 8 | 128 | 116419 | 644.05 | 832 | 798 | 179.5 |
| B | 0 | 213 | 99616 | 550.46 | 832 | 798 | 179.5 |
| C | 15 | 231 | 713332 | 3349.24 | 789 | 784 | 212.7 |
| C | 12 | 254 | 531434 | 2494.25 | 789 | 784 | 212.7 |
| C | 0 | 192 | 308319 | 1445.53 | 789 | 784 | 212.7 |
| D | 12 | 218 | 62557 | 271.14 | 828 | 800 | 227.8 |
| D | 5 | 173 | 55000 | 237.96 | 828 | 800 | 227.8 |
| D | 6 | 228 | 54585 | 236.14 | 828 | 800 | 227.8 |
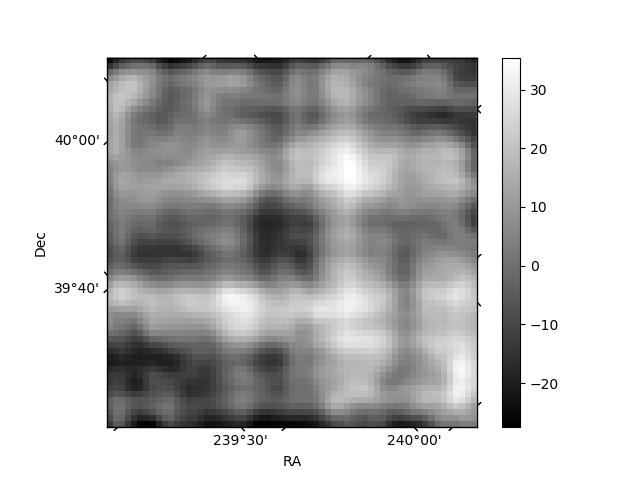
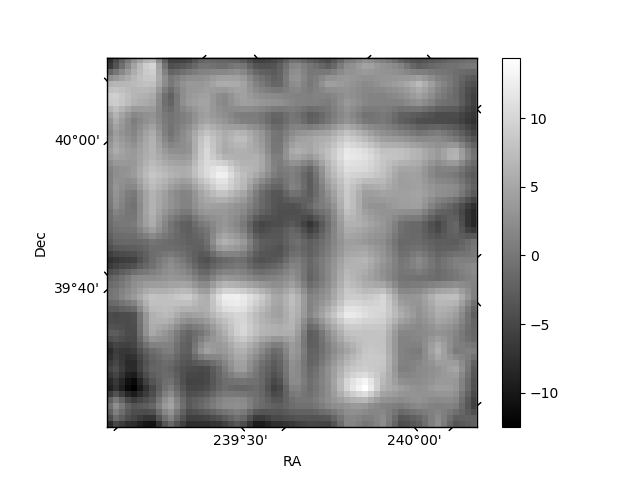
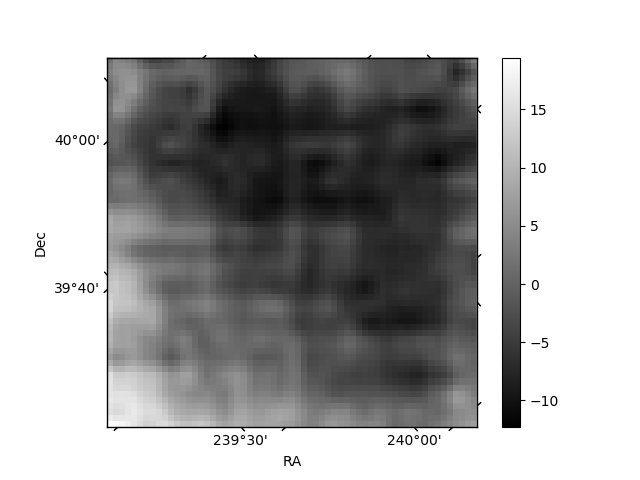
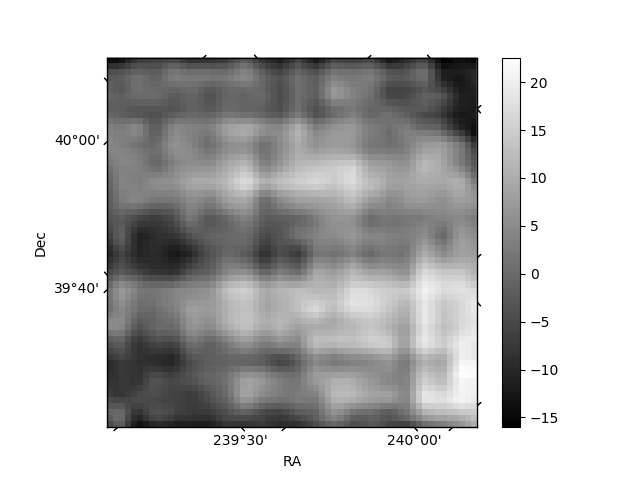
Histogram calculated using DETX and DETY for each event in the final _common_clean file
| Quadrant A | 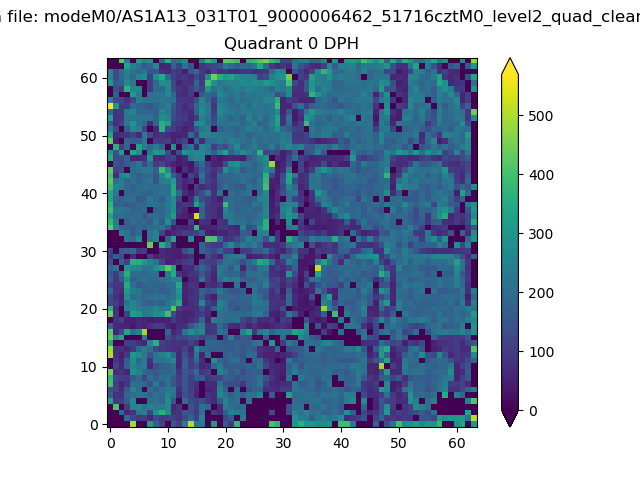 |
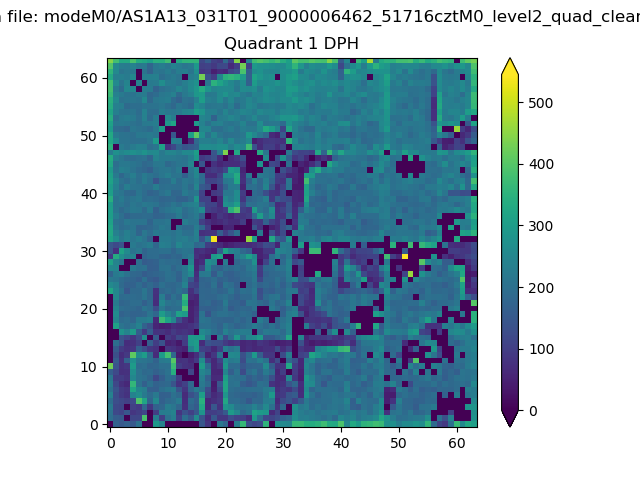 |
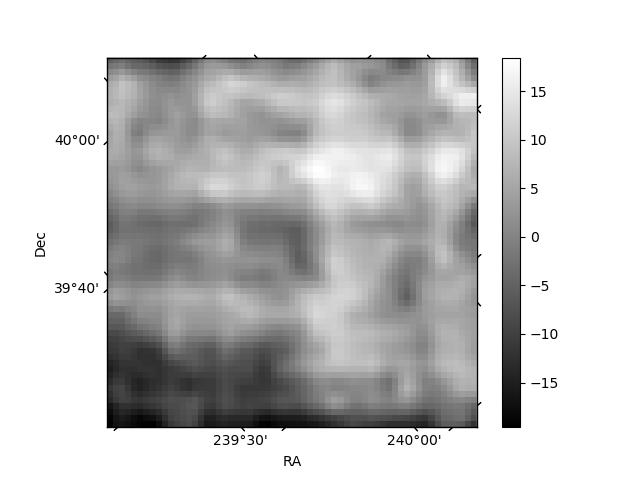
Quadrant B |
|---|---|---|---|
| Quadrant D | 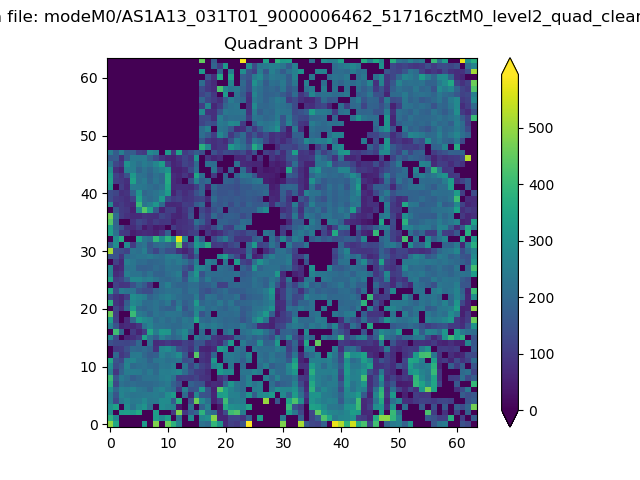 |
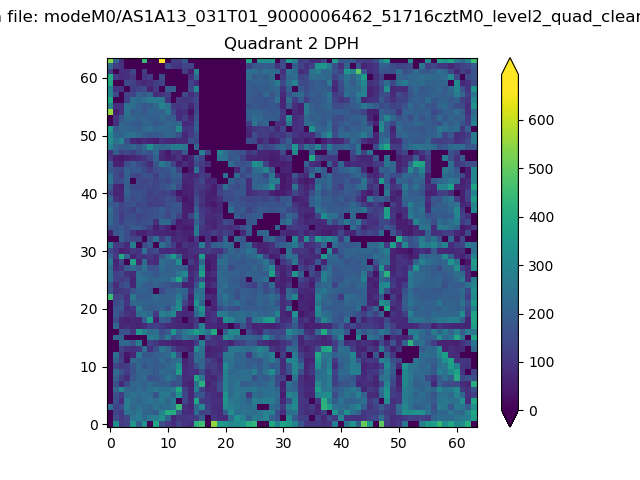 |
Quadrant C |
| Plot type | Count rate plots | Images |
|---|---|---|
| Comparison with Poisson distribution Blue bars denote a histogram of data divided into 1 sec bins. Red curve is a Poisson curve with rate = median count rate of data. |
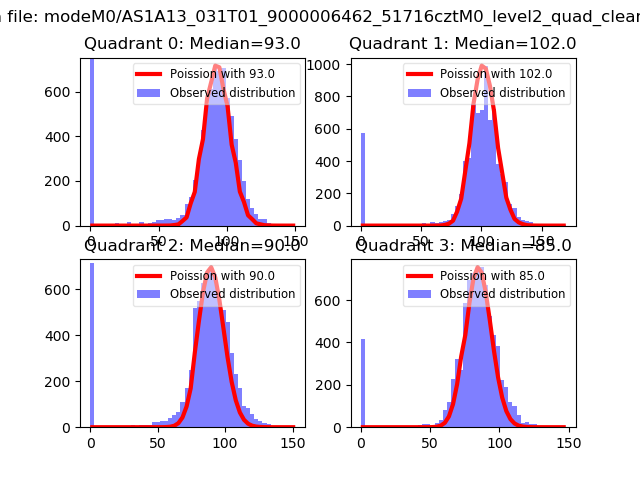 |
 |
| Quadrant-wise count rates Data is divided into 100 sec bins |
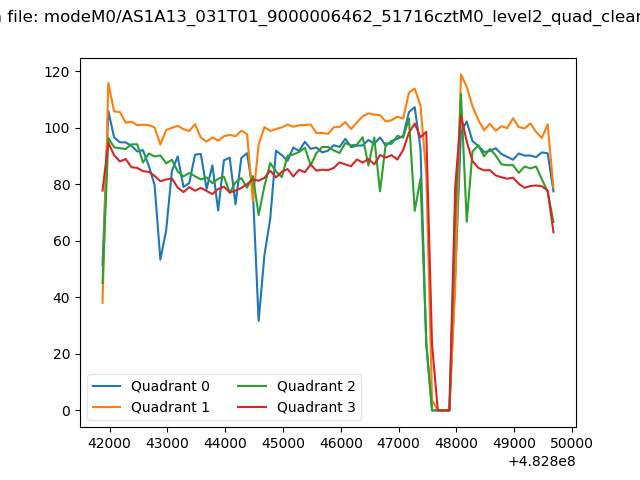 |
|
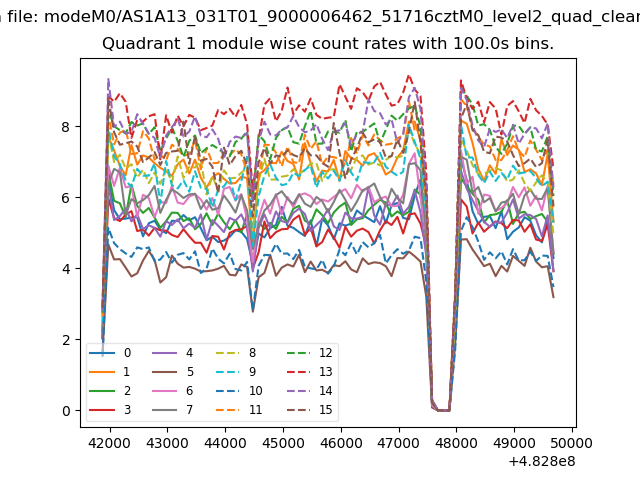
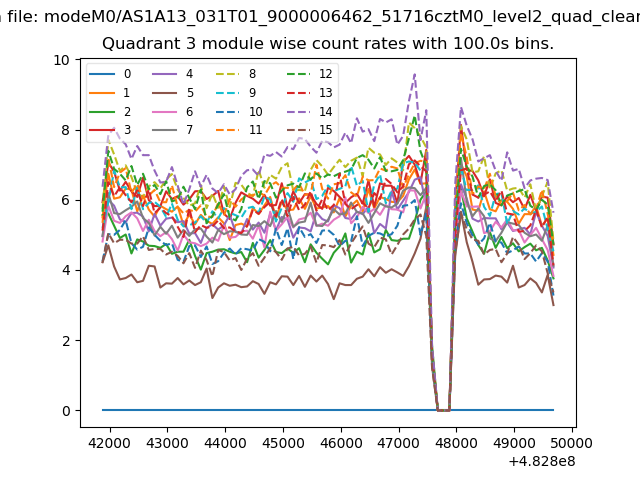
| Module-wise count rates for Quadrant A Data is divided into 100 sec bins |
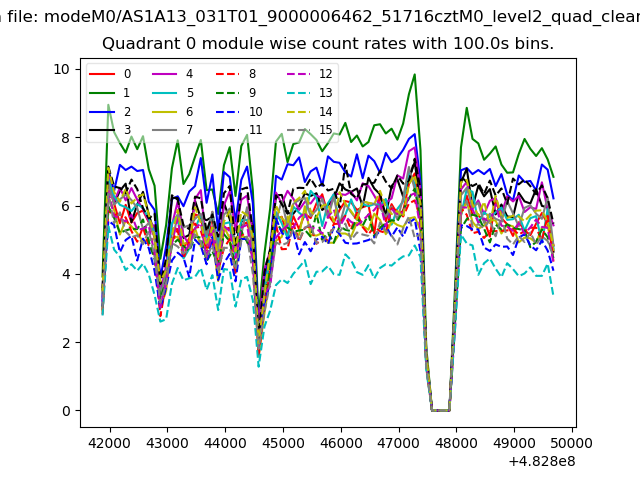 |
 |
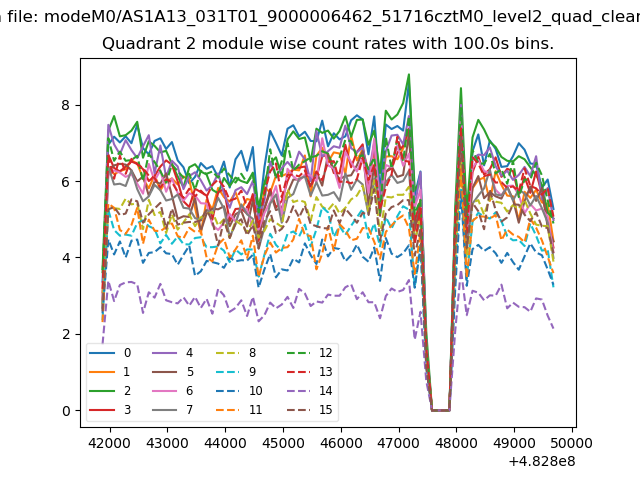
| Module-wise count rates for Quadrant B Data is divided into 100 sec bins |
 |
 |
| Module-wise count rates for Quadrant C Data is divided into 100 sec bins |
 |
 |
| Module-wise count rates for Quadrant D Data is divided into 100 sec bins |
 |
 |
| Parameter | Plot |
|---|---|
| CZT HV Monitor | 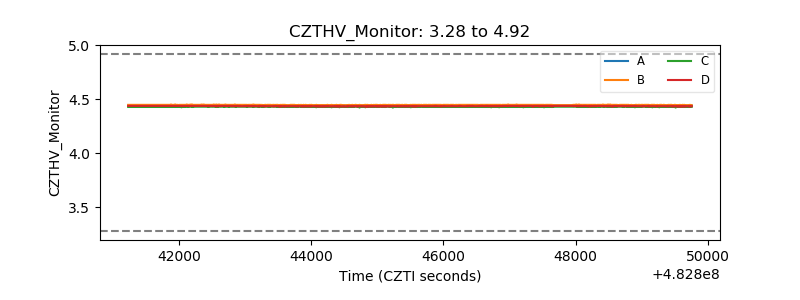 |
| D_VDD | 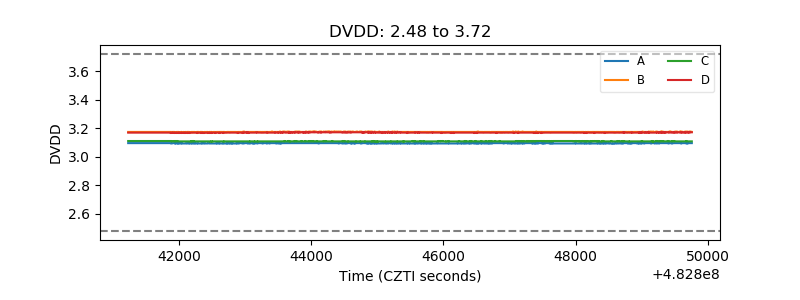 |
| Temperature 1 | 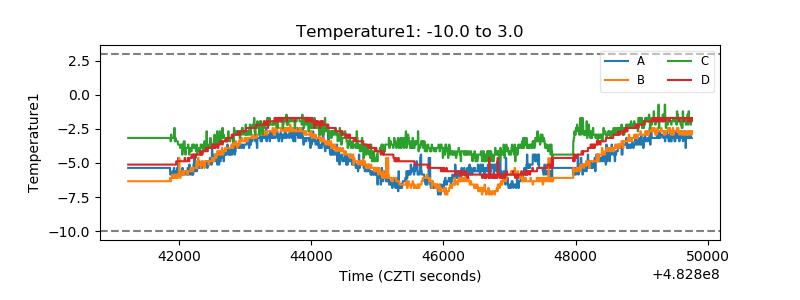 |
| Veto HV Monitor |  |
| Veto LLD | 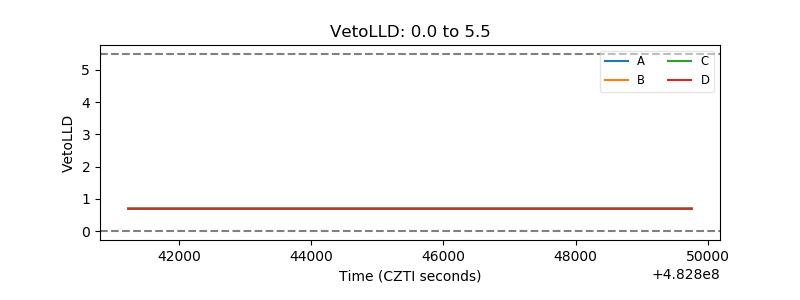 |
| Alpha Counter | 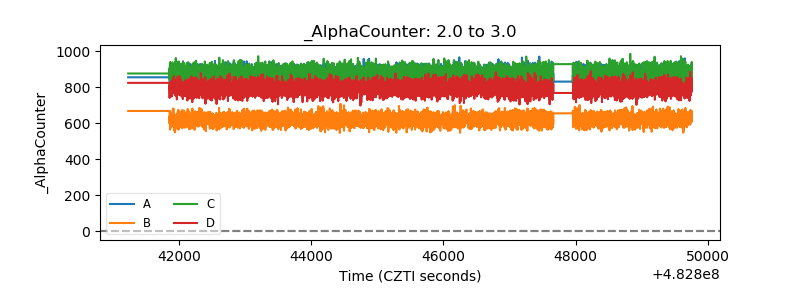 |
| _CPM_Rate | 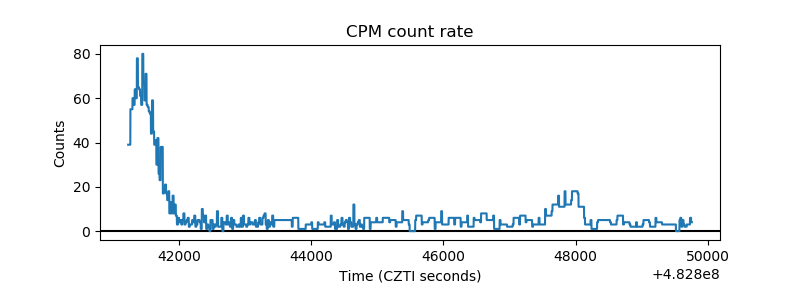 |
| CZT Counter | 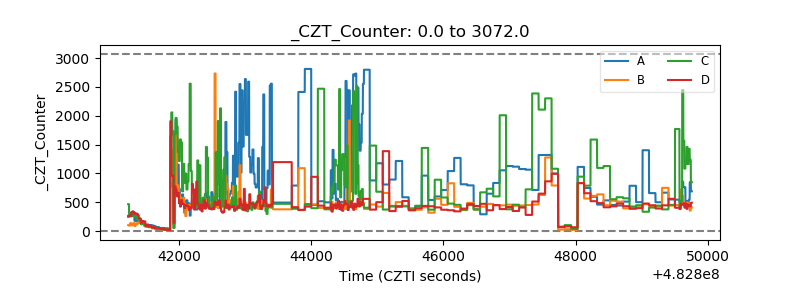 |
| +2.5 Volts monitor | 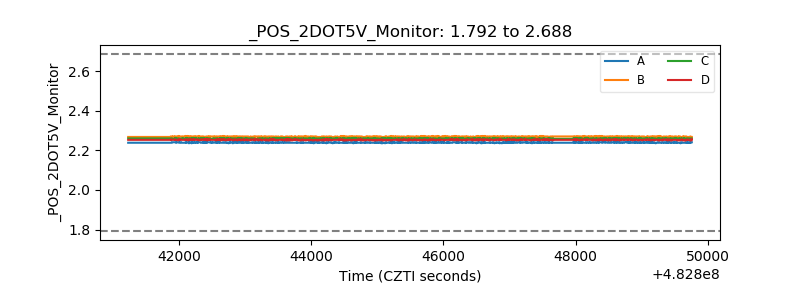 |
| +5 Volts monitor | 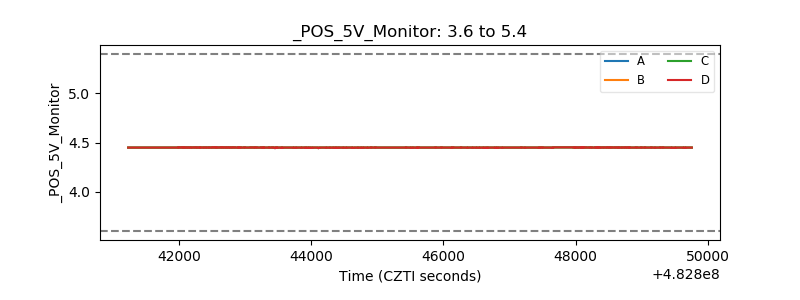 |
| _ROLL_ROT | 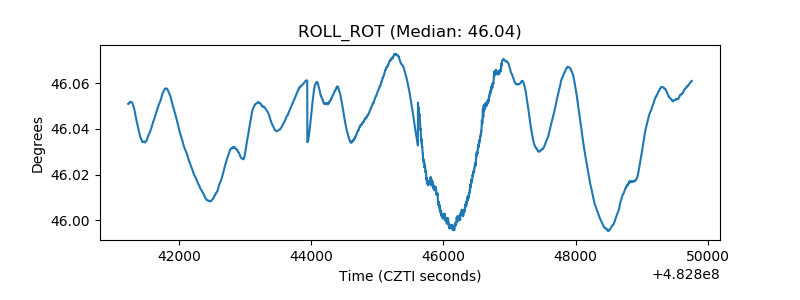 |
| _Roll_DEC | 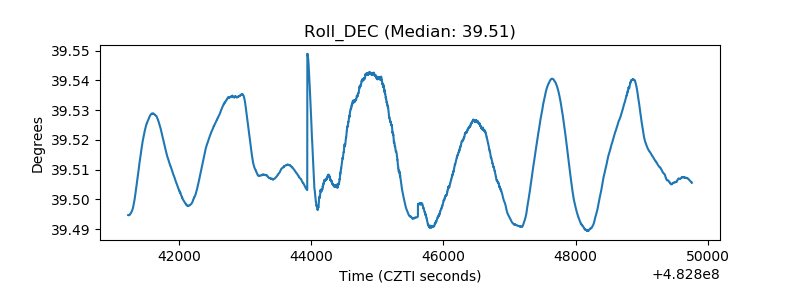 |
| _Roll_RA | 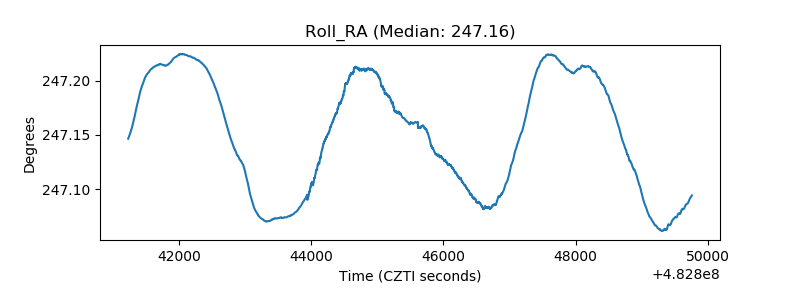 |
| Veto Counter | 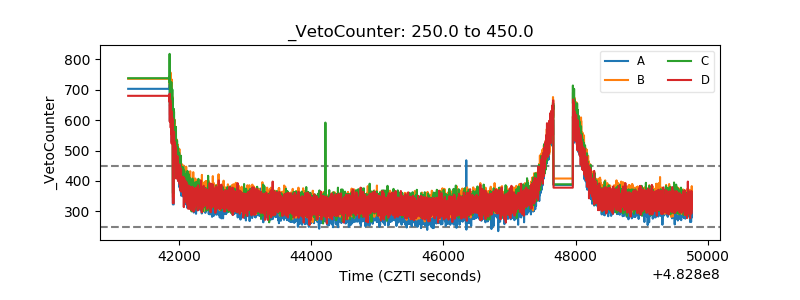 |