| Param | Original file | Final file |
|---|---|---|
| Filename | modeM0/AS1A13_031T01_9000006462_51717cztM0_level2.fits | modeM0/AS1A13_031T01_9000006462_51717cztM0_level2_quad_clean.evt |
| Size (bytes) | 547,263,360 | 114,655,680 |
| Size | 521.9 MB | 109.3 MB |
| Events in quadrant A | 5,562,925 | 738,935 |
| Events in quadrant B | 4,296,518 | 798,482 |
| Events in quadrant C | 5,703,248 | 700,899 |
| Events in quadrant D | 4,071,673 | 675,128 |
| Mode M9 | |||
|---|---|---|---|
| Quadrant | BADHDUFLAG | Total packets | Discarded packets |
| A | 0 | 3 | 0 |
| B | 0 | 3 | 0 |
| C | 0 | 3 | 0 |
| D | 0 | 3 | 0 |
| Mode M0 | |||
|---|---|---|---|
| Quadrant | BADHDUFLAG | Total packets | Discarded packets |
| A | 0 | 21940 | 1 |
| B | 0 | 18325 | 1 |
| C | 0 | 22527 | 1 |
| D | 0 | 17989 | 1 |
| Mode SS | |||
|---|---|---|---|
| Quadrant | BADHDUFLAG | Total packets | Discarded packets |
| A | 0 | 162 | 0 |
| B | 0 | 162 | 0 |
| C | 0 | 162 | 0 |
| D | 0 | 162 | 0 |
| Quadrant | Total seconds | Saturated seconds | Saturation percentage |
|---|---|---|---|
| A | 8033 | 260 | 3.236649% |
| B | 8034 | 288 | 3.584765% |
| C | 8034 | 472 | 5.875031% |
| D | 8034 | 190 | 2.364949% |
Noise dominated data is calculated using 1-second bins in cleaned event files. If a bin has >2000 counts, and if more than 50% of those come from <1% of pixels, then it is considered to be noise-dominated and hence unusable.
| Quadrant | # 1 sec bins | Bins with >0 counts | Bins with >2000 counts | High rate bins dominated by noise | Noise dominated (total time) | Noise dominated (detector-on time) | Marked lightcurve |
|---|---|---|---|---|---|---|---|
| A | 8328 | 8034 | 21 | 21 | 0.25% | 0.26% | 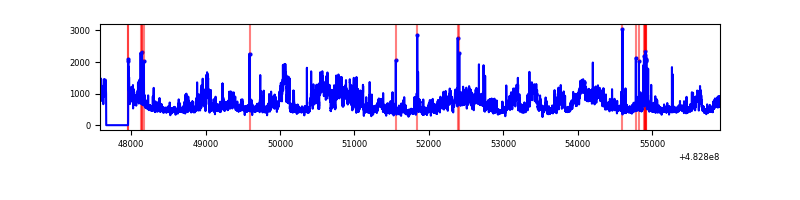 |
| B | 8329 | 8035 | 47 | 47 | 0.56% | 0.58% | 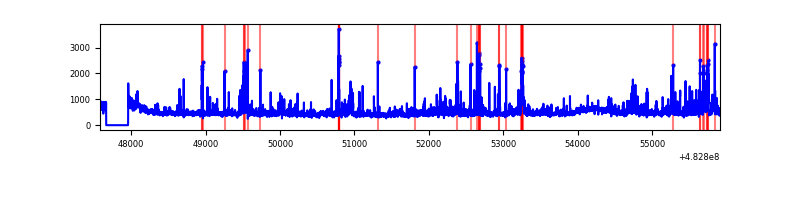 |
| C | 8329 | 8035 | 247 | 247 | 2.97% | 3.07% | 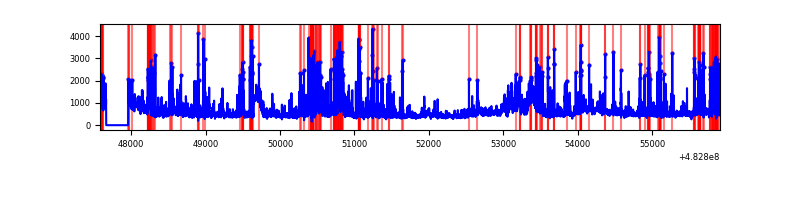 |
| D | 8329 | 8035 | 37 | 37 | 0.44% | 0.46% | 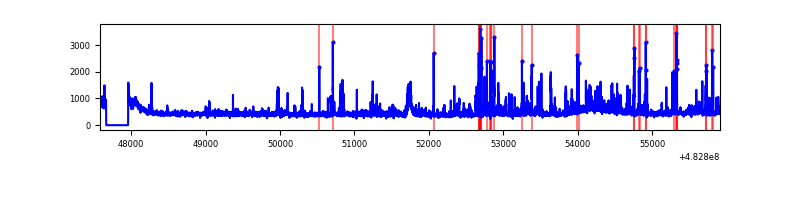 |
Top three noisy pixels from each quadrant. If the there are fewer than three noisy pixels in the level2.evt file, extra rows are filled as -1
| Pixel properties | Quadrant properties | ||||||
|---|---|---|---|---|---|---|---|
| Quadrant | DetID | PixID | Counts | Sigma | Mean | Median | Sigma |
| A | 12 | 3 | 1204991 | 5550.87 | 890 | 865 | 216.9 |
| A | 3 | 14 | 278235 | 1278.64 | 890 | 865 | 216.9 |
| A | 12 | 194 | 150878 | 691.54 | 890 | 865 | 216.9 |
| B | 0 | 213 | 195447 | 1028.53 | 879 | 847 | 189.2 |
| B | 10 | 254 | 88516 | 463.36 | 879 | 847 | 189.2 |
| B | 8 | 128 | 85209 | 445.88 | 879 | 847 | 189.2 |
| C | 15 | 230 | 450650 | 1958.79 | 849 | 842 | 229.6 |
| C | 12 | 254 | 385565 | 1675.37 | 849 | 842 | 229.6 |
| C | 13 | 3 | 351825 | 1528.44 | 849 | 842 | 229.6 |
| D | 3 | 12 | 131070 | 542.49 | 867 | 836 | 240.1 |
| D | 8 | 176 | 122168 | 505.41 | 867 | 836 | 240.1 |
| D | 2 | 249 | 118050 | 488.26 | 867 | 836 | 240.1 |
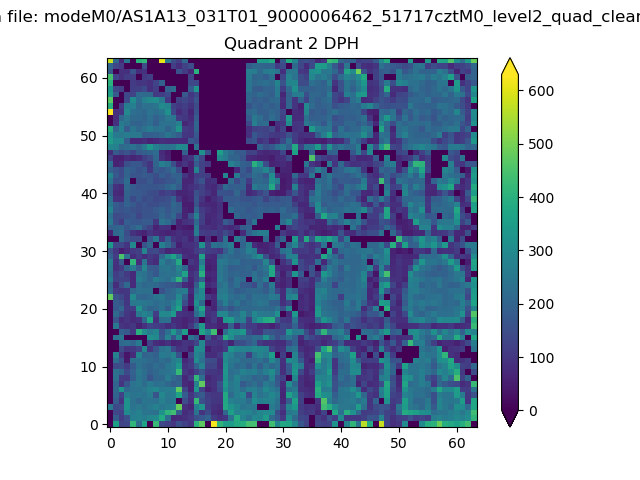
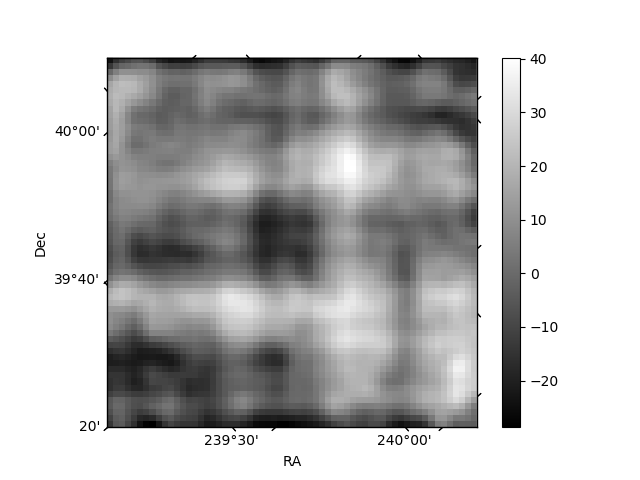
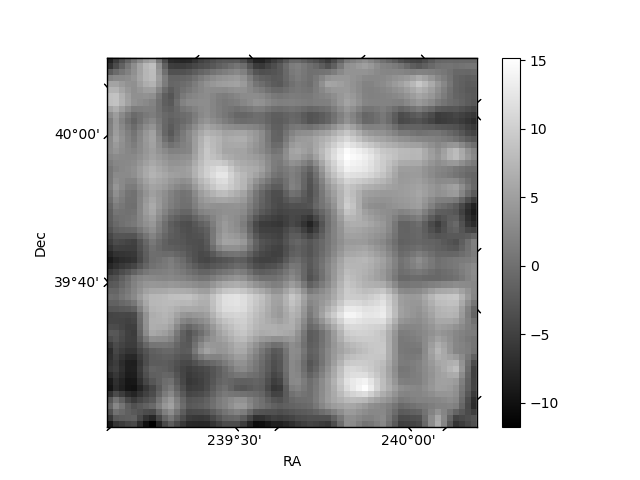
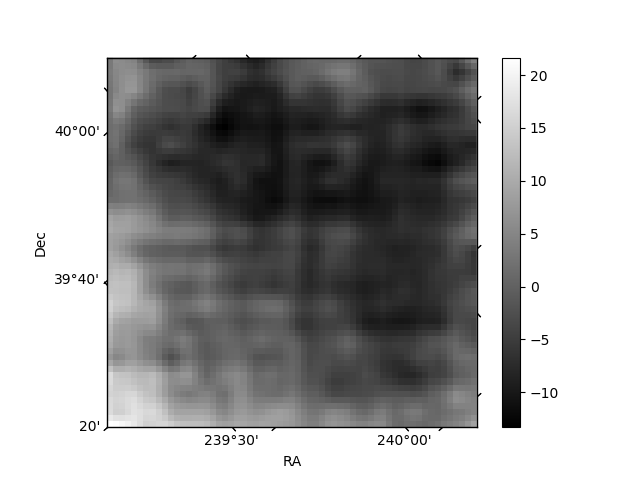
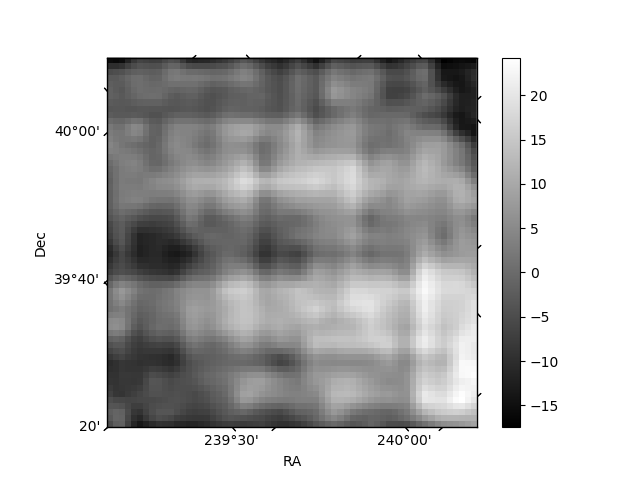
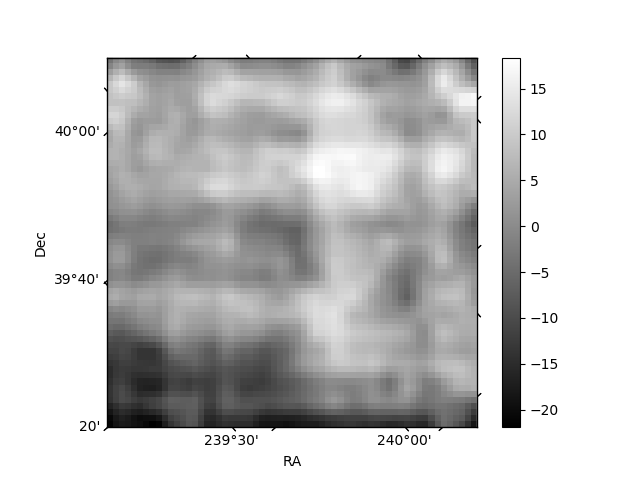
Histogram calculated using DETX and DETY for each event in the final _common_clean file
| Quadrant A | 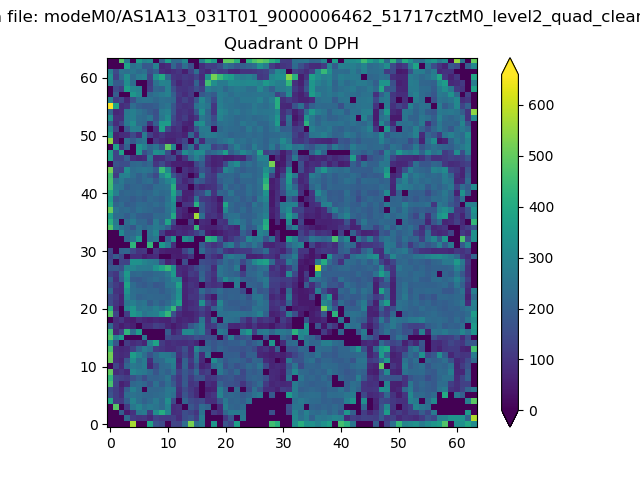 |
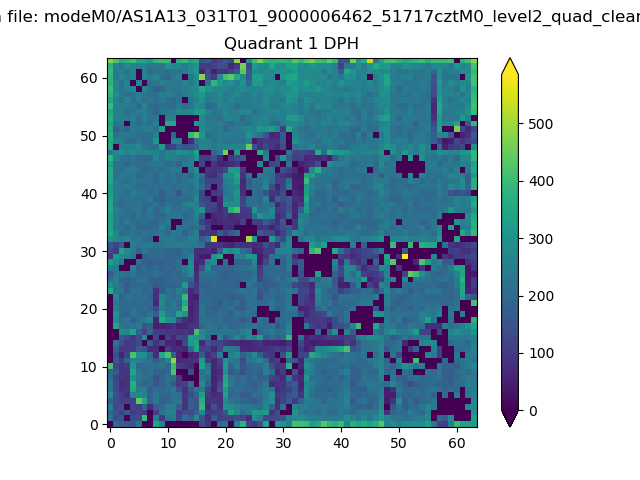 |
Quadrant B |
|---|---|---|---|
| Quadrant D | 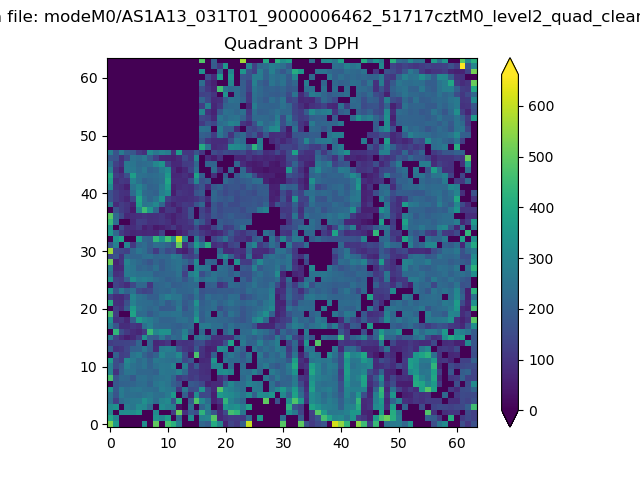 |
 |
Quadrant C |
| Plot type | Count rate plots | Images |
|---|---|---|
| Comparison with Poisson distribution Blue bars denote a histogram of data divided into 1 sec bins. Red curve is a Poisson curve with rate = median count rate of data. |
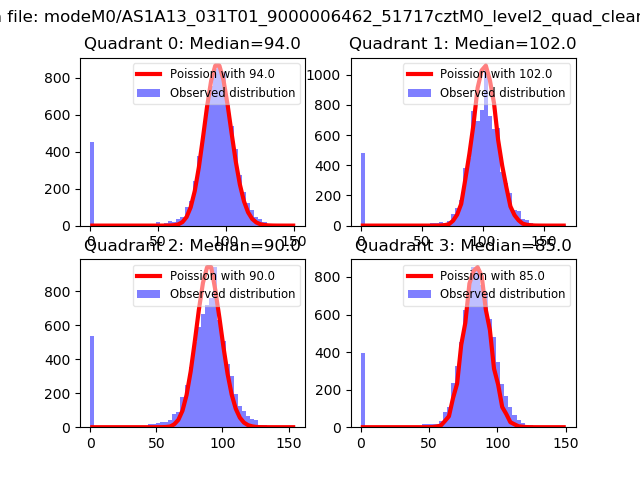 |
 |
| Quadrant-wise count rates Data is divided into 100 sec bins |
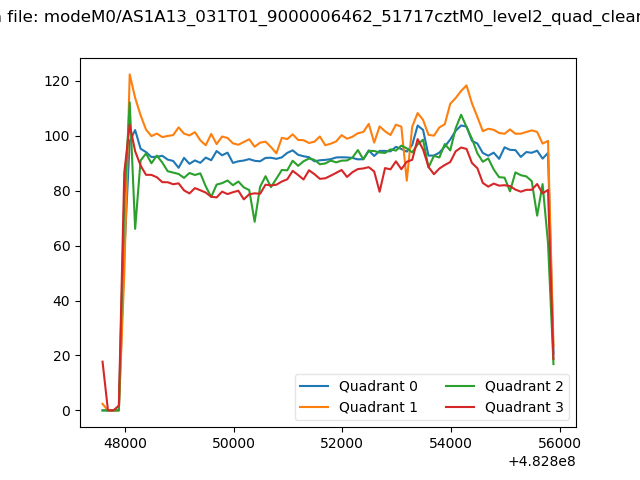 |
|
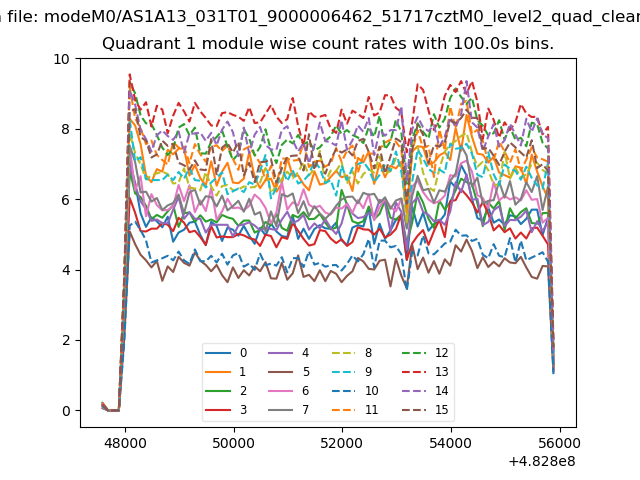
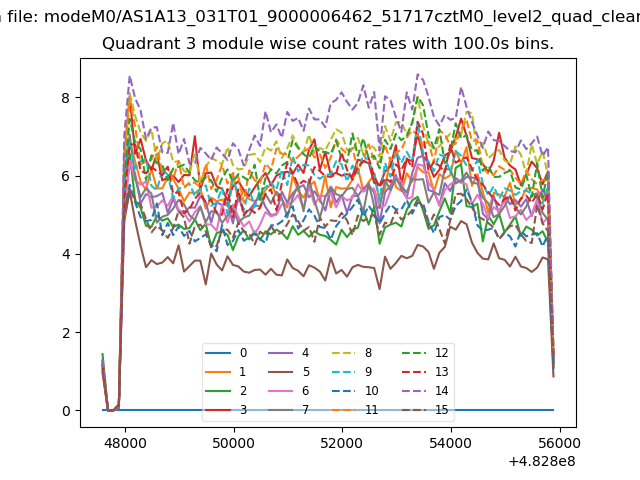
| Module-wise count rates for Quadrant A Data is divided into 100 sec bins |
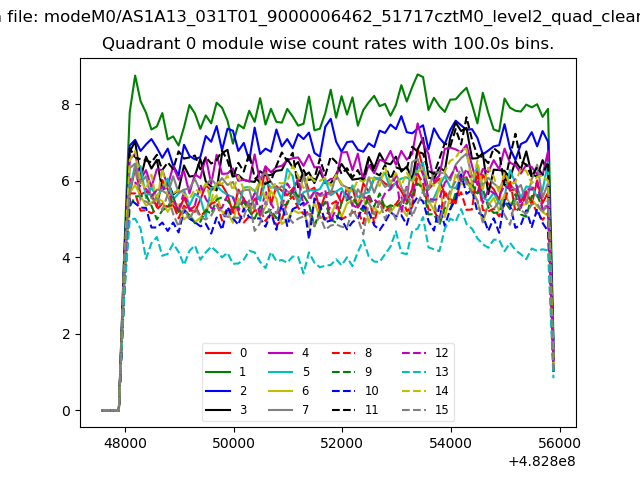 |
 |
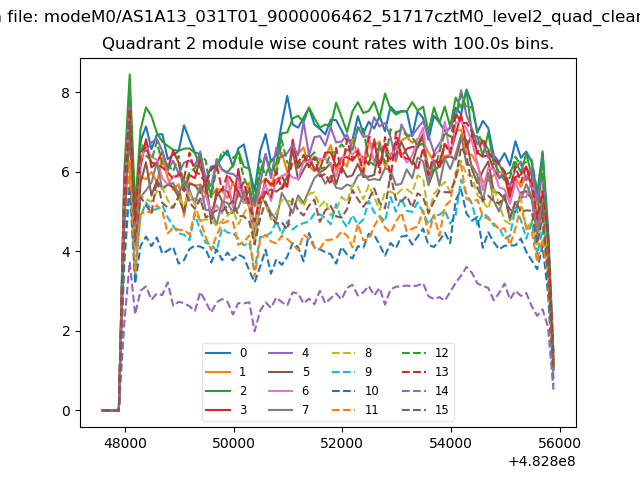
| Module-wise count rates for Quadrant B Data is divided into 100 sec bins |
 |
 |
| Module-wise count rates for Quadrant C Data is divided into 100 sec bins |
 |
 |
| Module-wise count rates for Quadrant D Data is divided into 100 sec bins |
 |
 |
| Parameter | Plot |
|---|---|
| CZT HV Monitor |  |
| D_VDD | 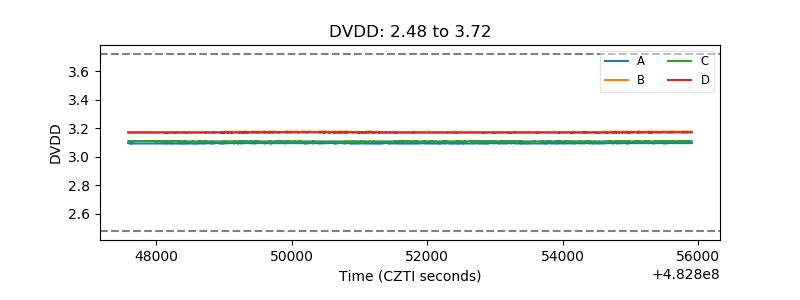 |
| Temperature 1 | 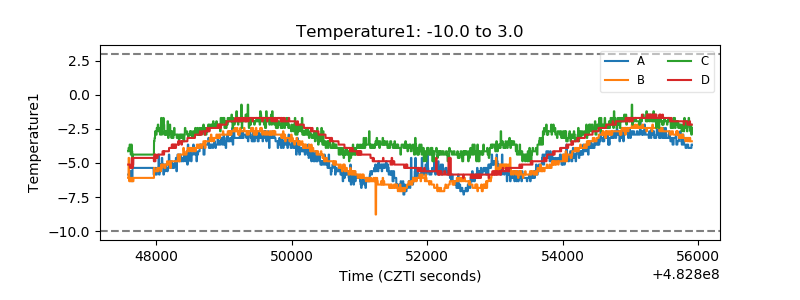 |
| Veto HV Monitor | 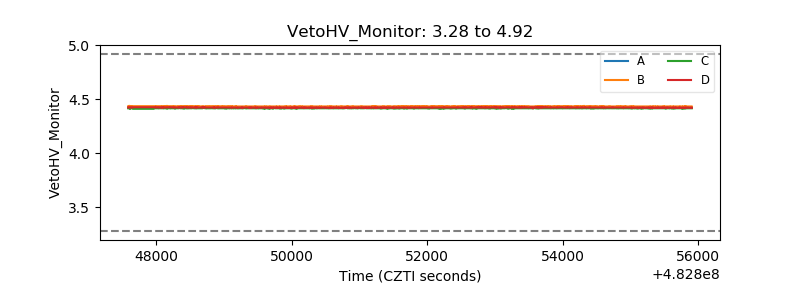 |
| Veto LLD | 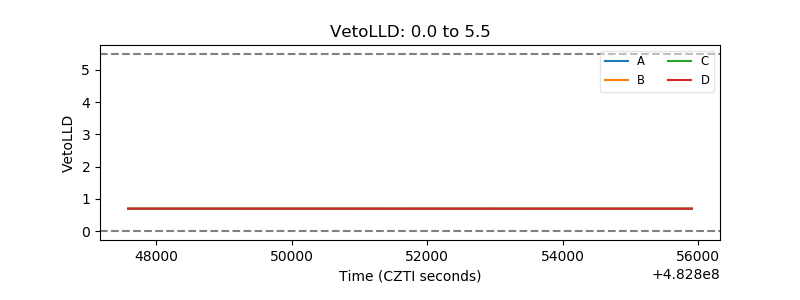 |
| Alpha Counter | 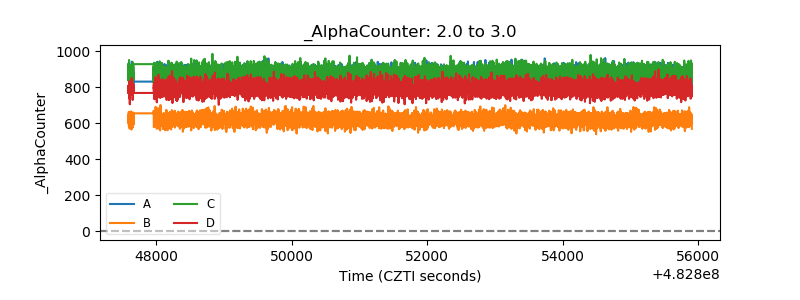 |
| _CPM_Rate | 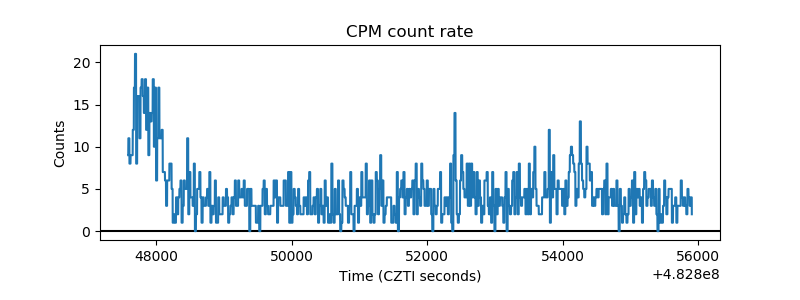 |
| CZT Counter | 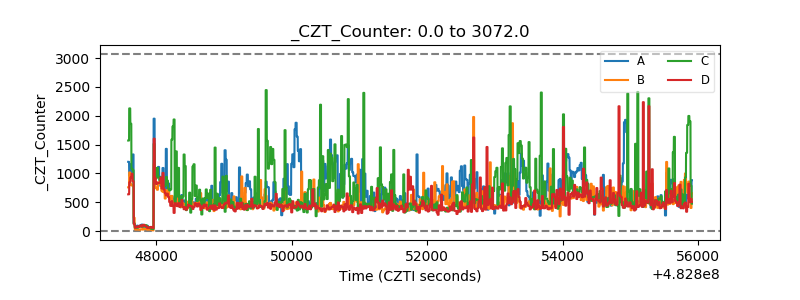 |
| +2.5 Volts monitor | 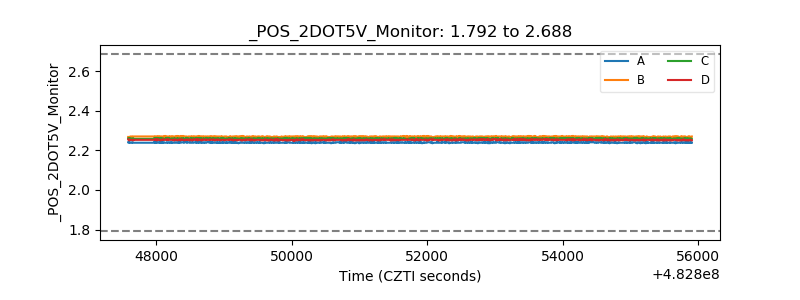 |
| +5 Volts monitor | 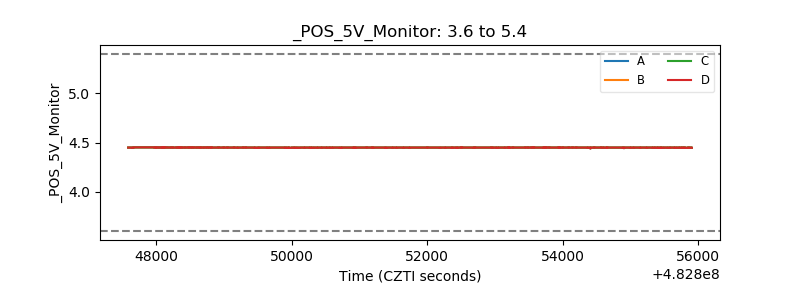 |
| _ROLL_ROT | 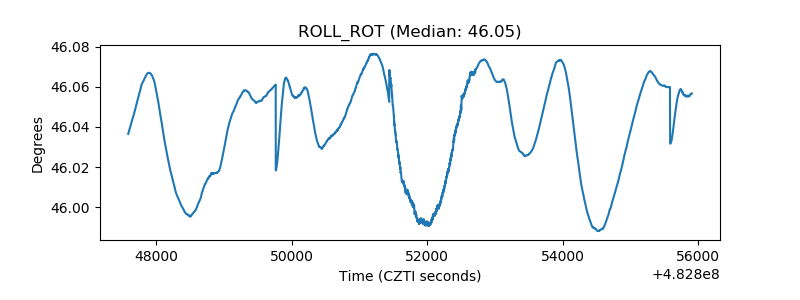 |
| _Roll_DEC | 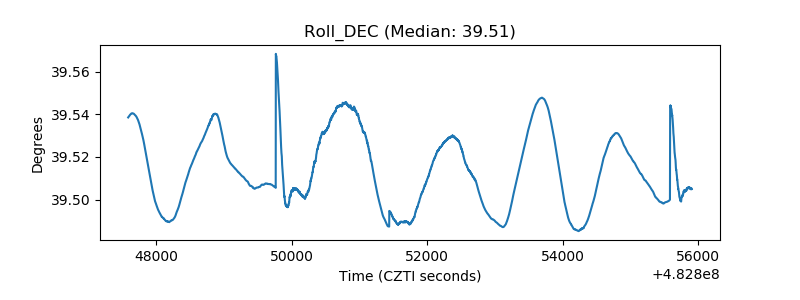 |
| _Roll_RA | 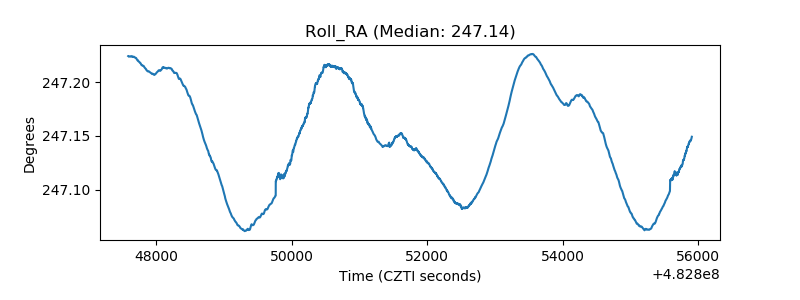 |
| Veto Counter |  |