| Param | Original file | Final file |
|---|---|---|
| Filename | modeM0/AS1A13_031T01_9000006462_51718cztM0_level2.fits | modeM0/AS1A13_031T01_9000006462_51718cztM0_level2_quad_clean.evt |
| Size (bytes) | 582,451,200 | 118,624,320 |
| Size | 555.5 MB | 113.1 MB |
| Events in quadrant A | 5,324,239 | 773,254 |
| Events in quadrant B | 4,457,845 | 836,862 |
| Events in quadrant C | 6,516,676 | 713,911 |
| Events in quadrant D | 4,620,695 | 693,407 |
| Mode M0 | |||
|---|---|---|---|
| Quadrant | BADHDUFLAG | Total packets | Discarded packets |
| A | 0 | 21398 | 0 |
| B | 0 | 19025 | 0 |
| C | 0 | 24981 | 0 |
| D | 0 | 19633 | 0 |
| Mode SS | |||
|---|---|---|---|
| Quadrant | BADHDUFLAG | Total packets | Discarded packets |
| A | 0 | 166 | 0 |
| B | 0 | 166 | 0 |
| C | 0 | 166 | 0 |
| D | 0 | 166 | 0 |
| Quadrant | Total seconds | Saturated seconds | Saturation percentage |
|---|---|---|---|
| A | 8264 | 107 | 1.294773% |
| B | 8264 | 137 | 1.657793% |
| C | 8264 | 550 | 6.655373% |
| D | 8265 | 142 | 1.718088% |
Noise dominated data is calculated using 1-second bins in cleaned event files. If a bin has >2000 counts, and if more than 50% of those come from <1% of pixels, then it is considered to be noise-dominated and hence unusable.
| Quadrant | # 1 sec bins | Bins with >0 counts | Bins with >2000 counts | High rate bins dominated by noise | Noise dominated (total time) | Noise dominated (detector-on time) | Marked lightcurve |
|---|---|---|---|---|---|---|---|
| A | 8264 | 8264 | 44 | 44 | 0.53% | 0.53% | 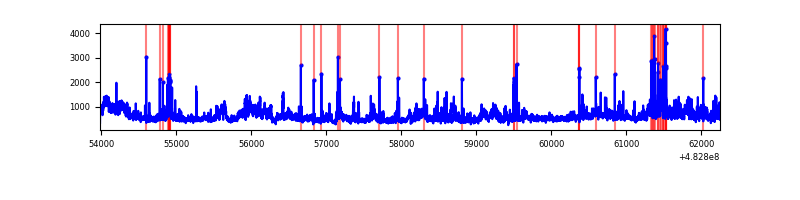 |
| B | 8264 | 8264 | 76 | 76 | 0.92% | 0.92% | 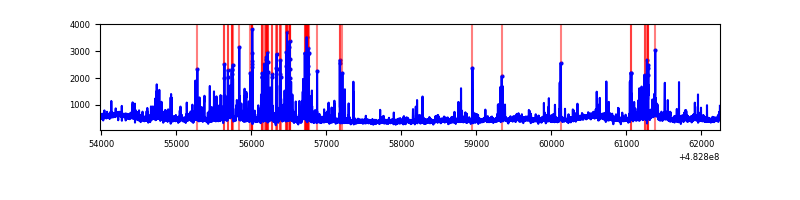 |
| C | 8264 | 8264 | 428 | 428 | 5.18% | 5.18% | 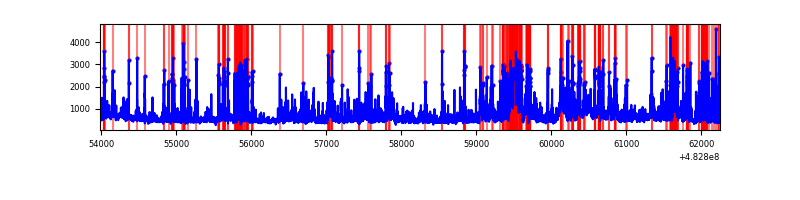 |
| D | 8265 | 8265 | 100 | 100 | 1.21% | 1.21% | 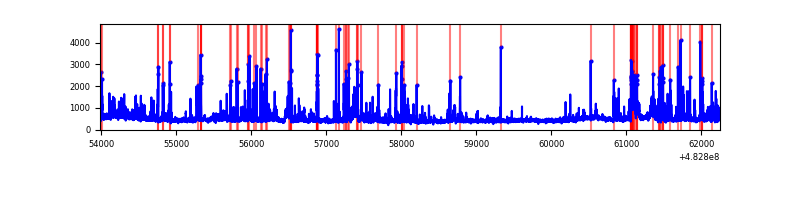 |
Top three noisy pixels from each quadrant. If the there are fewer than three noisy pixels in the level2.evt file, extra rows are filled as -1
| Pixel properties | Quadrant properties | ||||||
|---|---|---|---|---|---|---|---|
| Quadrant | DetID | PixID | Counts | Sigma | Mean | Median | Sigma |
| A | 12 | 3 | 499234 | 2273.86 | 901 | 878 | 219.2 |
| A | 3 | 14 | 354935 | 1615.46 | 901 | 878 | 219.2 |
| A | 9 | 191 | 248745 | 1130.95 | 901 | 878 | 219.2 |
| B | 0 | 213 | 297146 | 1547.6 | 894 | 863 | 191.4 |
| B | 1 | 223 | 174738 | 908.22 | 894 | 863 | 191.4 |
| B | 10 | 44 | 91277 | 472.27 | 894 | 863 | 191.4 |
| C | 10 | 171 | 679551 | 2952.45 | 851 | 846 | 229.9 |
| C | 13 | 3 | 627722 | 2726.99 | 851 | 846 | 229.9 |
| C | 15 | 178 | 465701 | 2022.18 | 851 | 846 | 229.9 |
| D | 7 | 110 | 204092 | 847.2 | 867 | 837 | 239.9 |
| D | 1 | 3 | 188510 | 782.25 | 867 | 837 | 239.9 |
| D | 7 | 159 | 140999 | 584.22 | 867 | 837 | 239.9 |
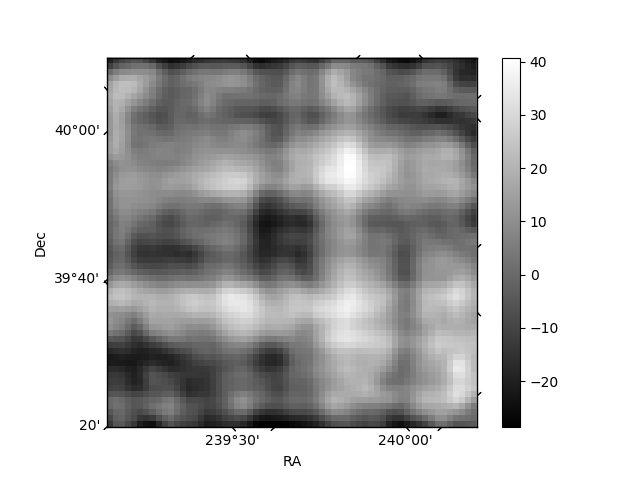
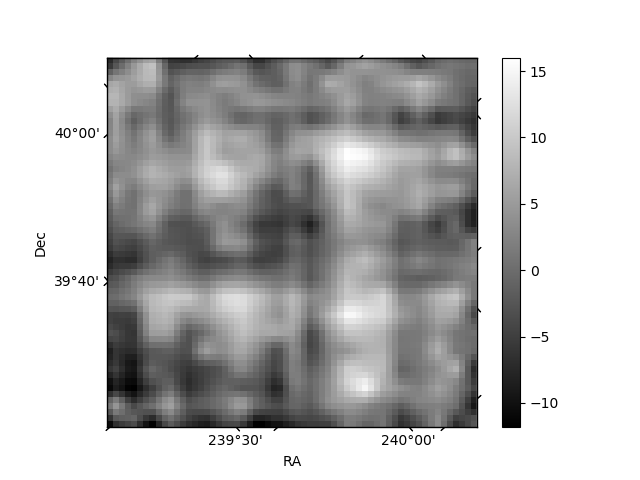
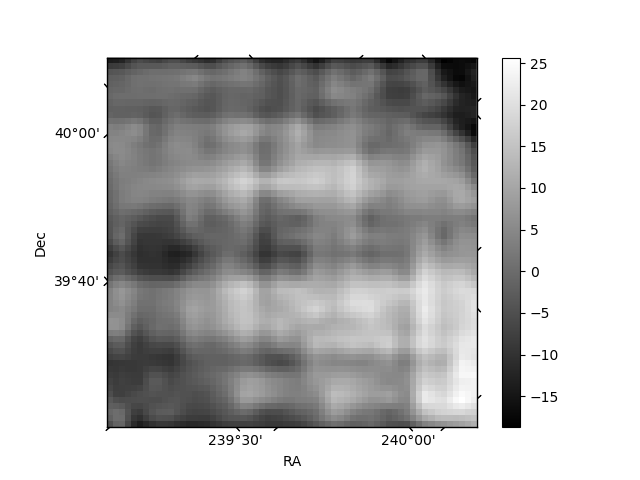
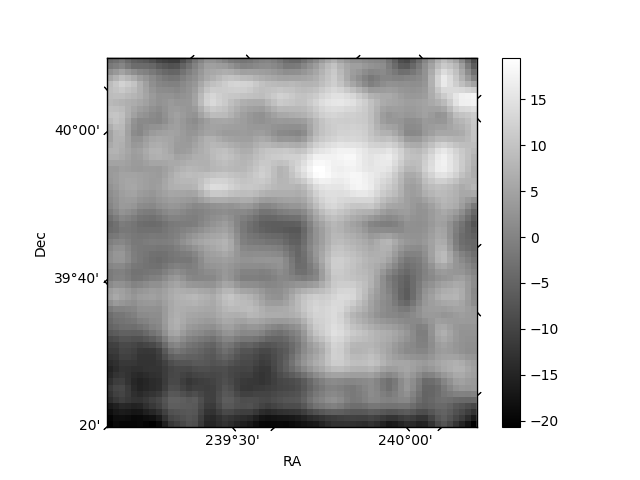
Histogram calculated using DETX and DETY for each event in the final _common_clean file
| Quadrant A | 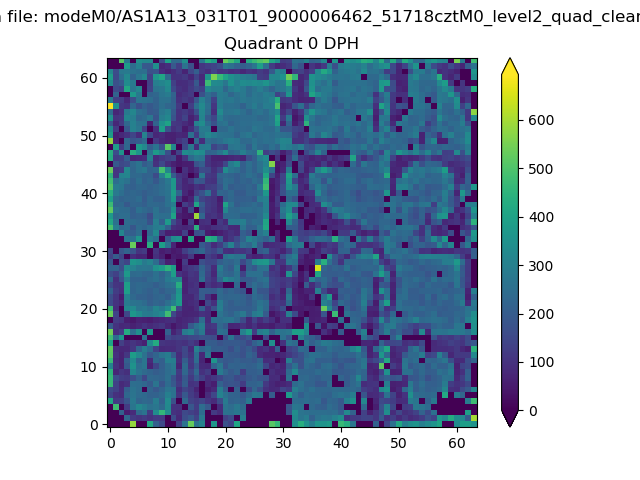 |
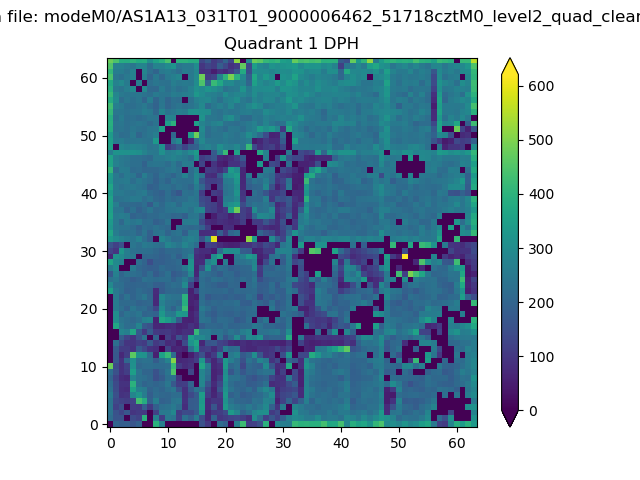 |
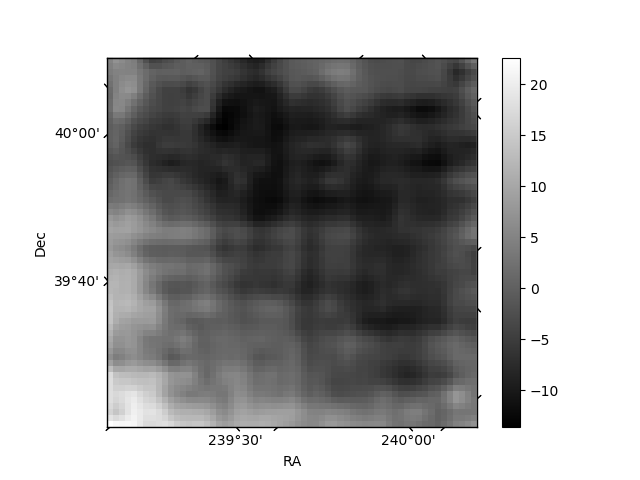
Quadrant B |
|---|---|---|---|
| Quadrant D | 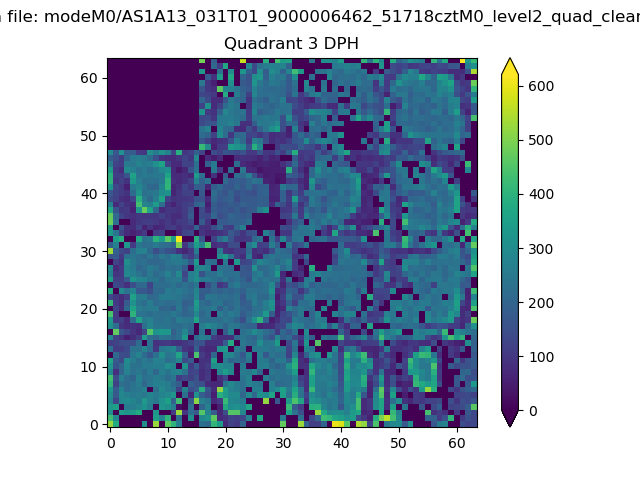 |
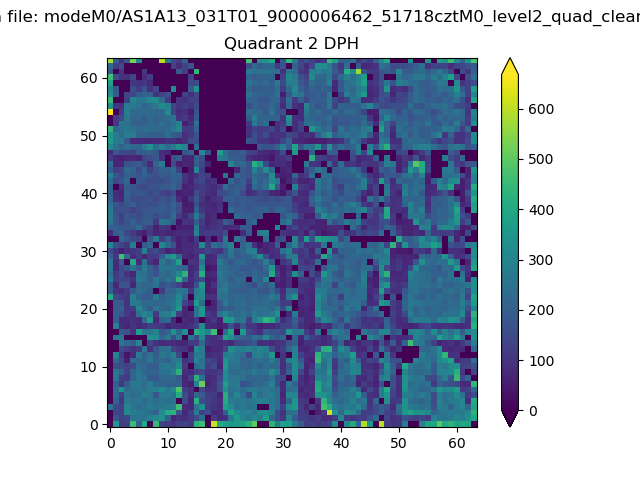 |
Quadrant C |
| Plot type | Count rate plots | Images |
|---|---|---|
| Comparison with Poisson distribution Blue bars denote a histogram of data divided into 1 sec bins. Red curve is a Poisson curve with rate = median count rate of data. |
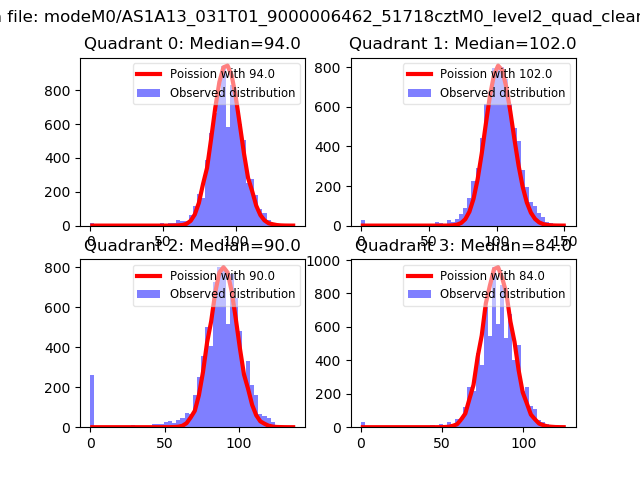 |
 |
| Quadrant-wise count rates Data is divided into 100 sec bins |
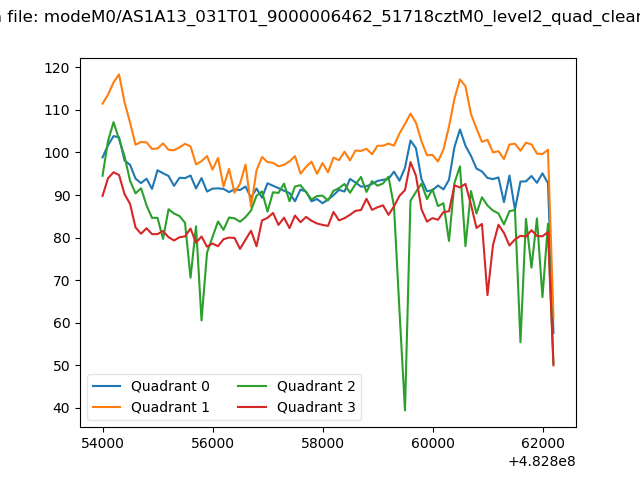 |
|
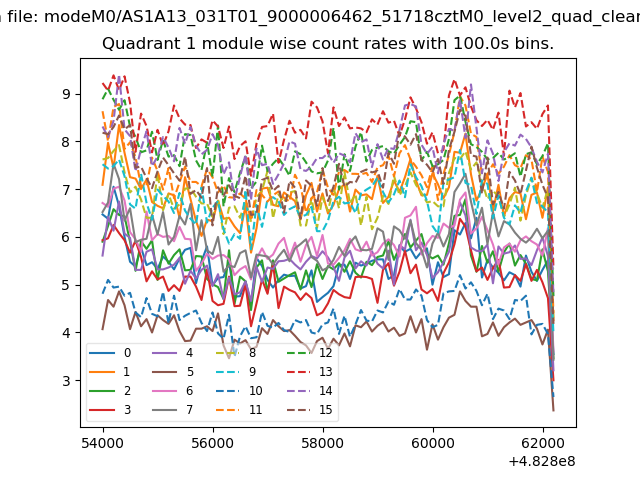
| Module-wise count rates for Quadrant A Data is divided into 100 sec bins |
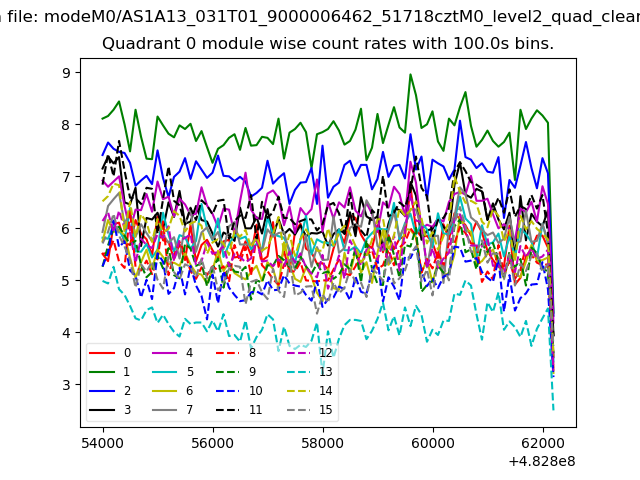 |
 |
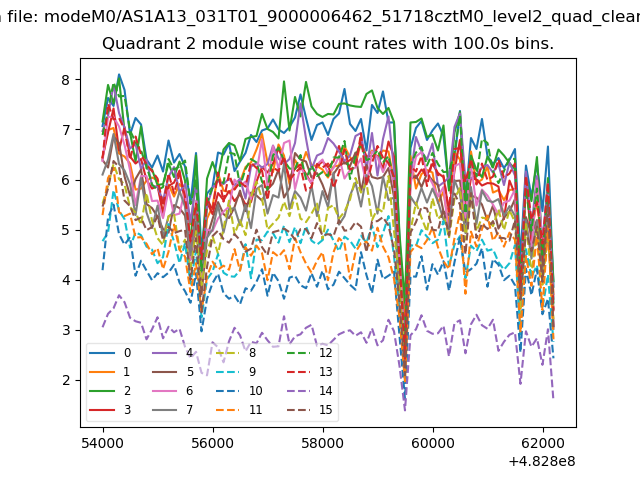
| Module-wise count rates for Quadrant B Data is divided into 100 sec bins |
 |
 |
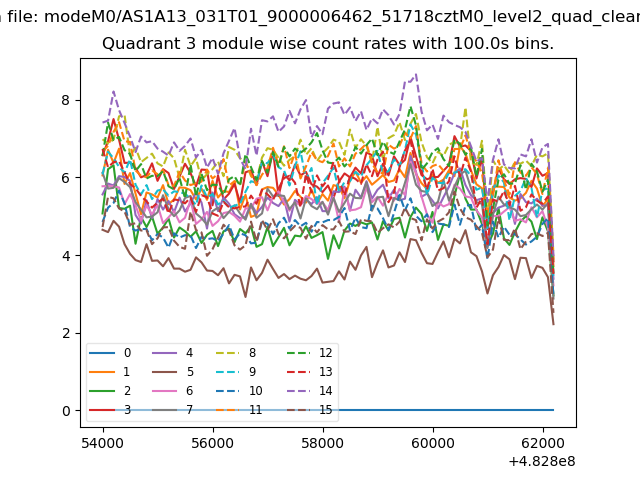
| Module-wise count rates for Quadrant C Data is divided into 100 sec bins |
 |
 |
| Module-wise count rates for Quadrant D Data is divided into 100 sec bins |
 |
 |
| Parameter | Plot |
|---|---|
| CZT HV Monitor | 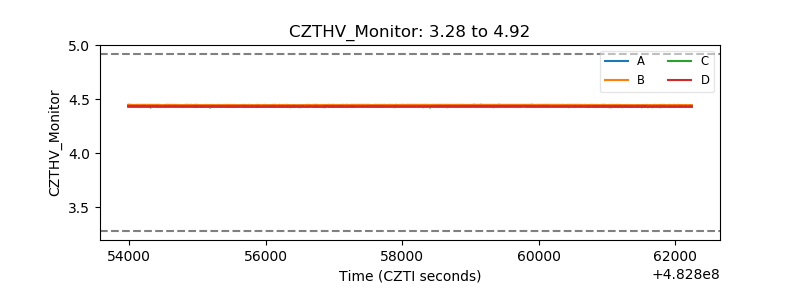 |
| D_VDD | 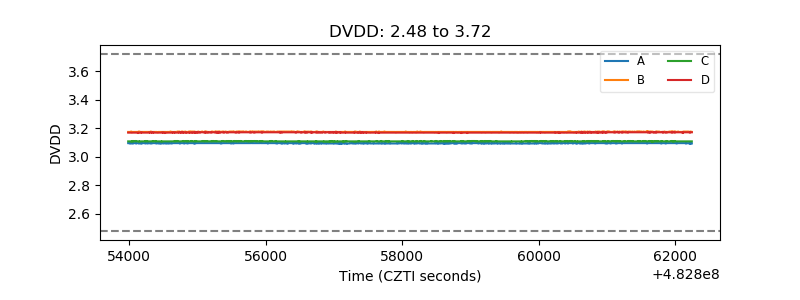 |
| Temperature 1 | 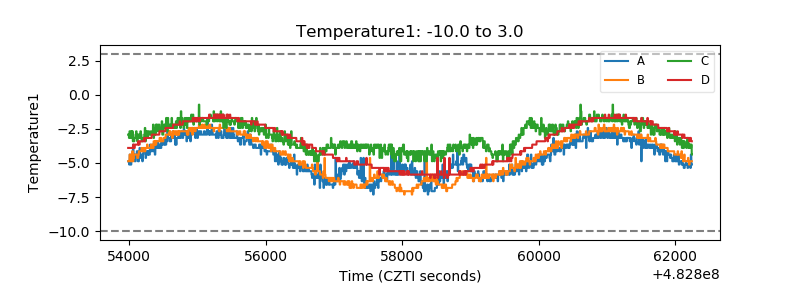 |
| Veto HV Monitor | 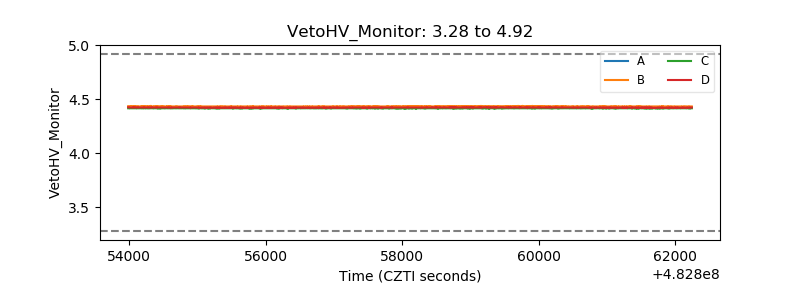 |
| Veto LLD | 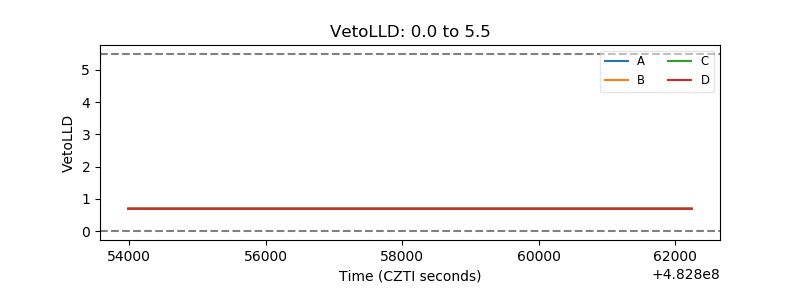 |
| Alpha Counter | 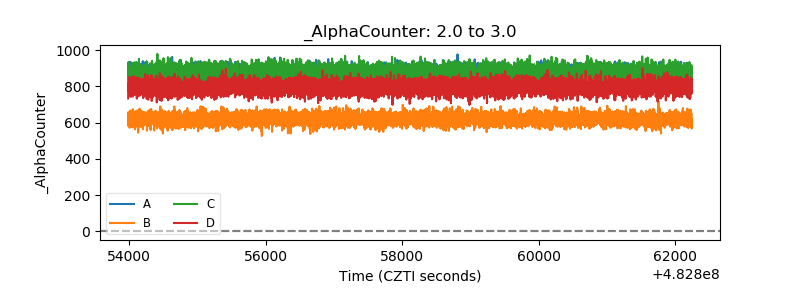 |
| _CPM_Rate | 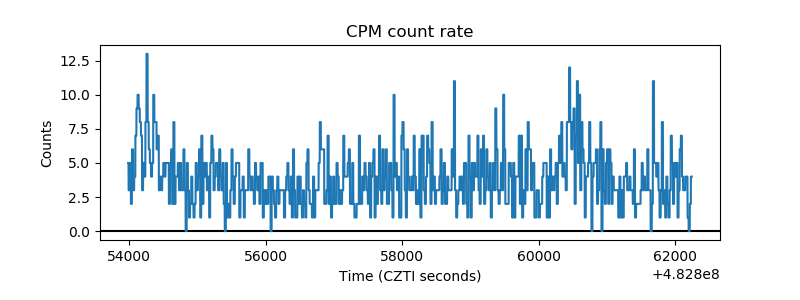 |
| CZT Counter | 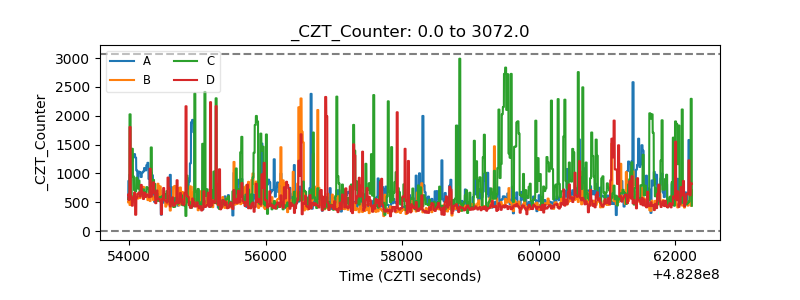 |
| +2.5 Volts monitor | 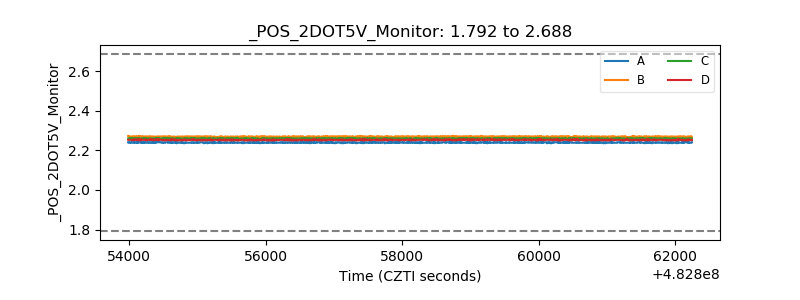 |
| +5 Volts monitor | 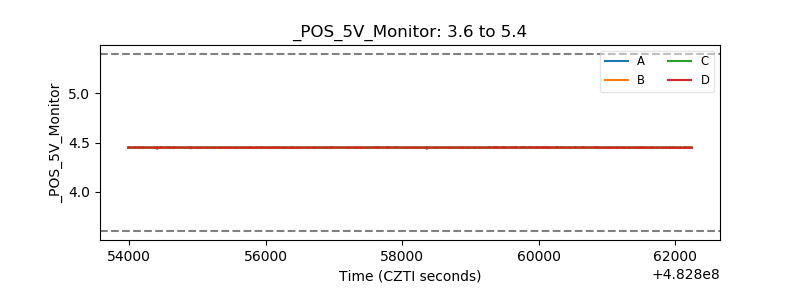 |
| _ROLL_ROT | 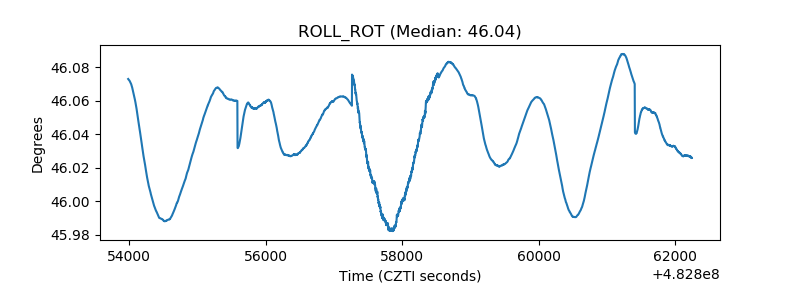 |
| _Roll_DEC | 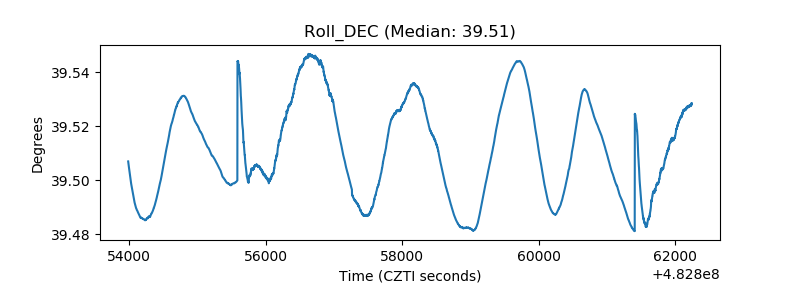 |
| _Roll_RA | 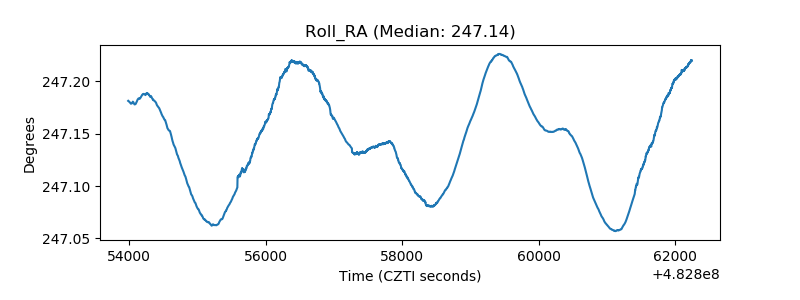 |
| Veto Counter | 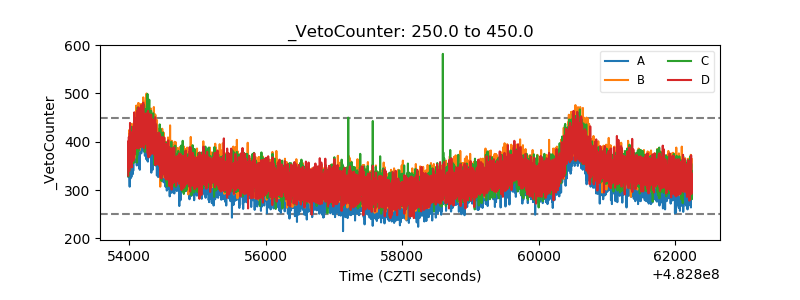 |