| Param | Original file | Final file |
|---|---|---|
| Filename | modeM0/AS1A13_031T01_9000006462_51721cztM0_level2.fits | modeM0/AS1A13_031T01_9000006462_51721cztM0_level2_quad_clean.evt |
| Size (bytes) | 1,472,483,520 | 269,588,160 |
| Size | 1.4 GB | 257.1 MB |
| Events in quadrant A | 17,407,172 | 1,717,516 |
| Events in quadrant B | 10,013,331 | 1,908,249 |
| Events in quadrant C | 12,731,340 | 1,654,921 |
| Events in quadrant D | 12,864,553 | 1,552,926 |
| Mode M9 | |||
|---|---|---|---|
| Quadrant | BADHDUFLAG | Total packets | Discarded packets |
| A | 0 | 10 | 0 |
| B | 0 | 10 | 0 |
| C | 0 | 10 | 0 |
| D | 0 | 10 | 0 |
| Mode M0 | |||
|---|---|---|---|
| Quadrant | BADHDUFLAG | Total packets | Discarded packets |
| A | 0 | 65328 | 2 |
| B | 0 | 43652 | 5 |
| C | 0 | 51753 | 2 |
| D | 0 | 52257 | 2 |
| Mode SS | |||
|---|---|---|---|
| Quadrant | BADHDUFLAG | Total packets | Discarded packets |
| A | 0 | 388 | 0 |
| B | 0 | 388 | 0 |
| C | 0 | 388 | 0 |
| D | 0 | 388 | 0 |
| Quadrant | Total seconds | Saturated seconds | Saturation percentage |
|---|---|---|---|
| A | 19289 | 1070 | 5.547203% |
| B | 19288 | 461 | 2.390087% |
| C | 19290 | 1107 | 5.738725% |
| D | 19290 | 1057 | 5.479523% |
Noise dominated data is calculated using 1-second bins in cleaned event files. If a bin has >2000 counts, and if more than 50% of those come from <1% of pixels, then it is considered to be noise-dominated and hence unusable.
| Quadrant | # 1 sec bins | Bins with >0 counts | Bins with >2000 counts | High rate bins dominated by noise | Noise dominated (total time) | Noise dominated (detector-on time) | Marked lightcurve |
|---|---|---|---|---|---|---|---|
| A | 20199 | 19290 | 680 | 680 | 3.37% | 3.53% | 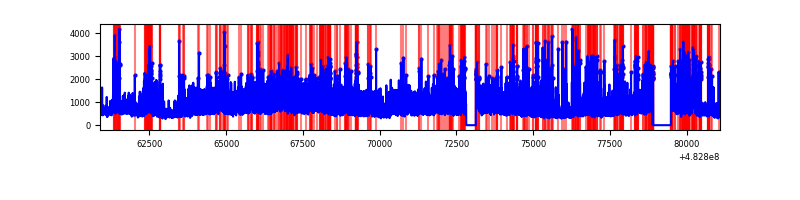 |
| B | 20200 | 19291 | 234 | 234 | 1.16% | 1.21% | 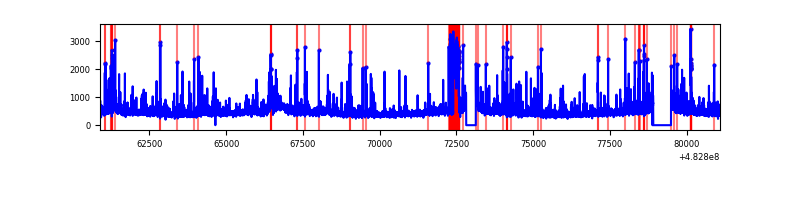 |
| C | 20200 | 19292 | 855 | 855 | 4.23% | 4.43% | 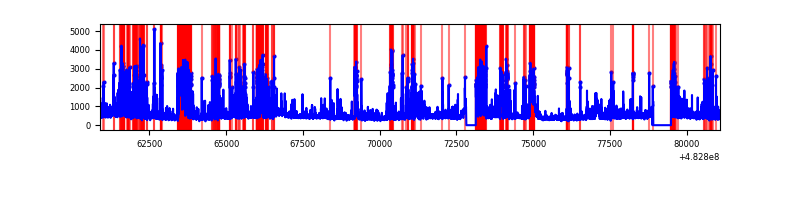 |
| D | 20200 | 19293 | 767 | 767 | 3.80% | 3.98% | 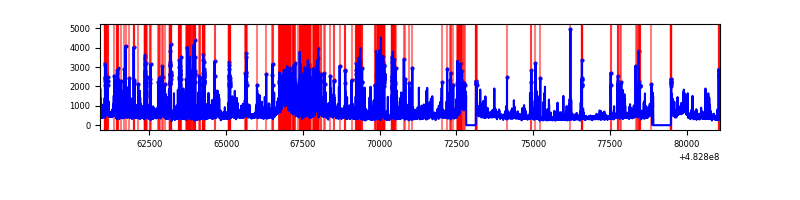 |
Top three noisy pixels from each quadrant. If the there are fewer than three noisy pixels in the level2.evt file, extra rows are filled as -1
| Pixel properties | Quadrant properties | ||||||
|---|---|---|---|---|---|---|---|
| Quadrant | DetID | PixID | Counts | Sigma | Mean | Median | Sigma |
| A | 3 | 14 | 4970935 | 10127.14 | 2012 | 1964 | 490.7 |
| A | 11 | 3 | 995264 | 2024.42 | 2012 | 1964 | 490.7 |
| A | 8 | 248 | 896492 | 1823.11 | 2012 | 1964 | 490.7 |
| B | 10 | 44 | 501272 | 1158.16 | 2026 | 1952 | 431.1 |
| B | 0 | 213 | 240706 | 553.78 | 2026 | 1952 | 431.1 |
| B | 8 | 128 | 165614 | 379.61 | 2026 | 1952 | 431.1 |
| C | 13 | 3 | 1200505 | 2223.89 | 1973 | 1956 | 538.9 |
| C | 0 | 209 | 803287 | 1486.86 | 1973 | 1956 | 538.9 |
| C | 15 | 199 | 715926 | 1324.76 | 1973 | 1956 | 538.9 |
| D | 7 | 60 | 1407816 | 2604.13 | 1949 | 1875 | 539.9 |
| D | 7 | 110 | 595567 | 1099.66 | 1949 | 1875 | 539.9 |
| D | 2 | 249 | 514989 | 950.41 | 1949 | 1875 | 539.9 |
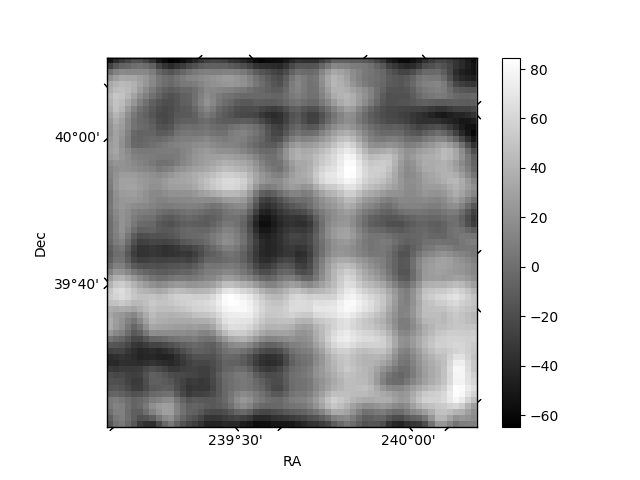
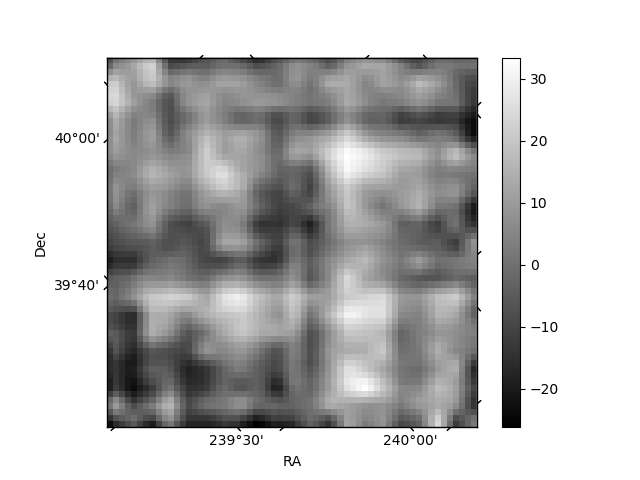
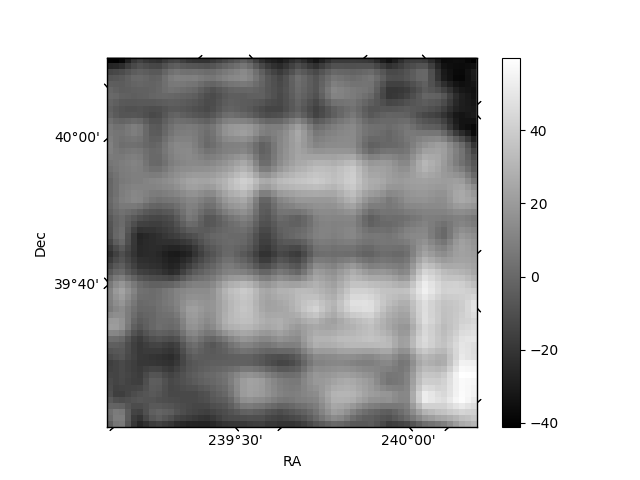
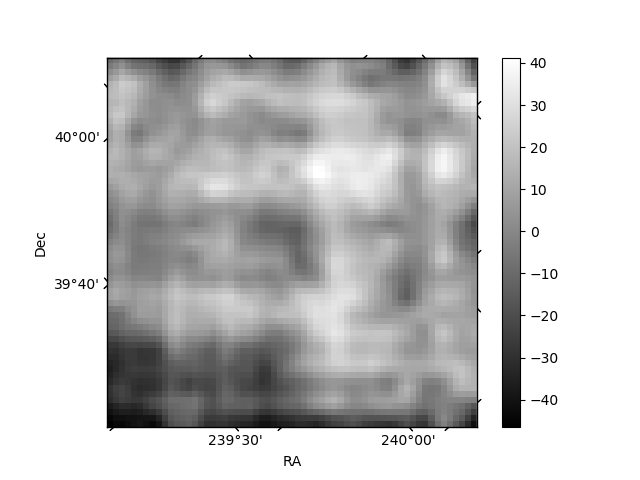
Histogram calculated using DETX and DETY for each event in the final _common_clean file
| Quadrant A | 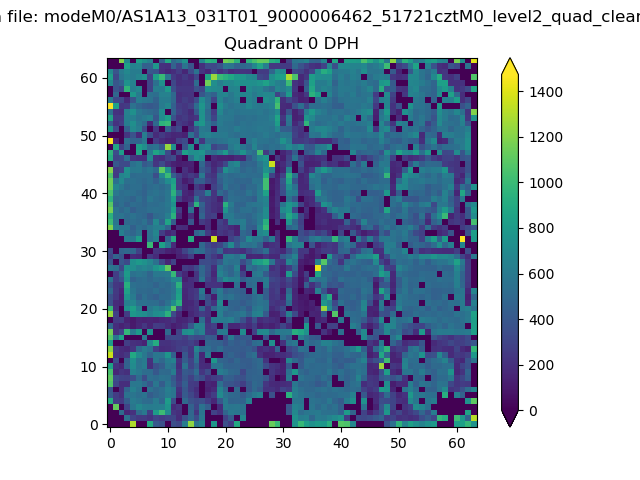 |
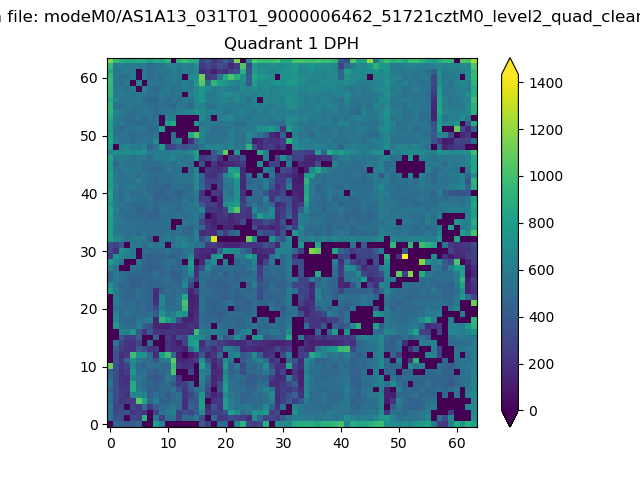 |
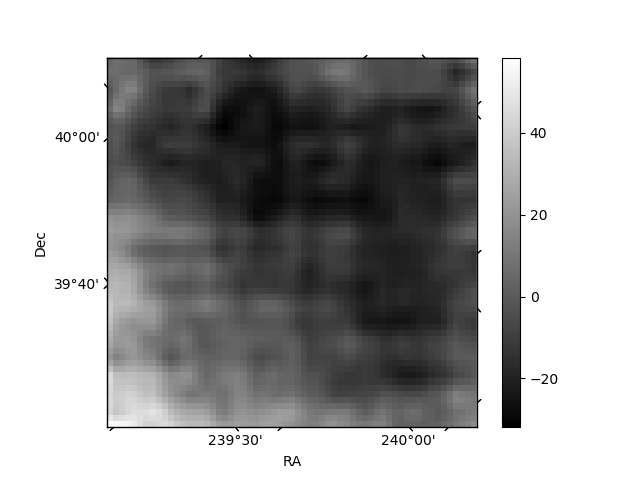
Quadrant B |
|---|---|---|---|
| Quadrant D | 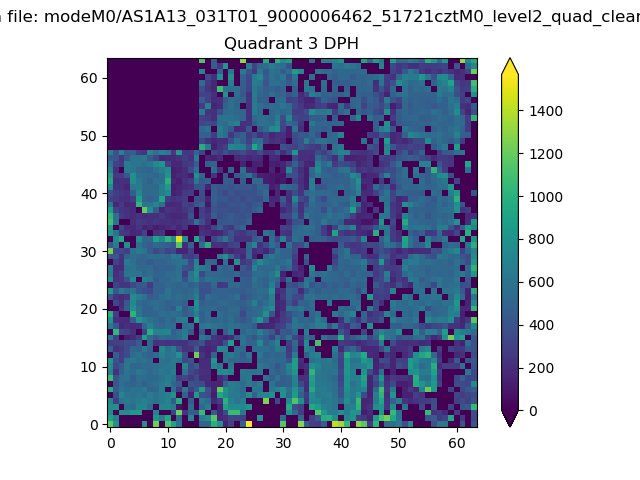 |
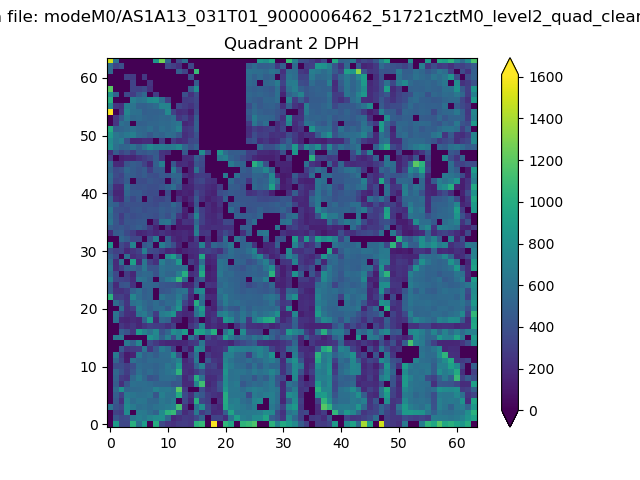 |
Quadrant C |
| Plot type | Count rate plots | Images |
|---|---|---|
| Comparison with Poisson distribution Blue bars denote a histogram of data divided into 1 sec bins. Red curve is a Poisson curve with rate = median count rate of data. |
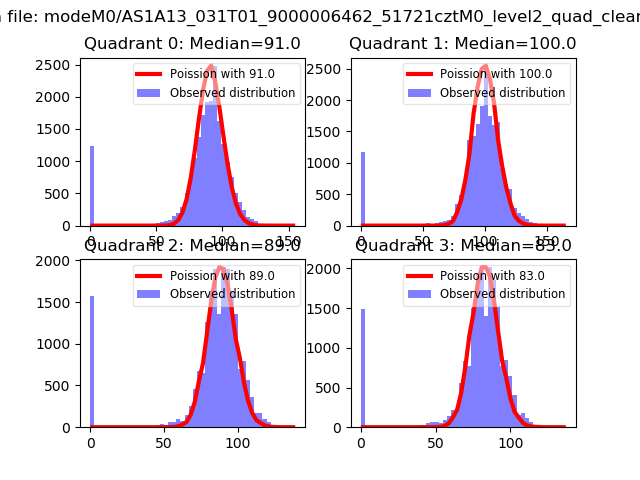 |
 |
| Quadrant-wise count rates Data is divided into 100 sec bins |
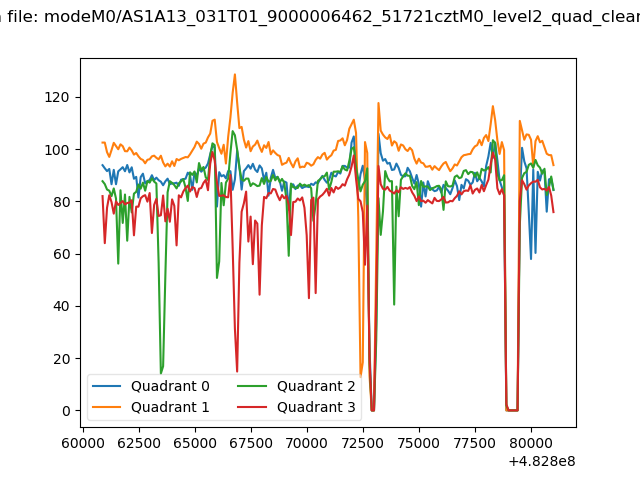 |
|
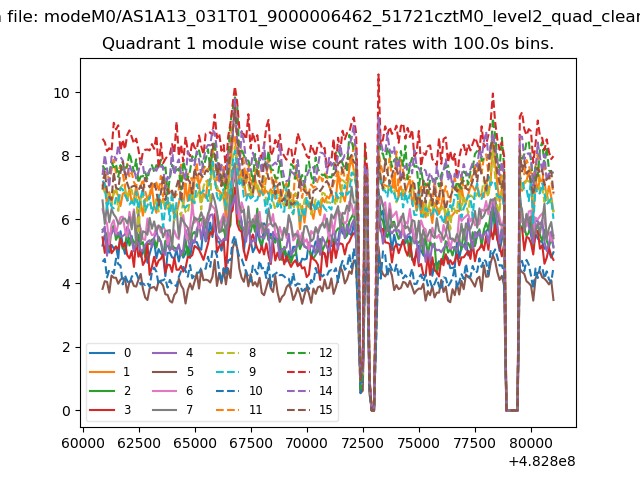
| Module-wise count rates for Quadrant A Data is divided into 100 sec bins |
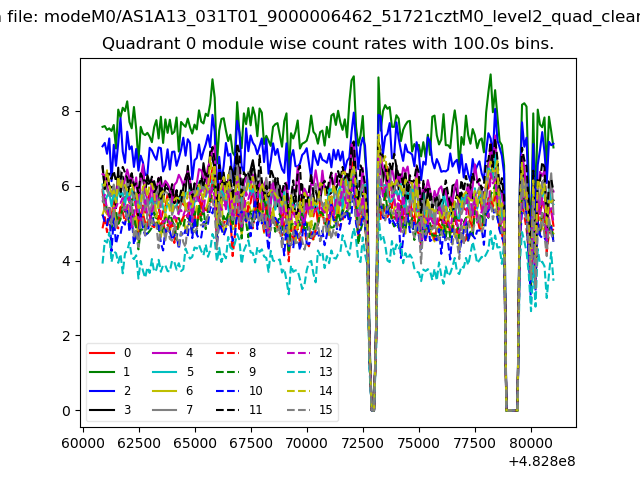 |
 |
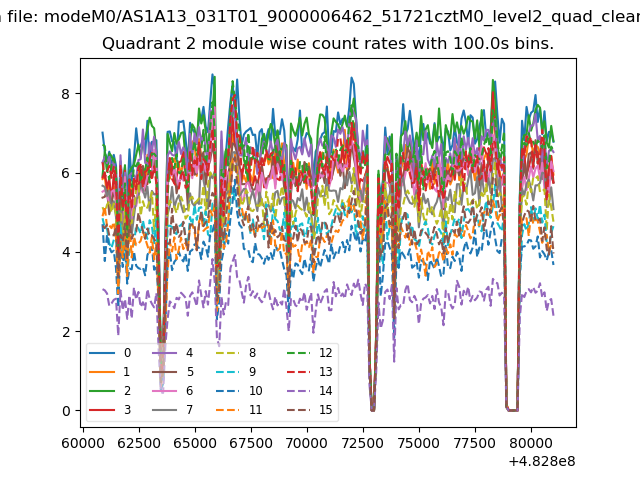
| Module-wise count rates for Quadrant B Data is divided into 100 sec bins |
 |
 |
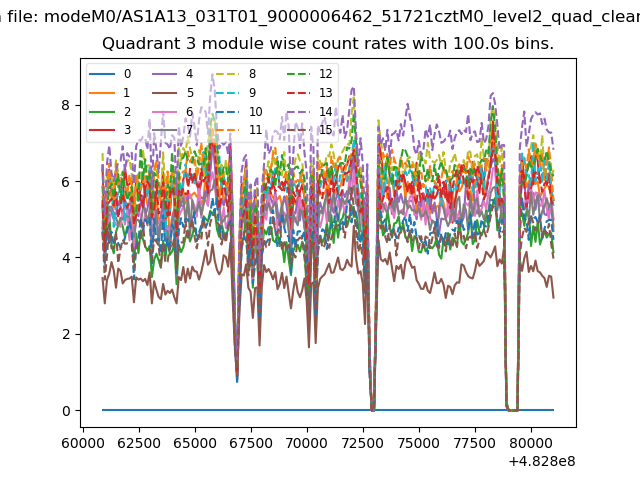
| Module-wise count rates for Quadrant C Data is divided into 100 sec bins |
 |
 |
| Module-wise count rates for Quadrant D Data is divided into 100 sec bins |
 |
 |
| Parameter | Plot |
|---|---|
| CZT HV Monitor | 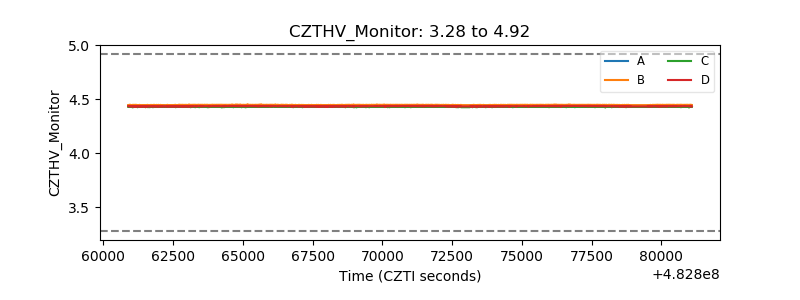 |
| D_VDD | 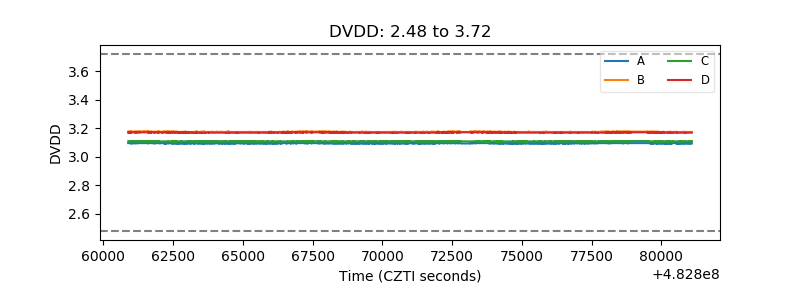 |
| Temperature 1 | 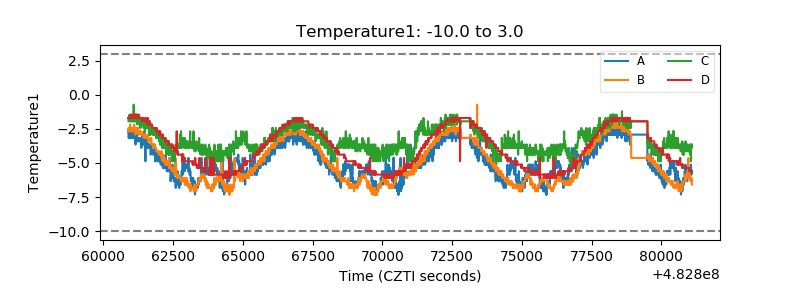 |
| Veto HV Monitor | 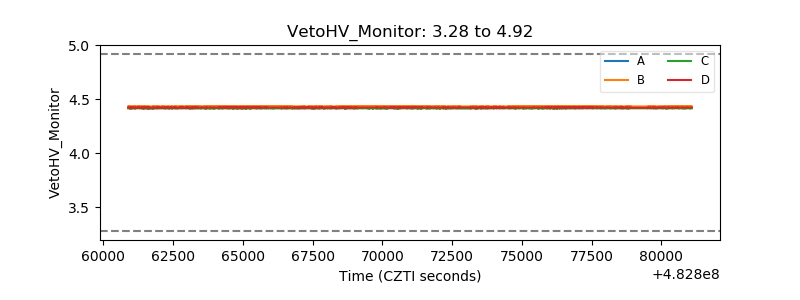 |
| Veto LLD | 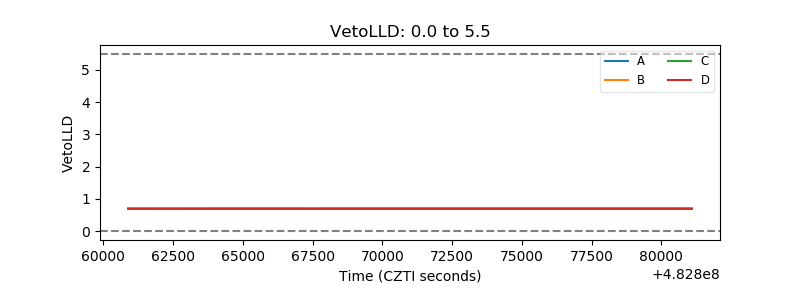 |
| Alpha Counter | 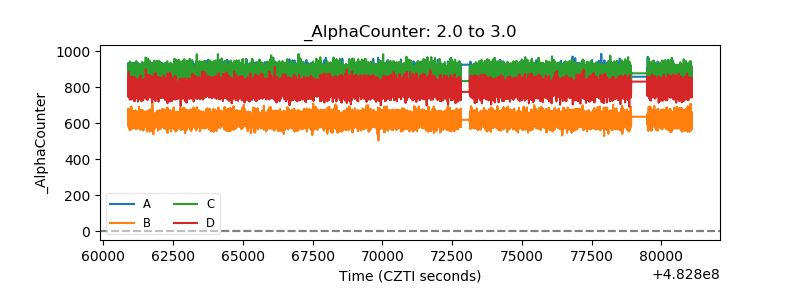 |
| _CPM_Rate | 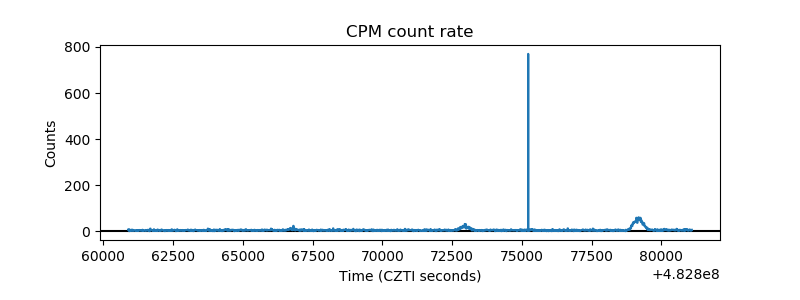 |
| CZT Counter | 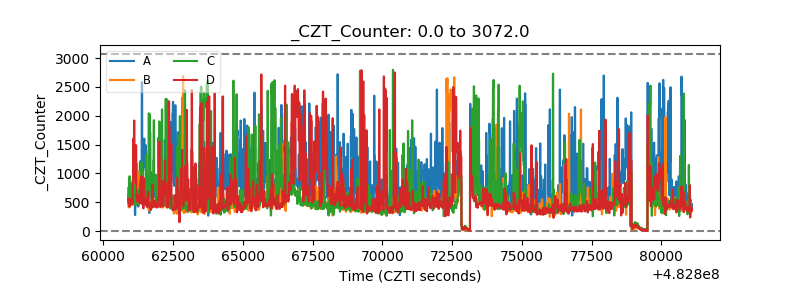 |
| +2.5 Volts monitor | 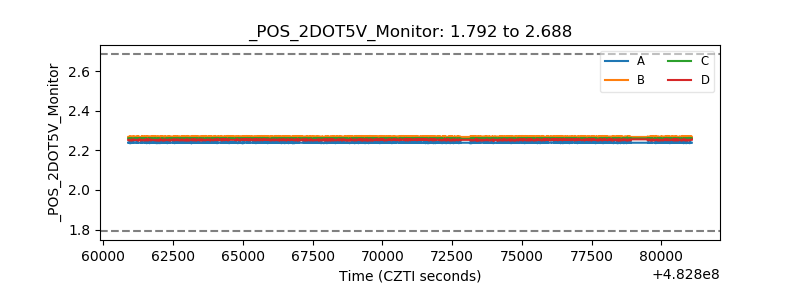 |
| +5 Volts monitor | 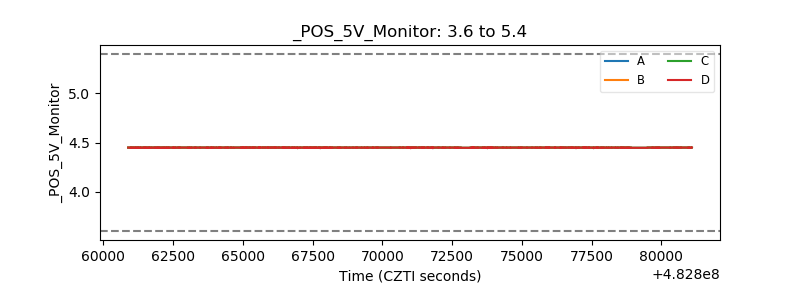 |
| _ROLL_ROT | 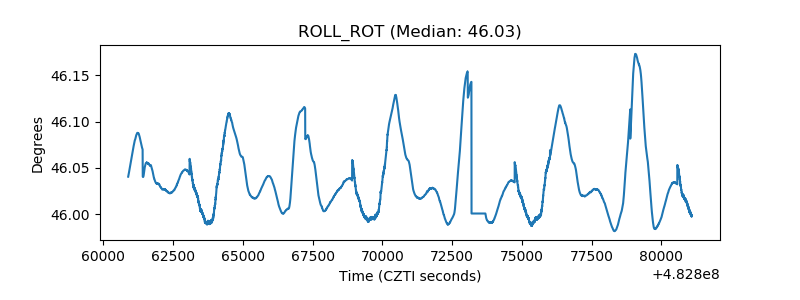 |
| _Roll_DEC | 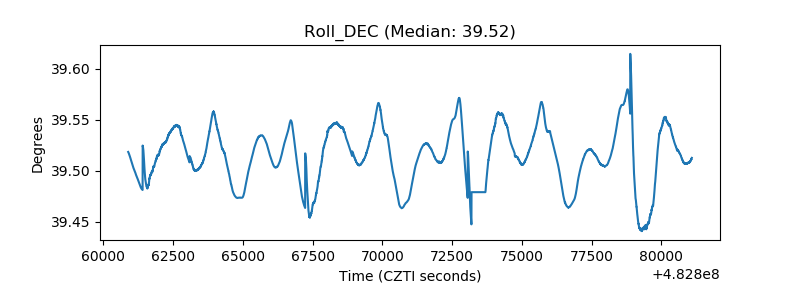 |
| _Roll_RA | 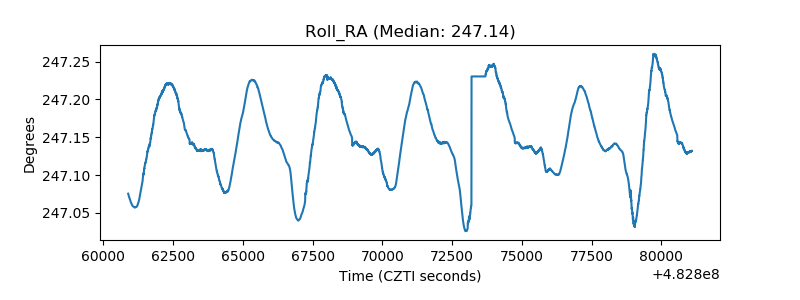 |
| Veto Counter |  |