| Param | Original file | Final file |
|---|---|---|
| Filename | modeM0/AS1A13_031T01_9000006462_51722cztM0_level2.fits | modeM0/AS1A13_031T01_9000006462_51722cztM0_level2_quad_clean.evt |
| Size (bytes) | 497,180,160 | 97,197,120 |
| Size | 474.1 MB | 92.7 MB |
| Events in quadrant A | 6,706,818 | 566,254 |
| Events in quadrant B | 3,578,434 | 690,300 |
| Events in quadrant C | 3,889,436 | 624,041 |
| Events in quadrant D | 3,696,496 | 584,300 |
| Mode M9 | |||
|---|---|---|---|
| Quadrant | BADHDUFLAG | Total packets | Discarded packets |
| A | 0 | 12 | 0 |
| B | 0 | 13 | 0 |
| C | 0 | 13 | 0 |
| D | 0 | 13 | 0 |
| Mode M0 | |||
|---|---|---|---|
| Quadrant | BADHDUFLAG | Total packets | Discarded packets |
| A | 0 | 24763 | 3 |
| B | 0 | 15651 | 2 |
| C | 0 | 16477 | 2 |
| D | 0 | 16072 | 2 |
| Mode SS | |||
|---|---|---|---|
| Quadrant | BADHDUFLAG | Total packets | Discarded packets |
| A | 0 | 140 | 0 |
| B | 0 | 140 | 0 |
| C | 0 | 140 | 0 |
| D | 0 | 140 | 0 |
| Quadrant | Total seconds | Saturated seconds | Saturation percentage |
|---|---|---|---|
| A | 6859 | 865 | 12.611168% |
| B | 6859 | 102 | 1.487097% |
| C | 6859 | 177 | 2.580551% |
| D | 6859 | 121 | 1.764106% |
Noise dominated data is calculated using 1-second bins in cleaned event files. If a bin has >2000 counts, and if more than 50% of those come from <1% of pixels, then it is considered to be noise-dominated and hence unusable.
| Quadrant | # 1 sec bins | Bins with >0 counts | Bins with >2000 counts | High rate bins dominated by noise | Noise dominated (total time) | Noise dominated (detector-on time) | Marked lightcurve |
|---|---|---|---|---|---|---|---|
| A | 7654 | 6860 | 739 | 739 | 9.66% | 10.77% | 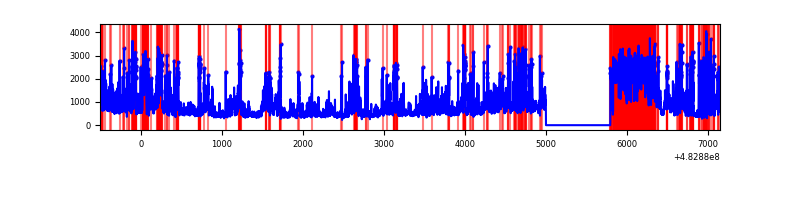 |
| B | 7654 | 6860 | 45 | 45 | 0.59% | 0.66% | 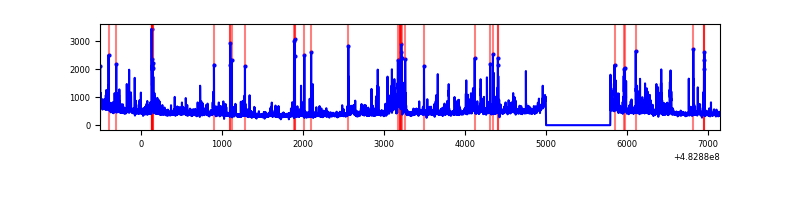 |
| C | 7654 | 6860 | 123 | 123 | 1.61% | 1.79% | 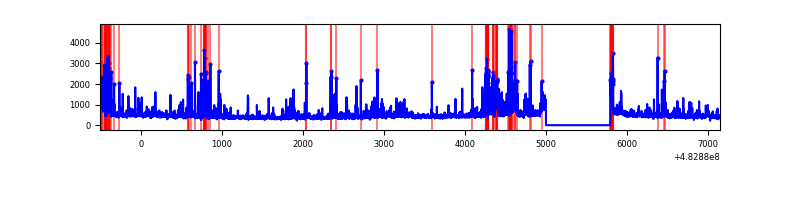 |
| D | 7654 | 6860 | 102 | 102 | 1.33% | 1.49% | 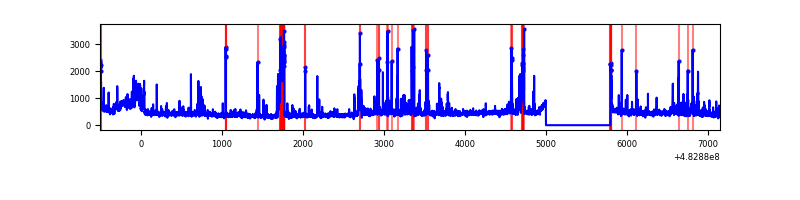 |
Top three noisy pixels from each quadrant. If the there are fewer than three noisy pixels in the level2.evt file, extra rows are filled as -1
| Pixel properties | Quadrant properties | ||||||
|---|---|---|---|---|---|---|---|
| Quadrant | DetID | PixID | Counts | Sigma | Mean | Median | Sigma |
| A | 4 | 175 | 1611439 | 9676.74 | 679 | 663 | 166.5 |
| A | 0 | 111 | 804022 | 4826.18 | 679 | 663 | 166.5 |
| A | 8 | 248 | 674165 | 4046.06 | 679 | 663 | 166.5 |
| B | 1 | 223 | 206702 | 1327.66 | 718 | 693 | 155.2 |
| B | 9 | 223 | 129346 | 829.13 | 718 | 693 | 155.2 |
| B | 0 | 213 | 68819 | 439.05 | 718 | 693 | 155.2 |
| C | 9 | 38 | 354871 | 1828.17 | 707 | 702 | 193.7 |
| C | 13 | 3 | 238356 | 1226.74 | 707 | 702 | 193.7 |
| C | 1 | 243 | 103789 | 532.12 | 707 | 702 | 193.7 |
| D | 8 | 176 | 473039 | 2396.26 | 698 | 674 | 197.1 |
| D | 11 | 176 | 130145 | 656.79 | 698 | 674 | 197.1 |
| D | 2 | 249 | 96849 | 487.89 | 698 | 674 | 197.1 |
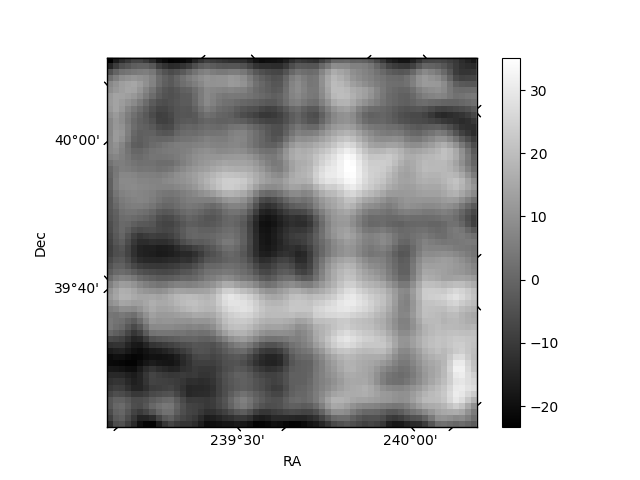
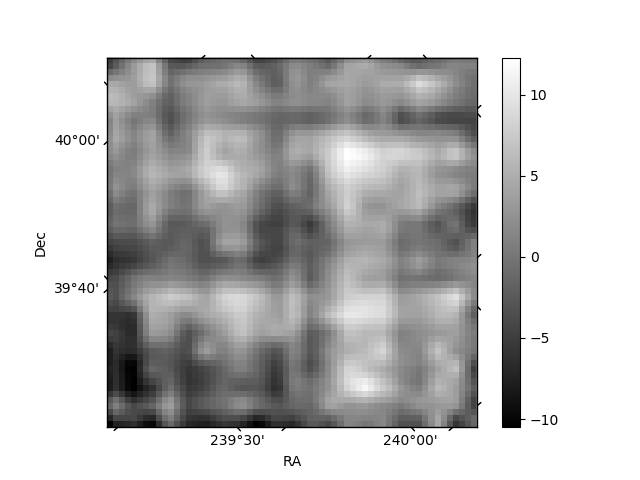
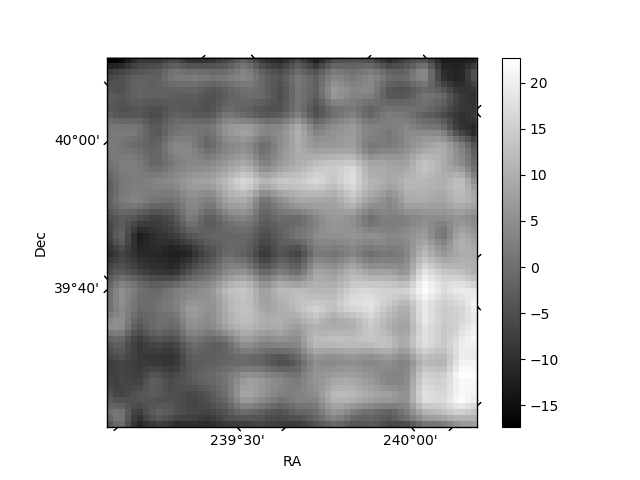
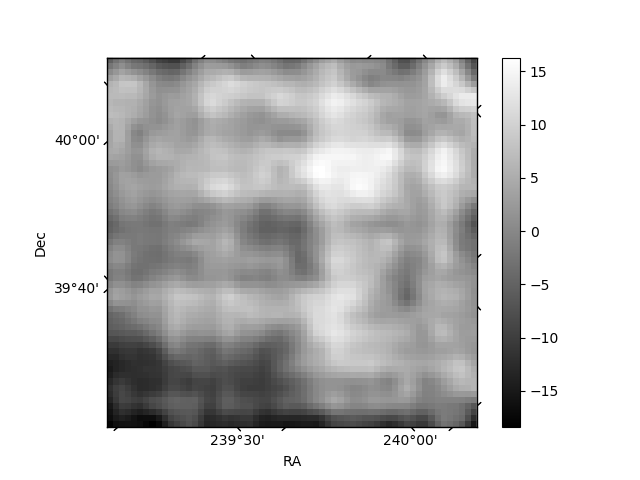
Histogram calculated using DETX and DETY for each event in the final _common_clean file
| Quadrant A | 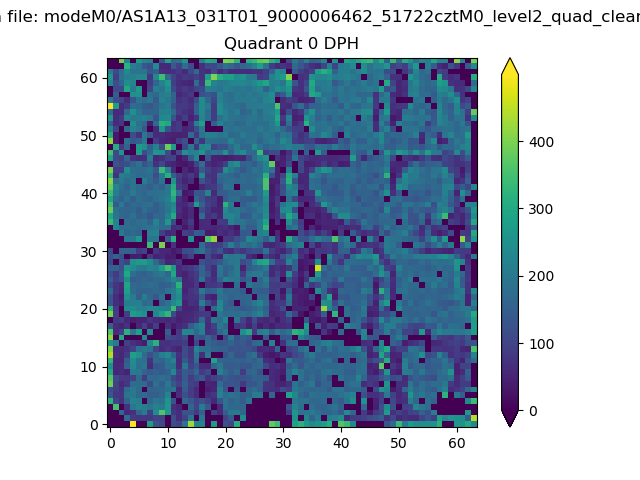 |
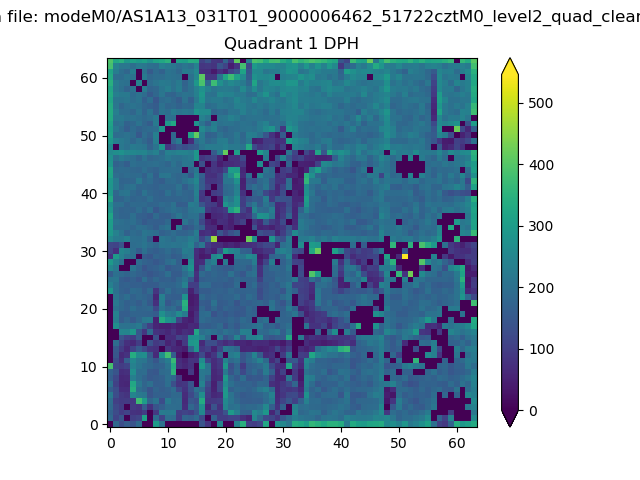 |
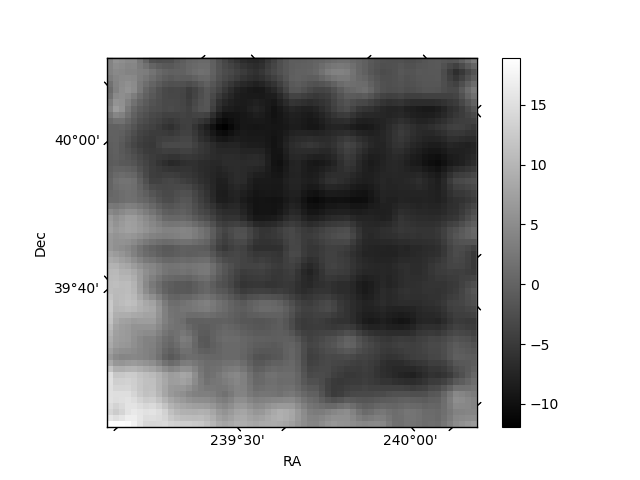
Quadrant B |
|---|---|---|---|
| Quadrant D | 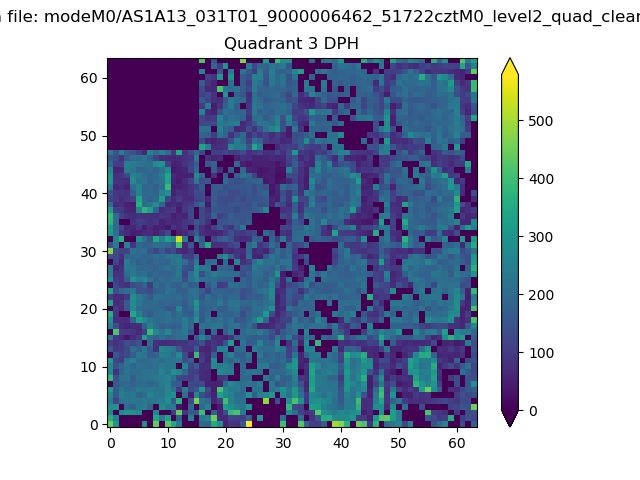 |
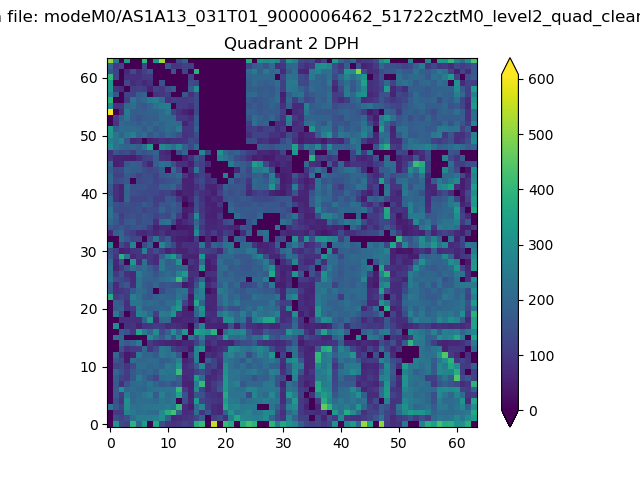 |
Quadrant C |
| Plot type | Count rate plots | Images |
|---|---|---|
| Comparison with Poisson distribution Blue bars denote a histogram of data divided into 1 sec bins. Red curve is a Poisson curve with rate = median count rate of data. |
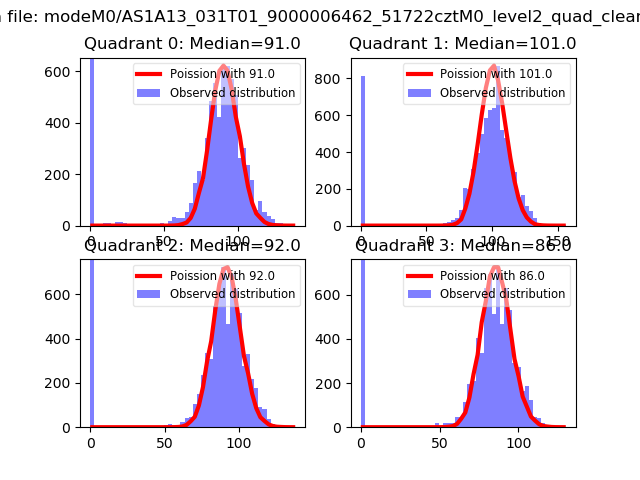 |
 |
| Quadrant-wise count rates Data is divided into 100 sec bins |
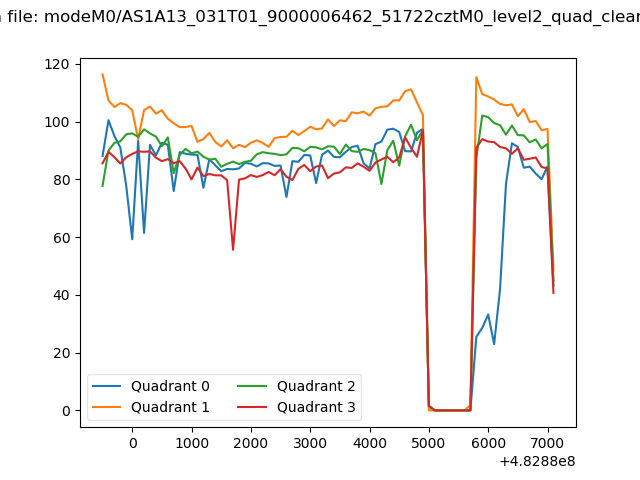 |
|
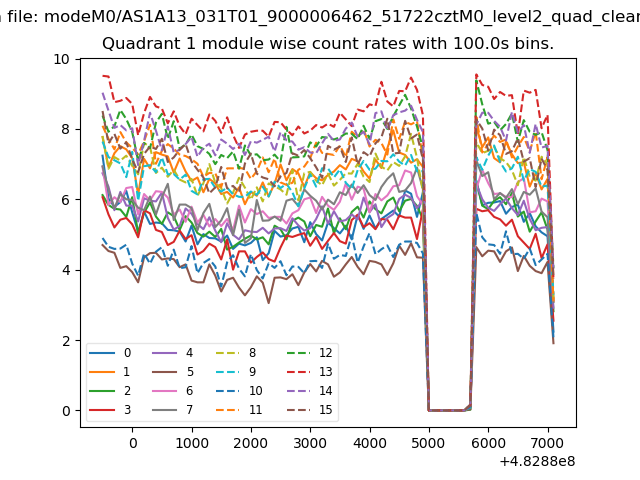
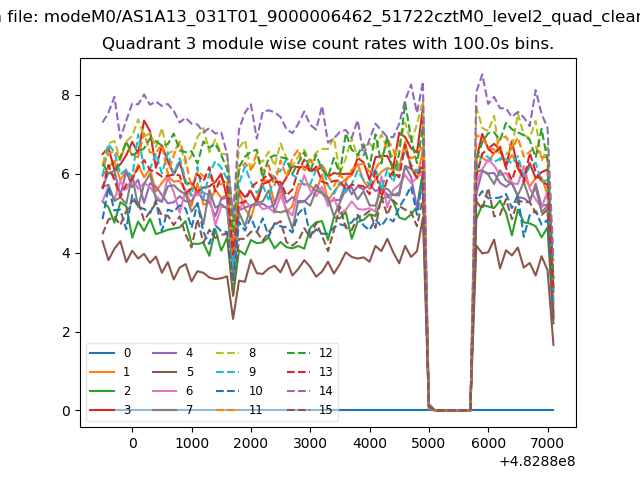
| Module-wise count rates for Quadrant A Data is divided into 100 sec bins |
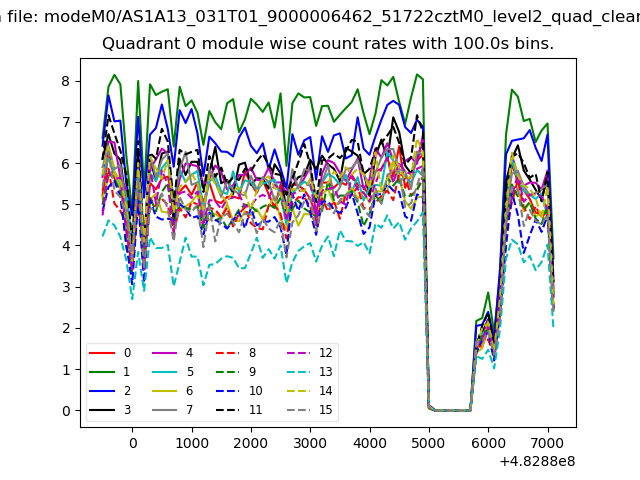 |
 |
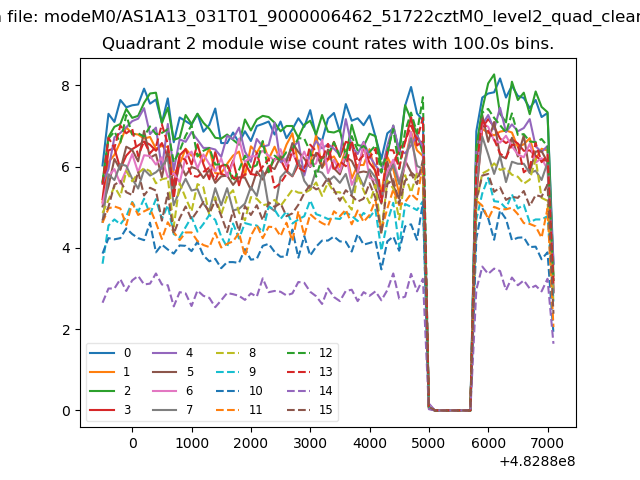
| Module-wise count rates for Quadrant B Data is divided into 100 sec bins |
 |
 |
| Module-wise count rates for Quadrant C Data is divided into 100 sec bins |
 |
 |
| Module-wise count rates for Quadrant D Data is divided into 100 sec bins |
 |
 |
| Parameter | Plot |
|---|---|
| CZT HV Monitor | 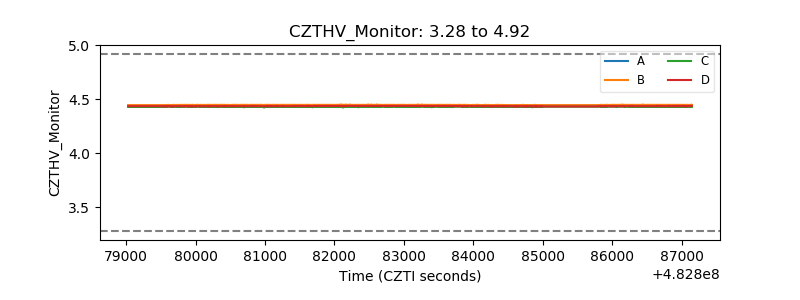 |
| D_VDD | 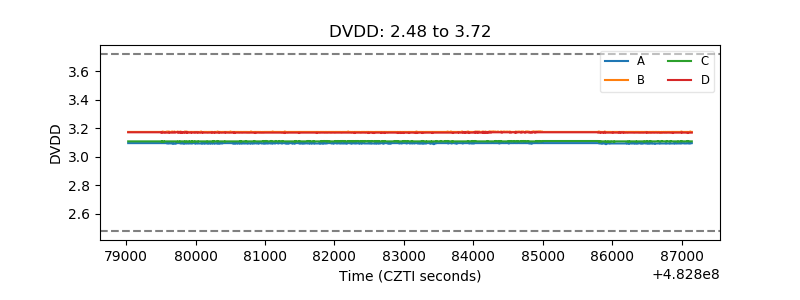 |
| Temperature 1 | 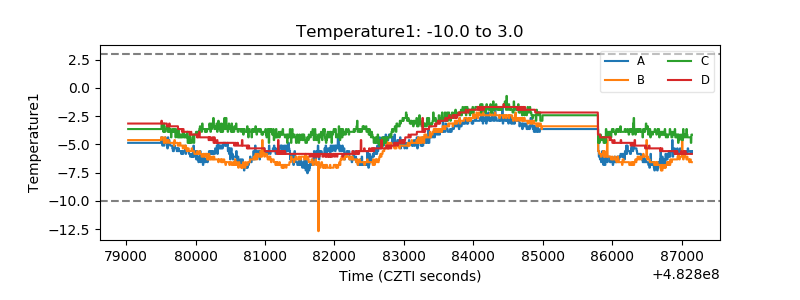 |
| Veto HV Monitor |  |
| Veto LLD | 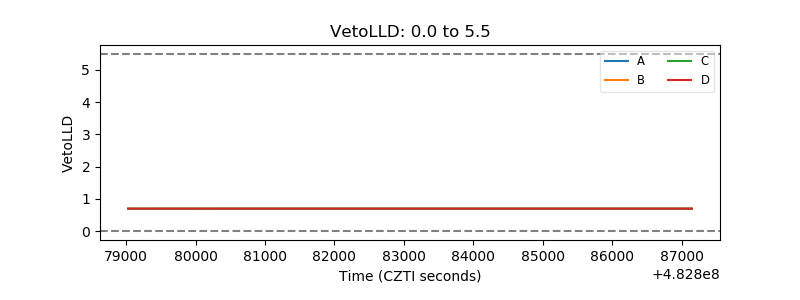 |
| Alpha Counter | 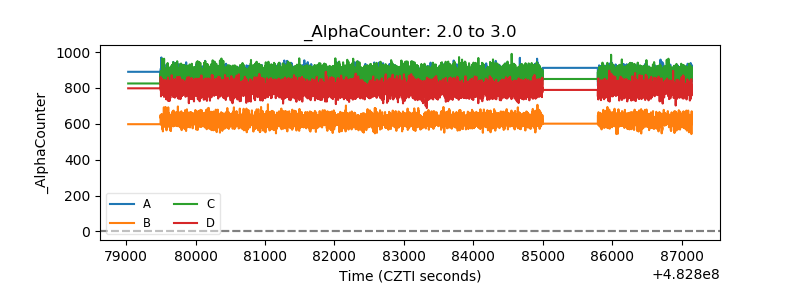 |
| _CPM_Rate | 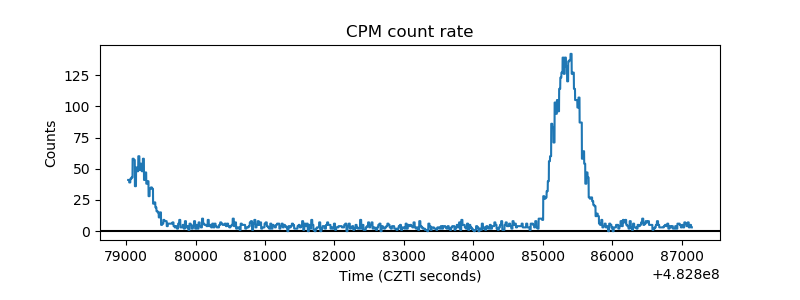 |
| CZT Counter | 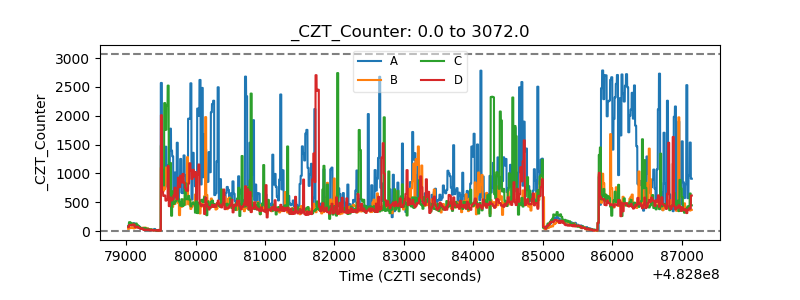 |
| +2.5 Volts monitor | 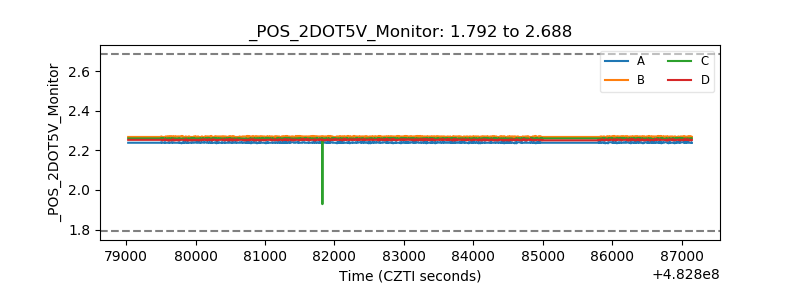 |
| +5 Volts monitor | 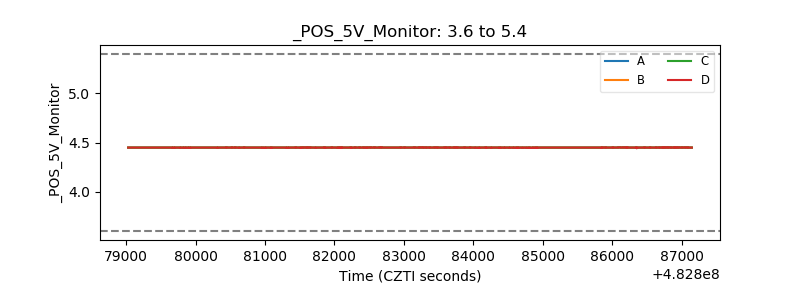 |
| _ROLL_ROT | 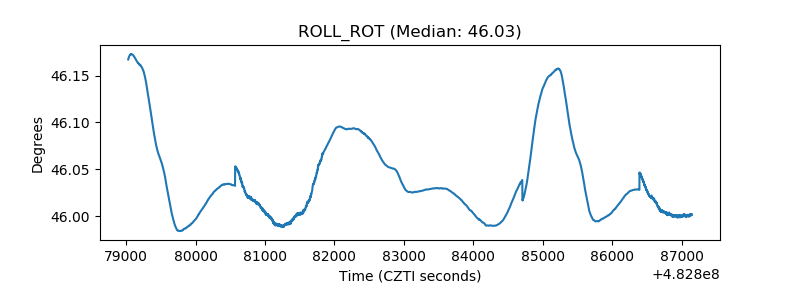 |
| _Roll_DEC | 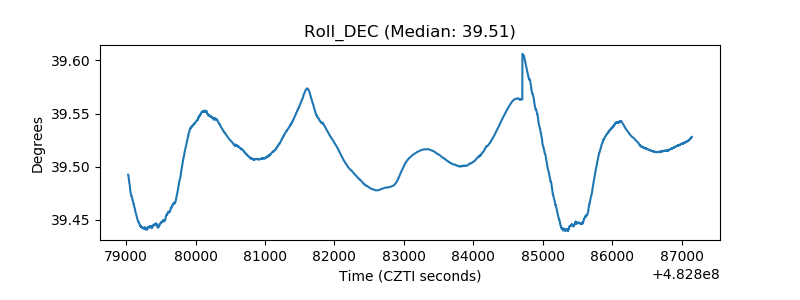 |
| _Roll_RA | 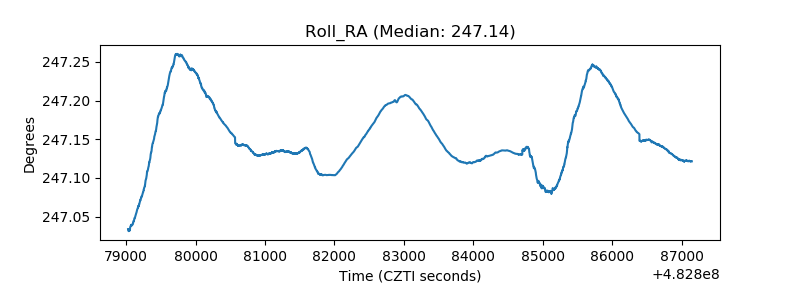 |
| Veto Counter | 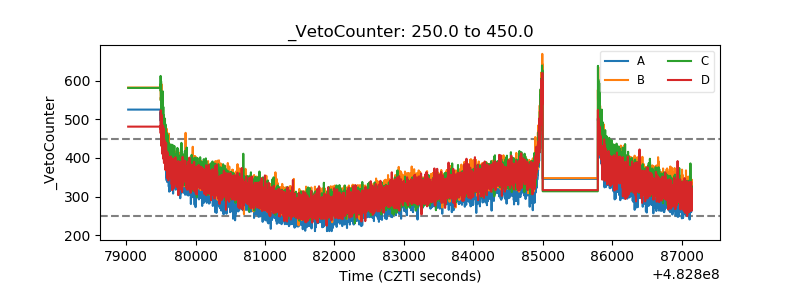 |