| Param | Original file | Final file |
|---|---|---|
| Filename | modeM0/AS1A13_031T01_9000006462_51723cztM0_level2.fits | modeM0/AS1A13_031T01_9000006462_51723cztM0_level2_quad_clean.evt |
| Size (bytes) | 532,342,080 | 101,603,520 |
| Size | 507.7 MB | 96.9 MB |
| Events in quadrant A | 6,542,296 | 607,073 |
| Events in quadrant B | 3,571,691 | 724,212 |
| Events in quadrant C | 5,453,135 | 631,776 |
| Events in quadrant D | 3,582,809 | 615,161 |
| Mode M9 | |||
|---|---|---|---|
| Quadrant | BADHDUFLAG | Total packets | Discarded packets |
| A | 0 | 18 | 0 |
| B | 0 | 18 | 0 |
| C | 0 | 18 | 0 |
| D | 0 | 18 | 0 |
| Mode M0 | |||
|---|---|---|---|
| Quadrant | BADHDUFLAG | Total packets | Discarded packets |
| A | 0 | 24471 | 2 |
| B | 0 | 15893 | 2 |
| C | 0 | 21182 | 3 |
| D | 0 | 16082 | 2 |
| Mode SS | |||
|---|---|---|---|
| Quadrant | BADHDUFLAG | Total packets | Discarded packets |
| A | 0 | 146 | 0 |
| B | 0 | 146 | 0 |
| C | 0 | 146 | 0 |
| D | 0 | 146 | 0 |
| Quadrant | Total seconds | Saturated seconds | Saturation percentage |
|---|---|---|---|
| A | 7155 | 763 | 10.663871% |
| B | 7156 | 109 | 1.523197% |
| C | 7155 | 514 | 7.183788% |
| D | 7155 | 88 | 1.229909% |
Noise dominated data is calculated using 1-second bins in cleaned event files. If a bin has >2000 counts, and if more than 50% of those come from <1% of pixels, then it is considered to be noise-dominated and hence unusable.
| Quadrant | # 1 sec bins | Bins with >0 counts | Bins with >2000 counts | High rate bins dominated by noise | Noise dominated (total time) | Noise dominated (detector-on time) | Marked lightcurve |
|---|---|---|---|---|---|---|---|
| A | 8875 | 7157 | 636 | 636 | 7.17% | 8.89% | 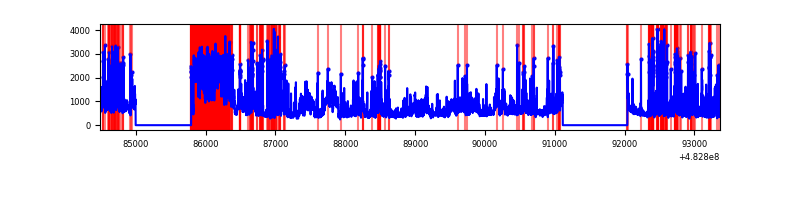 |
| B | 8876 | 7157 | 43 | 43 | 0.48% | 0.60% | 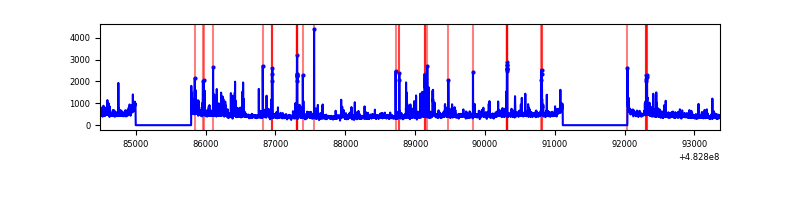 |
| C | 8875 | 7157 | 451 | 451 | 5.08% | 6.30% | 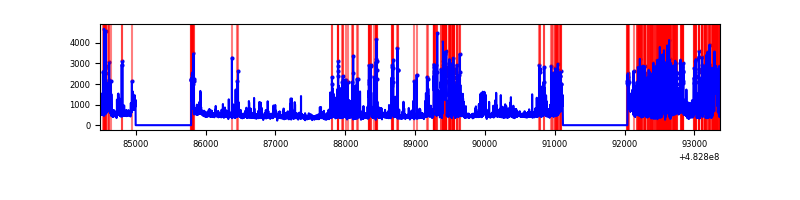 |
| D | 8875 | 7157 | 70 | 70 | 0.79% | 0.98% | 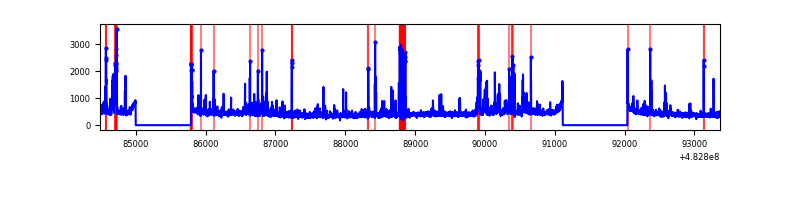 |
Top three noisy pixels from each quadrant. If the there are fewer than three noisy pixels in the level2.evt file, extra rows are filled as -1
| Pixel properties | Quadrant properties | ||||||
|---|---|---|---|---|---|---|---|
| Quadrant | DetID | PixID | Counts | Sigma | Mean | Median | Sigma |
| A | 4 | 175 | 1275792 | 7188.16 | 723 | 705 | 177.4 |
| A | 11 | 3 | 714684 | 4024.97 | 723 | 705 | 177.4 |
| A | 8 | 248 | 581364 | 3273.4 | 723 | 705 | 177.4 |
| B | 1 | 223 | 107863 | 664.9 | 753 | 726 | 161.1 |
| B | 9 | 223 | 92027 | 566.62 | 753 | 726 | 161.1 |
| B | 10 | 41 | 90946 | 559.91 | 753 | 726 | 161.1 |
| C | 9 | 38 | 1016694 | 5097.44 | 729 | 722 | 199.3 |
| C | 0 | 192 | 553197 | 2771.93 | 729 | 722 | 199.3 |
| C | 12 | 254 | 543414 | 2722.85 | 729 | 722 | 199.3 |
| D | 8 | 176 | 318192 | 1552.2 | 732 | 706 | 204.5 |
| D | 3 | 12 | 82239 | 398.62 | 732 | 706 | 204.5 |
| D | 2 | 249 | 57556 | 277.94 | 732 | 706 | 204.5 |
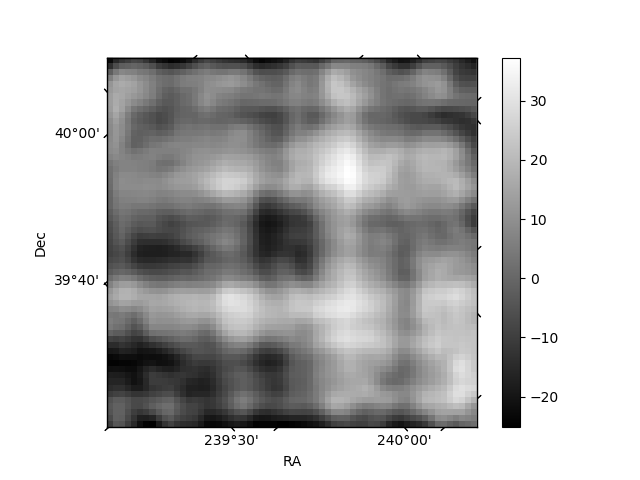
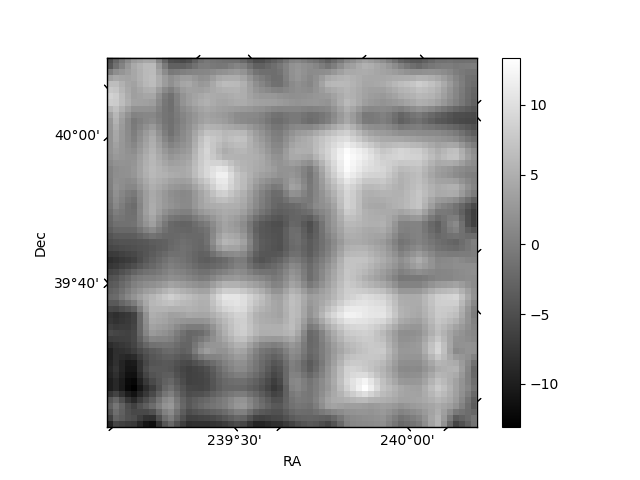
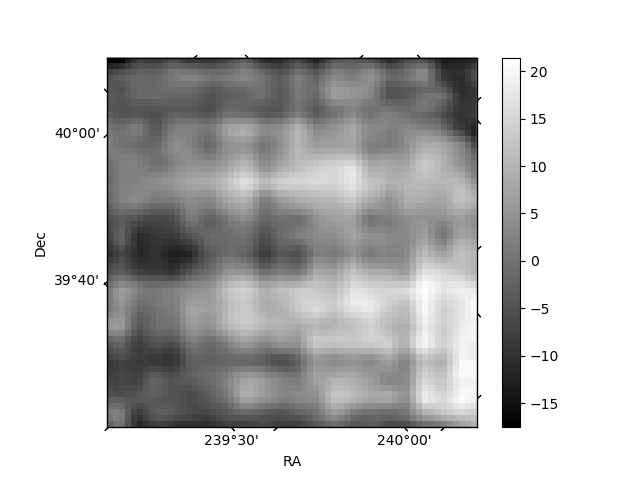
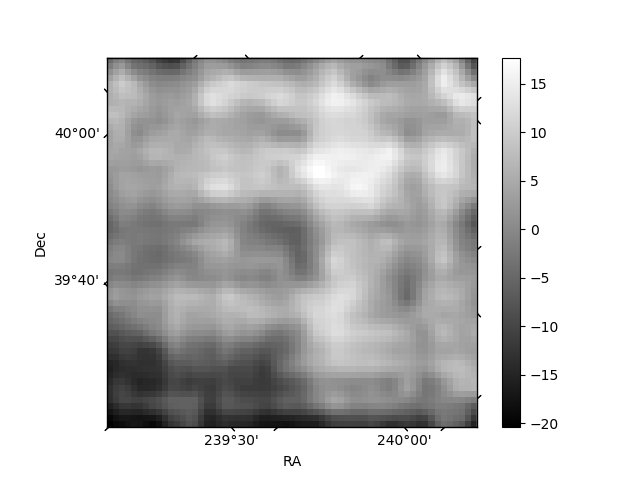
Histogram calculated using DETX and DETY for each event in the final _common_clean file
| Quadrant A | 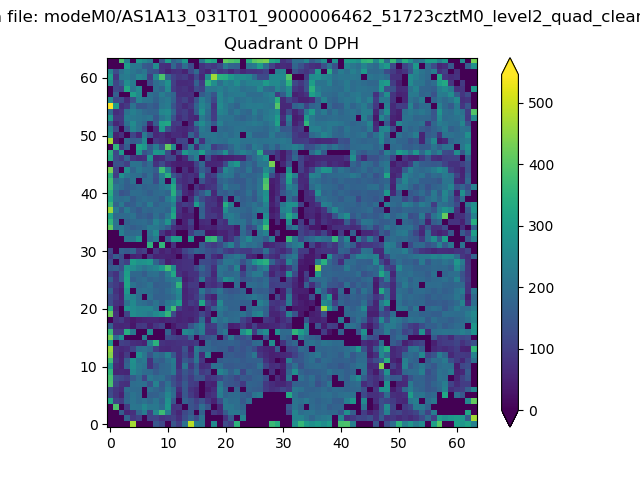 |
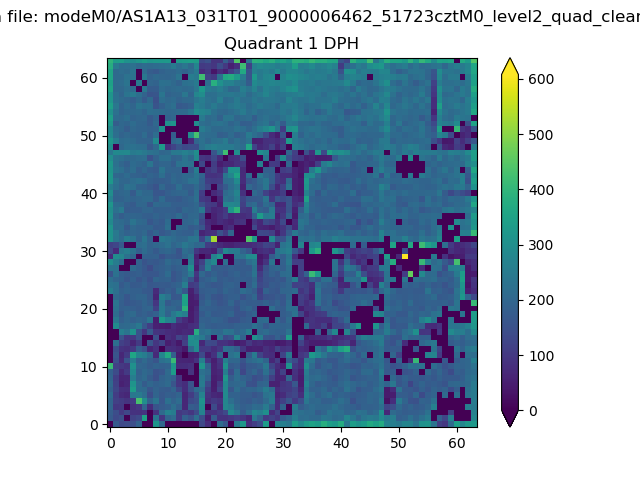 |
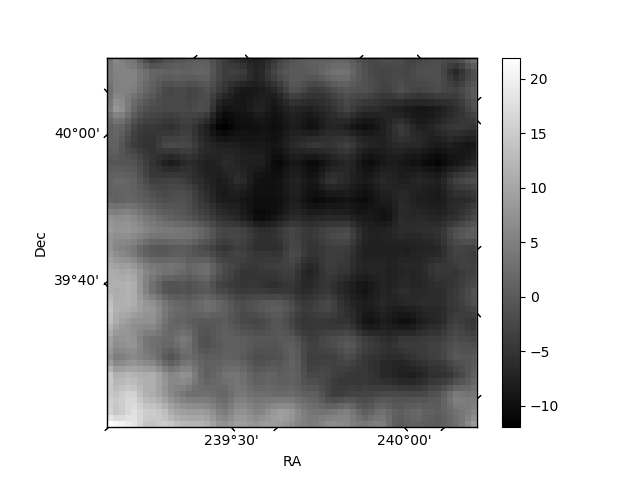
Quadrant B |
|---|---|---|---|
| Quadrant D | 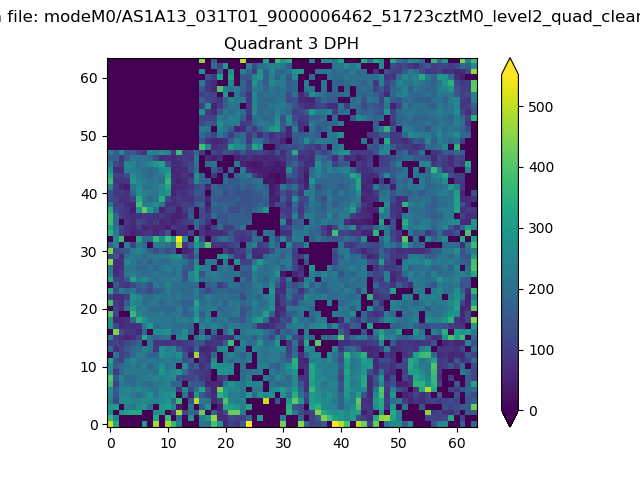 |
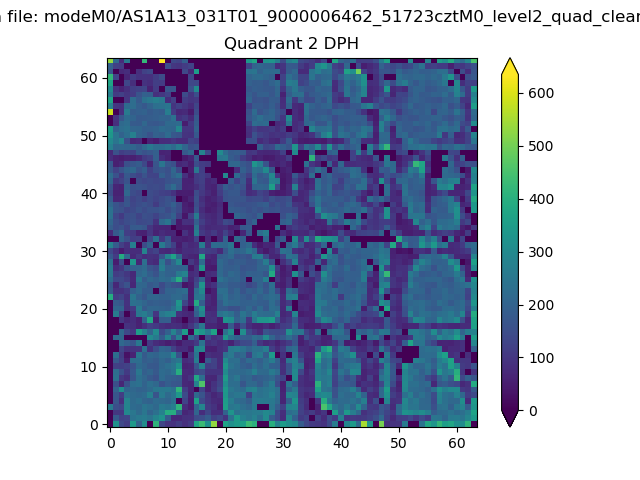 |
Quadrant C |
| Plot type | Count rate plots | Images |
|---|---|---|
| Comparison with Poisson distribution Blue bars denote a histogram of data divided into 1 sec bins. Red curve is a Poisson curve with rate = median count rate of data. |
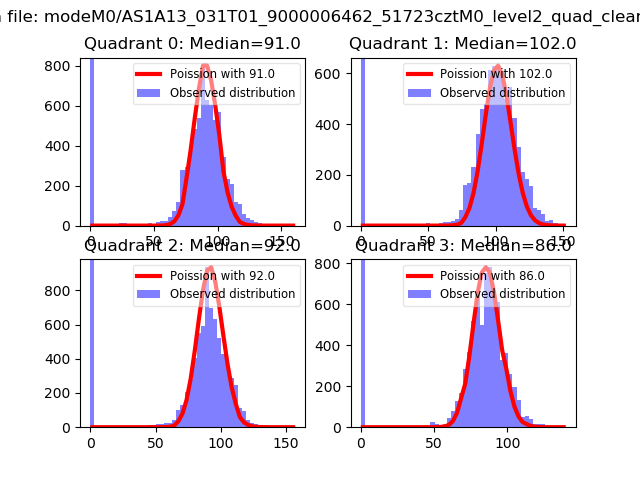 |
 |
| Quadrant-wise count rates Data is divided into 100 sec bins |
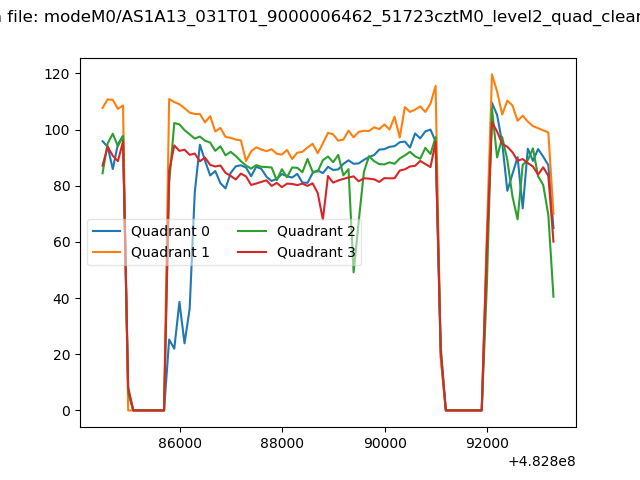 |
|
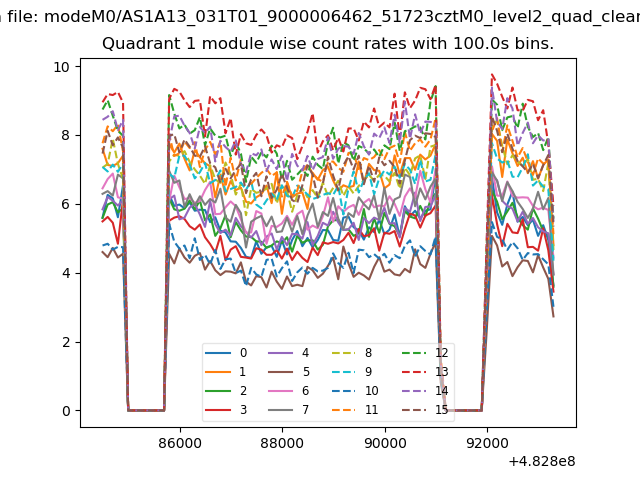
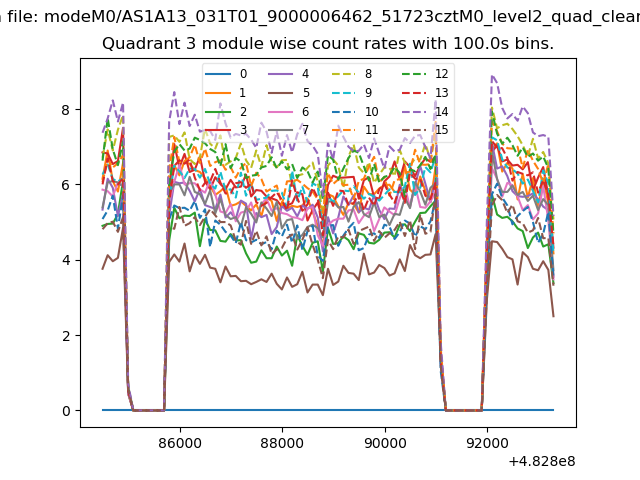
| Module-wise count rates for Quadrant A Data is divided into 100 sec bins |
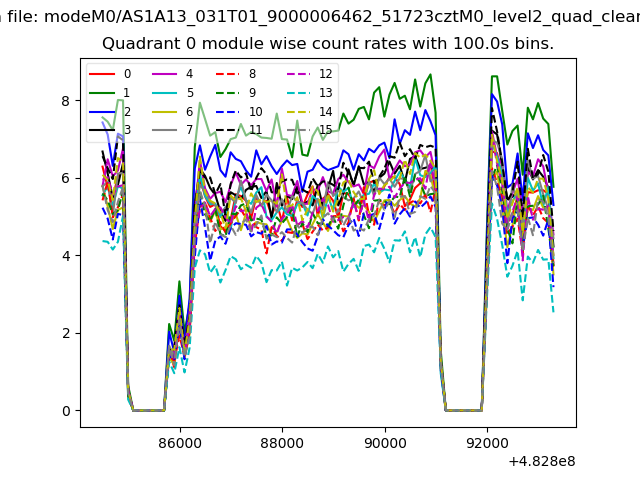 |
 |
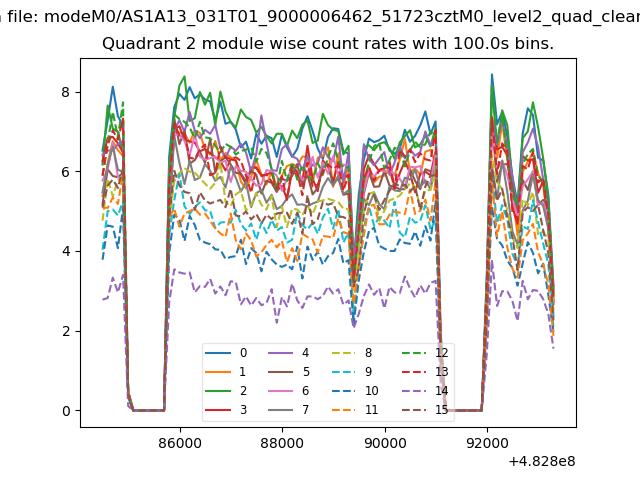
| Module-wise count rates for Quadrant B Data is divided into 100 sec bins |
 |
 |
| Module-wise count rates for Quadrant C Data is divided into 100 sec bins |
 |
 |
| Module-wise count rates for Quadrant D Data is divided into 100 sec bins |
 |
 |
| Parameter | Plot |
|---|---|
| CZT HV Monitor | 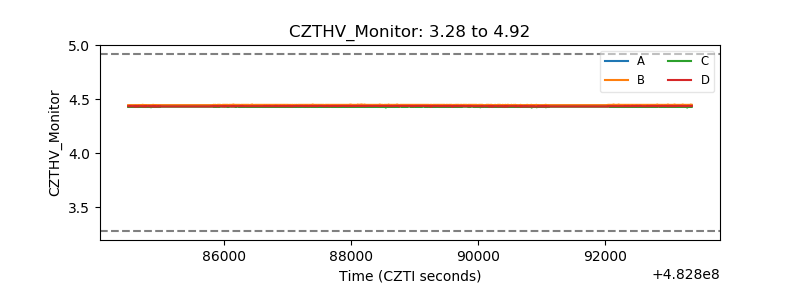 |
| D_VDD | 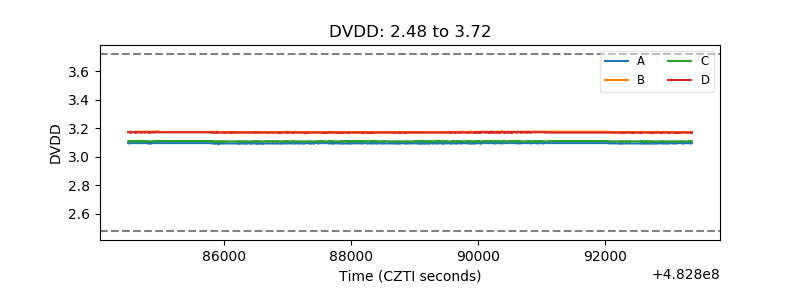 |
| Temperature 1 | 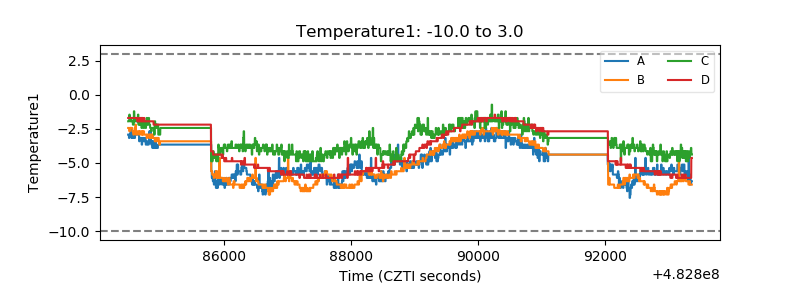 |
| Veto HV Monitor | 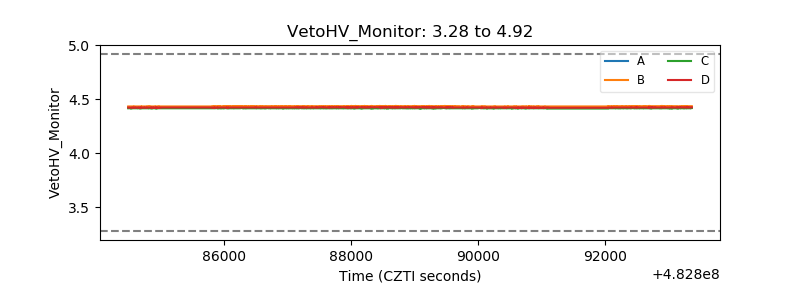 |
| Veto LLD | 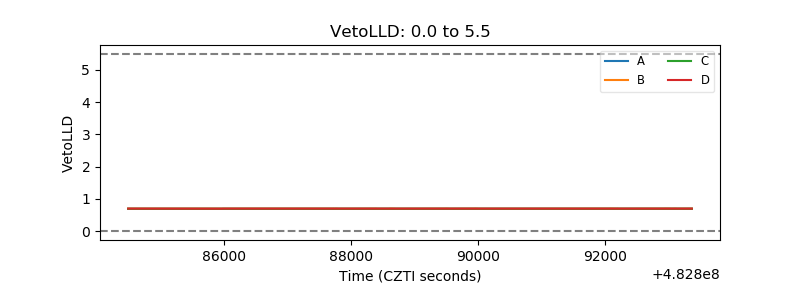 |
| Alpha Counter | 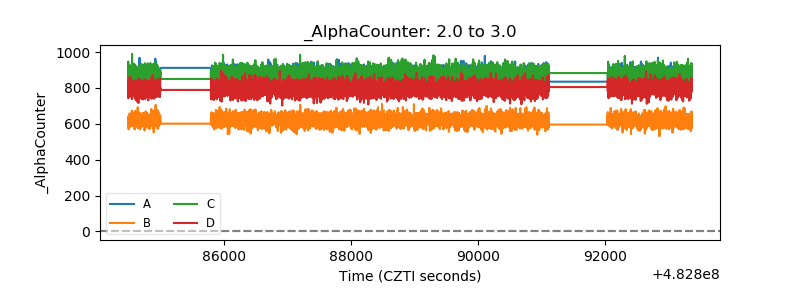 |
| _CPM_Rate | 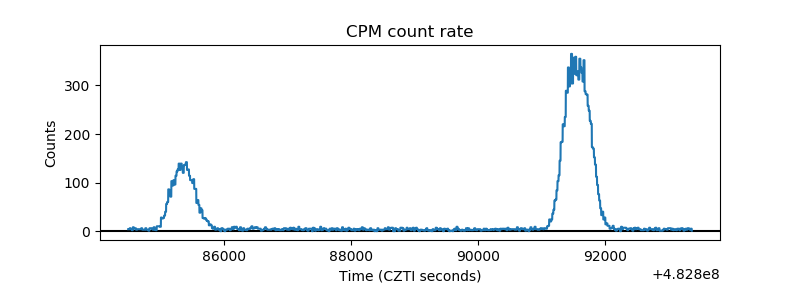 |
| CZT Counter | 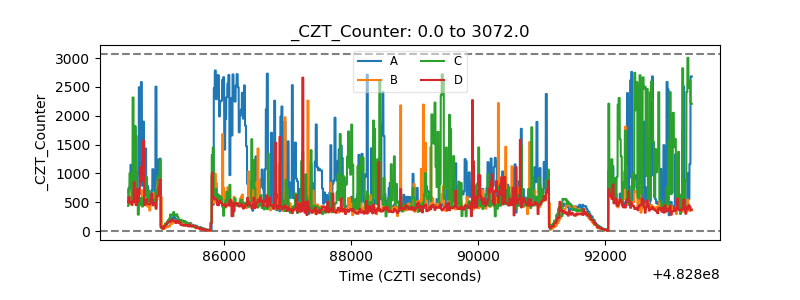 |
| +2.5 Volts monitor | 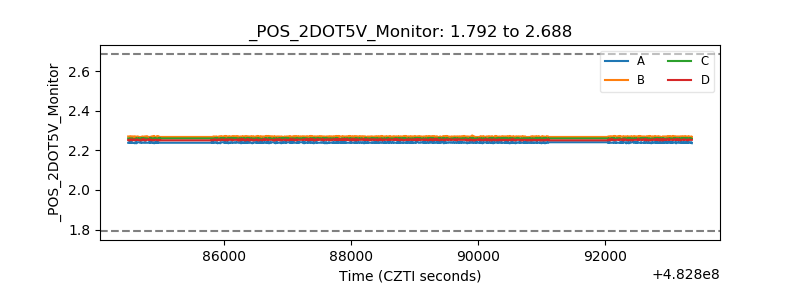 |
| +5 Volts monitor | 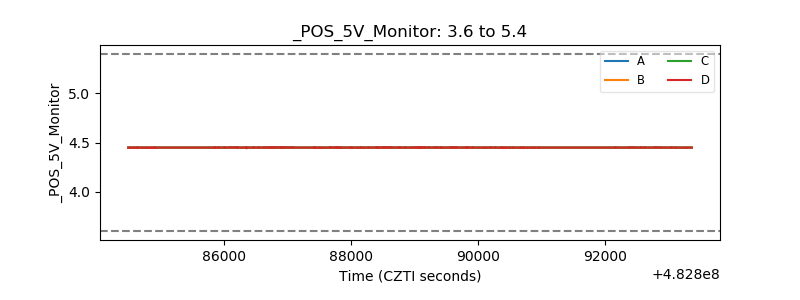 |
| _ROLL_ROT | 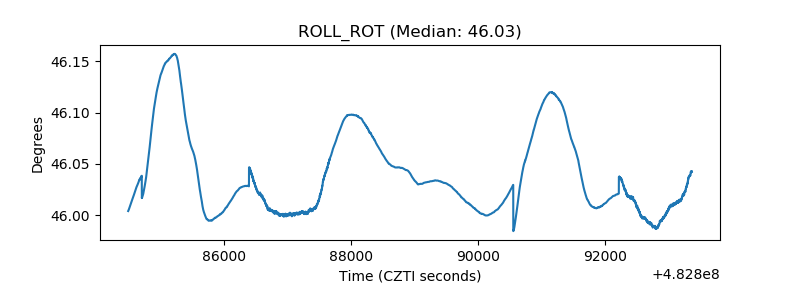 |
| _Roll_DEC |  |
| _Roll_RA | 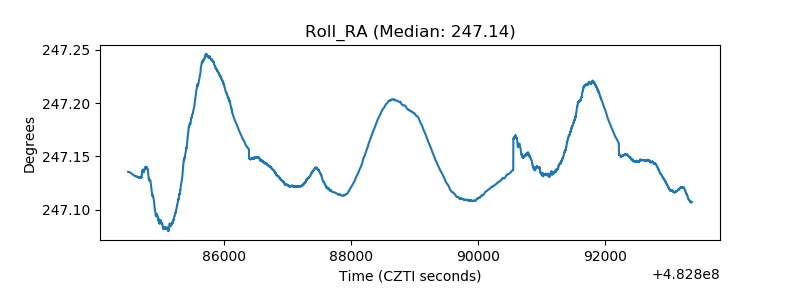 |
| Veto Counter | 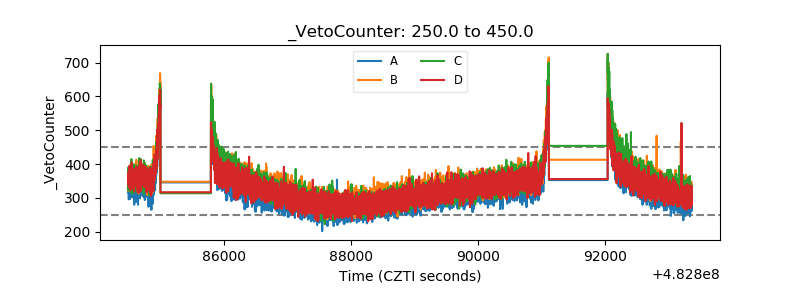 |