| Param | Original file | Final file |
|---|---|---|
| Filename | modeM0/AS1A13_031T01_9000006462_51726cztM0_level2.fits | modeM0/AS1A13_031T01_9000006462_51726cztM0_level2_quad_clean.evt |
| Size (bytes) | 507,461,760 | 103,979,520 |
| Size | 484.0 MB | 99.2 MB |
| Events in quadrant A | 3,518,443 | 698,827 |
| Events in quadrant B | 3,961,520 | 746,917 |
| Events in quadrant C | 4,458,522 | 674,909 |
| Events in quadrant D | 6,289,001 | 528,841 |
| Mode M9 | |||
|---|---|---|---|
| Quadrant | BADHDUFLAG | Total packets | Discarded packets |
| A | 0 | 22 | 0 |
| B | 0 | 22 | 0 |
| C | 0 | 22 | 0 |
| D | 0 | 22 | 0 |
| Mode M0 | |||
|---|---|---|---|
| Quadrant | BADHDUFLAG | Total packets | Discarded packets |
| A | 0 | 15442 | 2 |
| B | 0 | 16861 | 2 |
| C | 0 | 18361 | 2 |
| D | 0 | 23682 | 2 |
| Mode SS | |||
|---|---|---|---|
| Quadrant | BADHDUFLAG | Total packets | Discarded packets |
| A | 0 | 148 | 0 |
| B | 0 | 148 | 0 |
| C | 0 | 148 | 0 |
| D | 0 | 148 | 0 |
| Quadrant | Total seconds | Saturated seconds | Saturation percentage |
|---|---|---|---|
| A | 7164 | 56 | 0.781686% |
| B | 7164 | 201 | 2.805695% |
| C | 7164 | 188 | 2.624232% |
| D | 7165 | 1229 | 17.152826% |
Noise dominated data is calculated using 1-second bins in cleaned event files. If a bin has >2000 counts, and if more than 50% of those come from <1% of pixels, then it is considered to be noise-dominated and hence unusable.
| Quadrant | # 1 sec bins | Bins with >0 counts | Bins with >2000 counts | High rate bins dominated by noise | Noise dominated (total time) | Noise dominated (detector-on time) | Marked lightcurve |
|---|---|---|---|---|---|---|---|
| A | 9369 | 7166 | 20 | 20 | 0.21% | 0.28% | 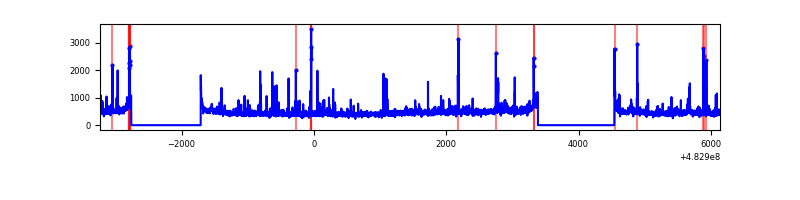 |
| B | 9369 | 7166 | 115 | 115 | 1.23% | 1.60% | 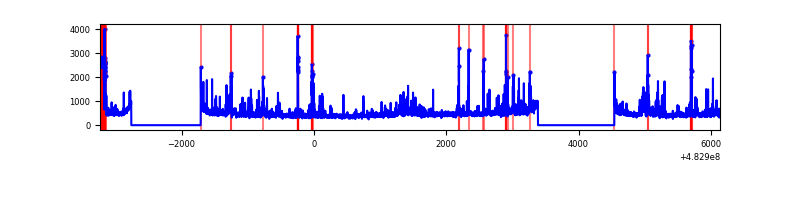 |
| C | 9369 | 7166 | 144 | 144 | 1.54% | 2.01% | 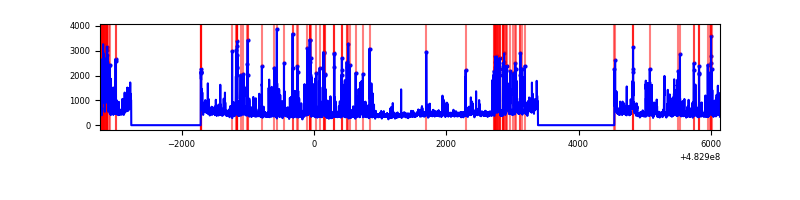 |
| D | 9369 | 7166 | 1142 | 1142 | 12.19% | 15.94% | 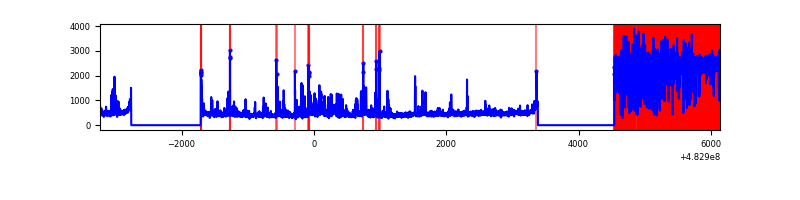 |
Top three noisy pixels from each quadrant. If the there are fewer than three noisy pixels in the level2.evt file, extra rows are filled as -1
| Pixel properties | Quadrant properties | ||||||
|---|---|---|---|---|---|---|---|
| Quadrant | DetID | PixID | Counts | Sigma | Mean | Median | Sigma |
| A | 4 | 3 | 78685 | 414.01 | 772 | 755 | 188.2 |
| A | 5 | 240 | 71174 | 374.11 | 772 | 755 | 188.2 |
| A | 0 | 111 | 47645 | 249.11 | 772 | 755 | 188.2 |
| B | 6 | 51 | 199977 | 1234.38 | 764 | 738 | 161.4 |
| B | 9 | 223 | 163132 | 1006.11 | 764 | 738 | 161.4 |
| B | 1 | 223 | 144467 | 890.47 | 764 | 738 | 161.4 |
| C | 0 | 192 | 573067 | 2804.89 | 748 | 741 | 204.0 |
| C | 13 | 3 | 293493 | 1434.74 | 748 | 741 | 204.0 |
| C | 15 | 231 | 191945 | 937.07 | 748 | 741 | 204.0 |
| D | 2 | 249 | 1526709 | 8041.48 | 675 | 653 | 189.8 |
| D | 11 | 129 | 1389439 | 7318.15 | 675 | 653 | 189.8 |
| D | 8 | 176 | 209565 | 1100.85 | 675 | 653 | 189.8 |
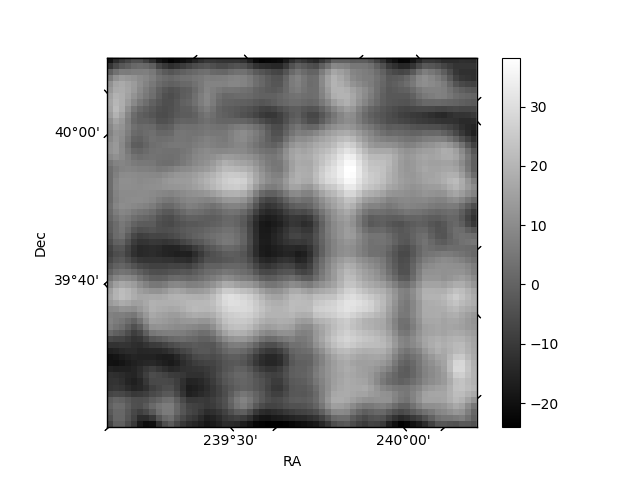
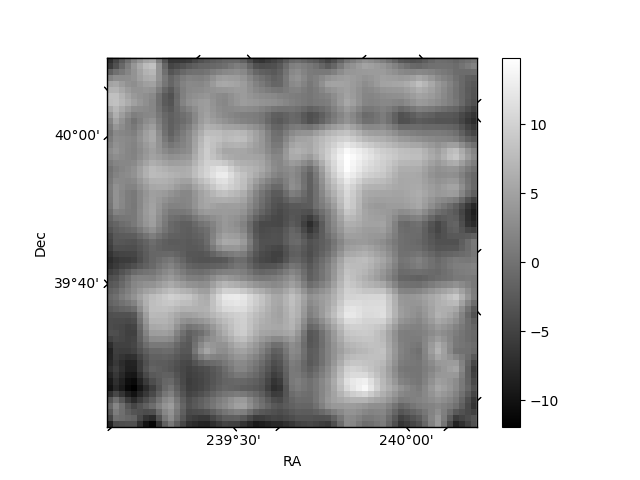
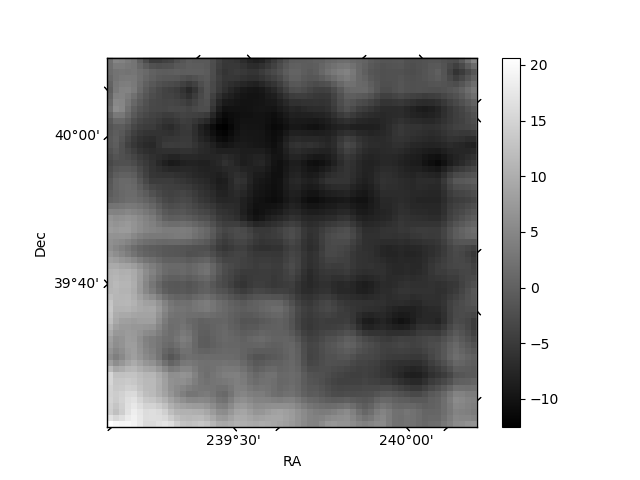
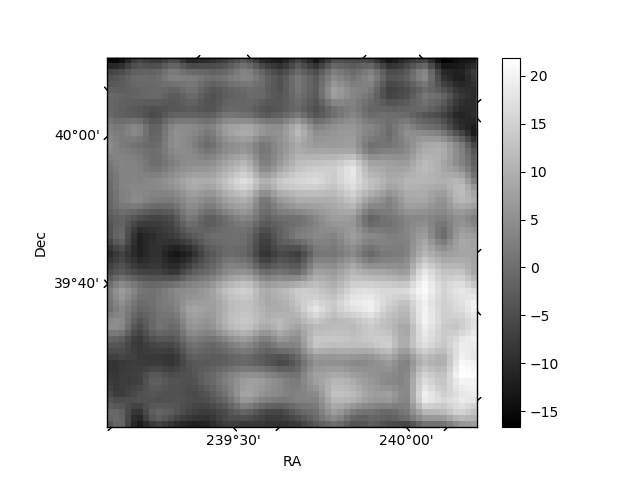
Histogram calculated using DETX and DETY for each event in the final _common_clean file
| Quadrant A | 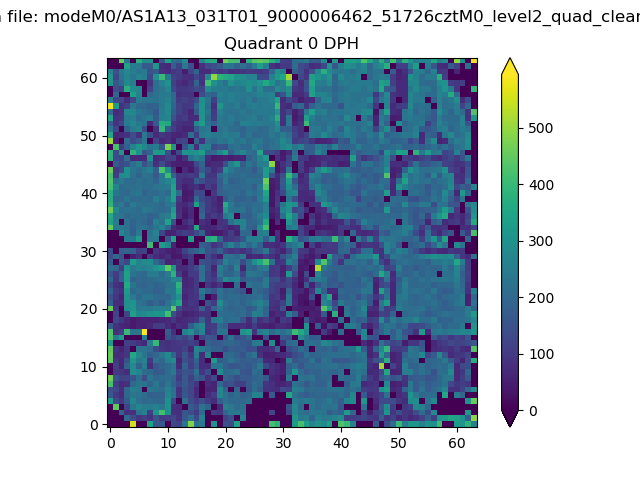 |
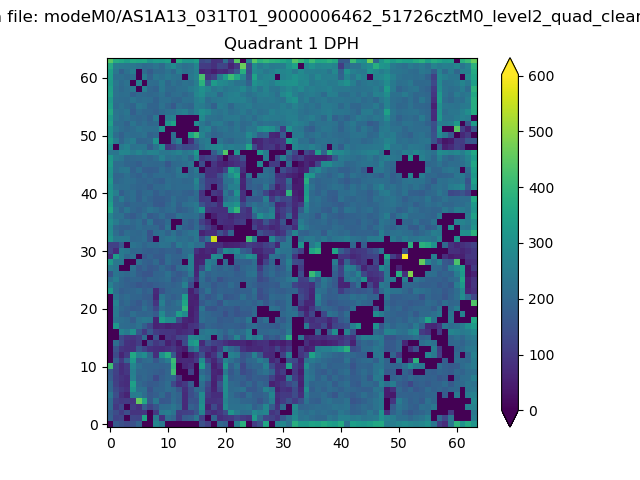 |
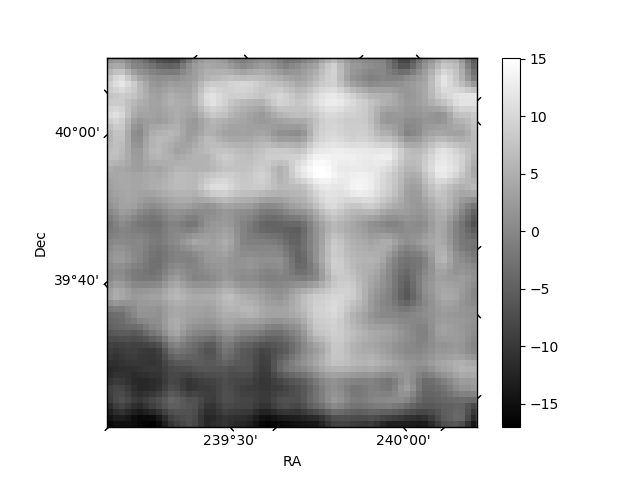
Quadrant B |
|---|---|---|---|
| Quadrant D | 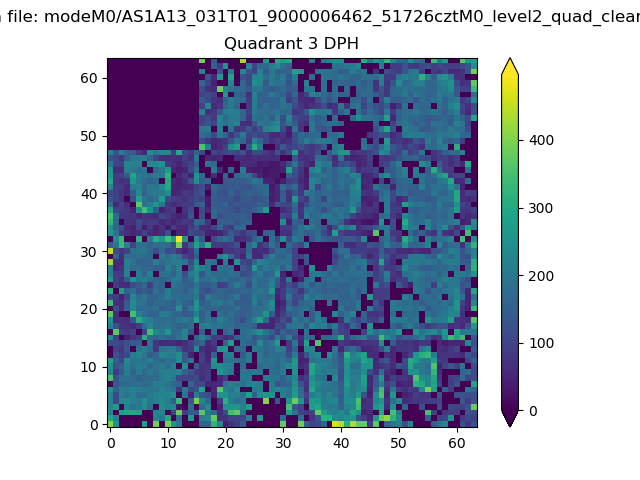 |
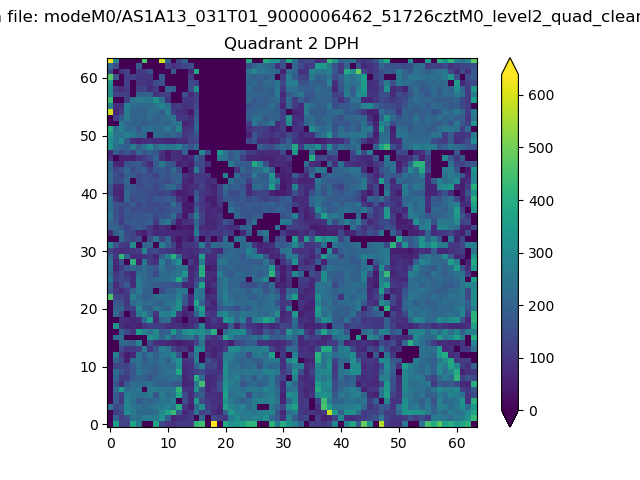 |
Quadrant C |
| Plot type | Count rate plots | Images |
|---|---|---|
| Comparison with Poisson distribution Blue bars denote a histogram of data divided into 1 sec bins. Red curve is a Poisson curve with rate = median count rate of data. |
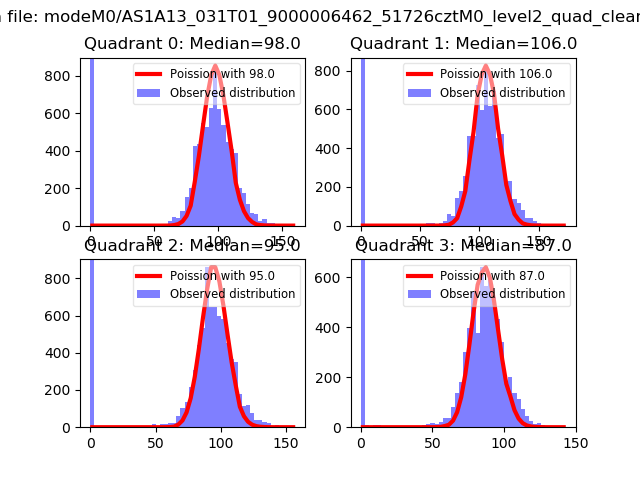 |
 |
| Quadrant-wise count rates Data is divided into 100 sec bins |
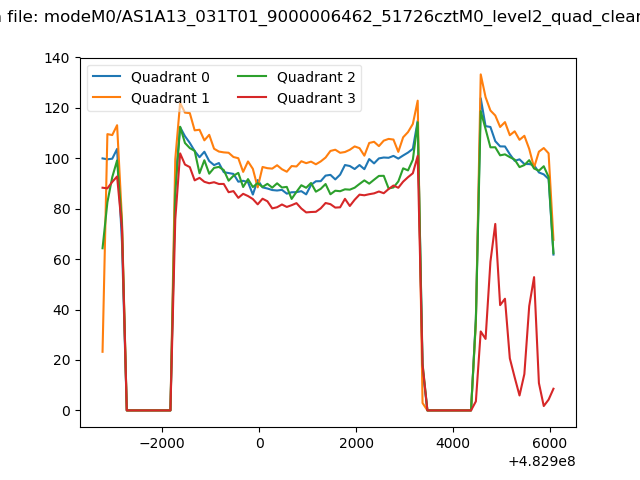 |
|
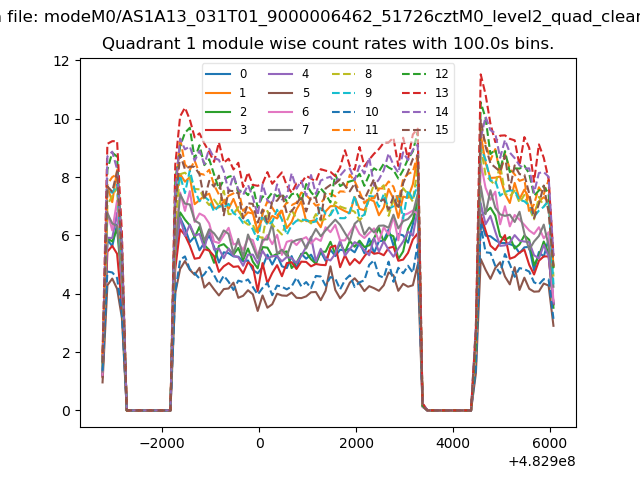
| Module-wise count rates for Quadrant A Data is divided into 100 sec bins |
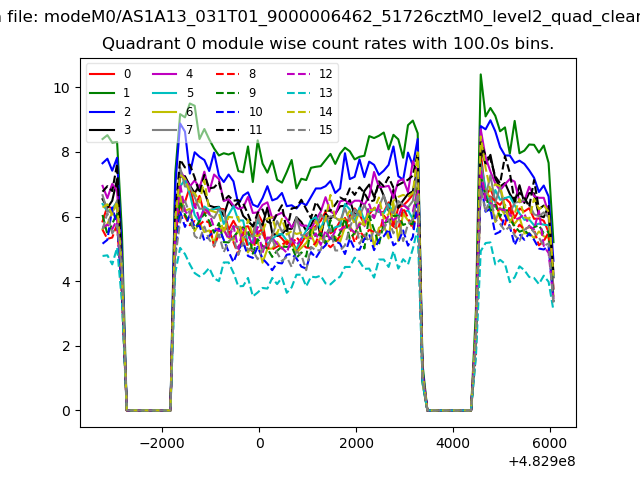 |
 |
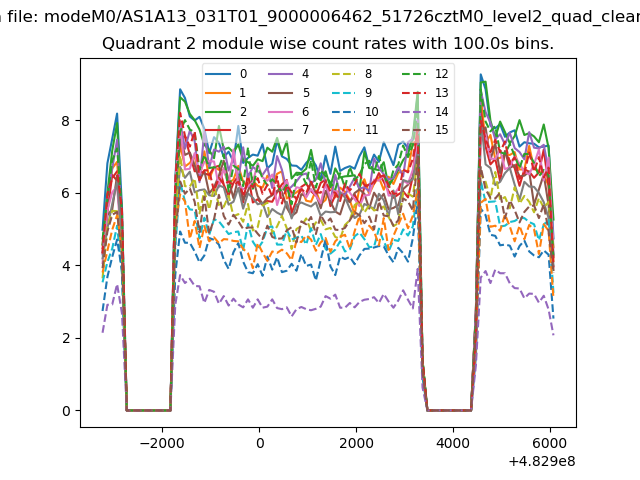
| Module-wise count rates for Quadrant B Data is divided into 100 sec bins |
 |
 |
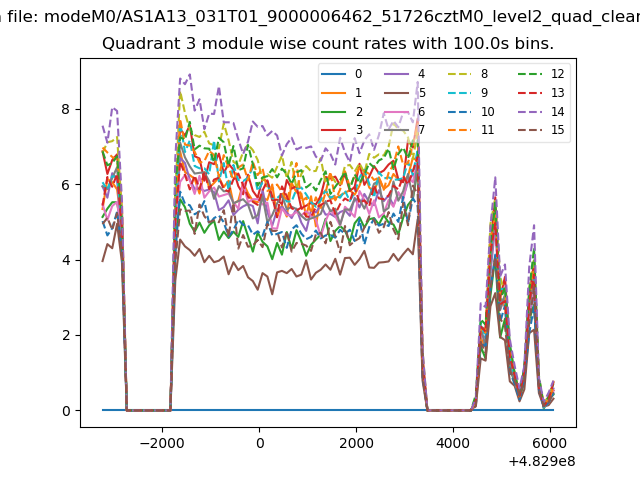
| Module-wise count rates for Quadrant C Data is divided into 100 sec bins |
 |
 |
| Module-wise count rates for Quadrant D Data is divided into 100 sec bins |
 |
 |
| Parameter | Plot |
|---|---|
| CZT HV Monitor | 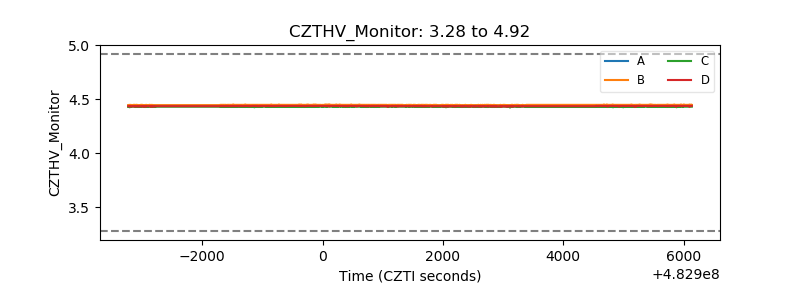 |
| D_VDD | 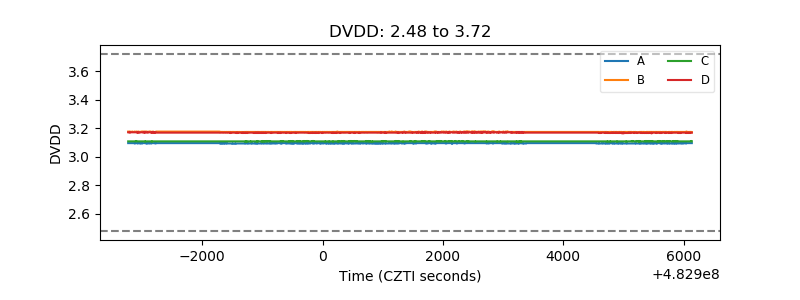 |
| Temperature 1 | 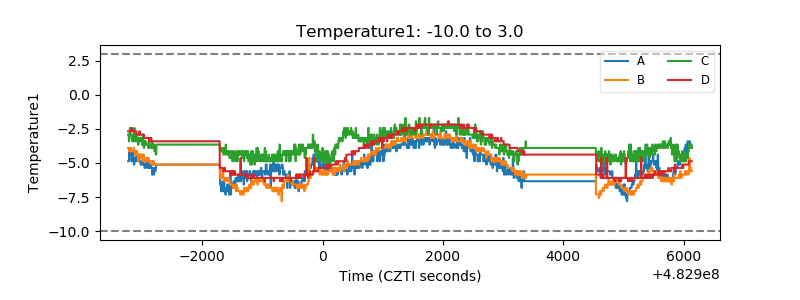 |
| Veto HV Monitor | 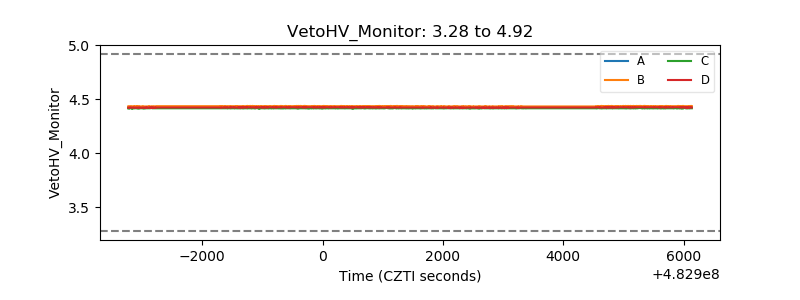 |
| Veto LLD | 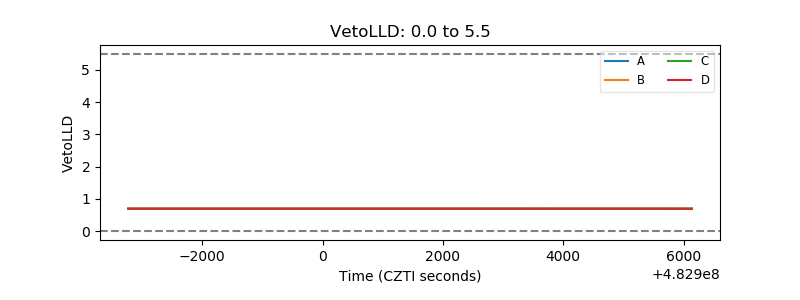 |
| Alpha Counter | 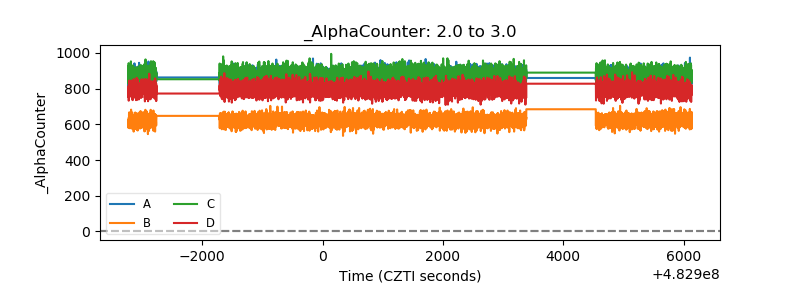 |
| _CPM_Rate | 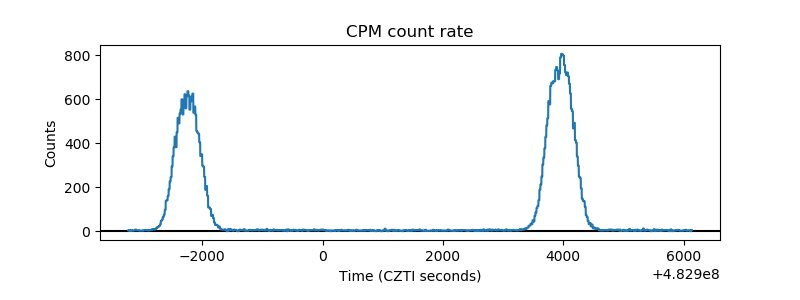 |
| CZT Counter | 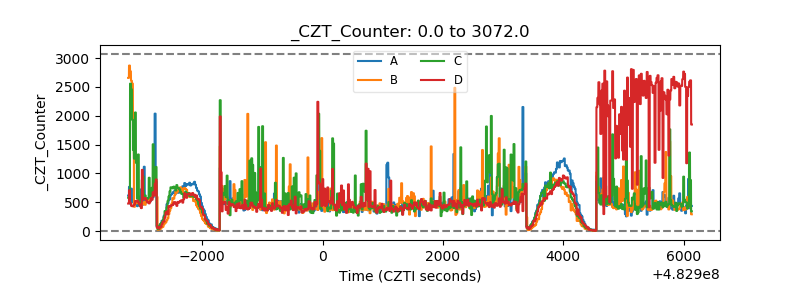 |
| +2.5 Volts monitor | 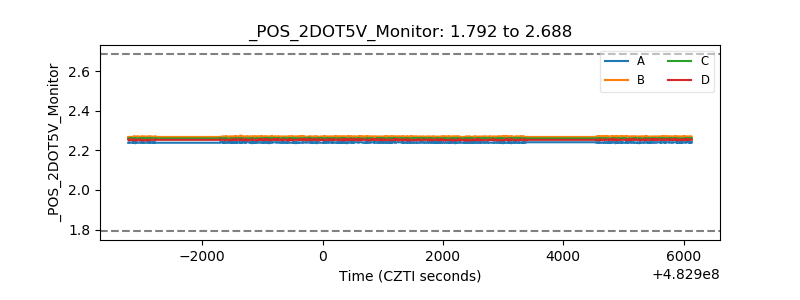 |
| +5 Volts monitor | 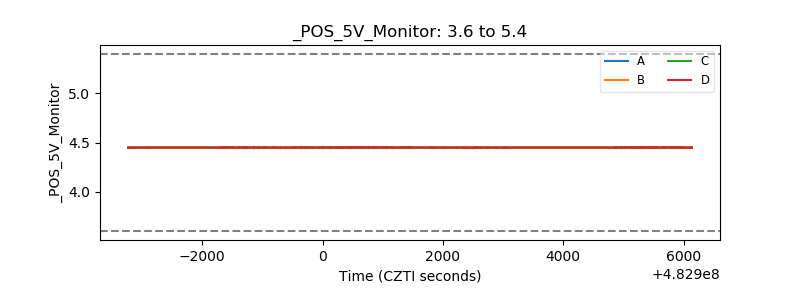 |
| _ROLL_ROT | 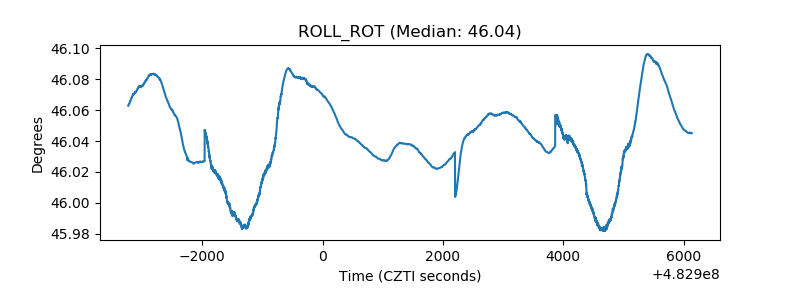 |
| _Roll_DEC | 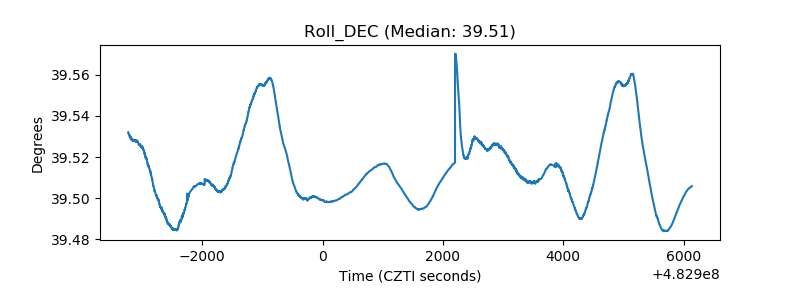 |
| _Roll_RA | 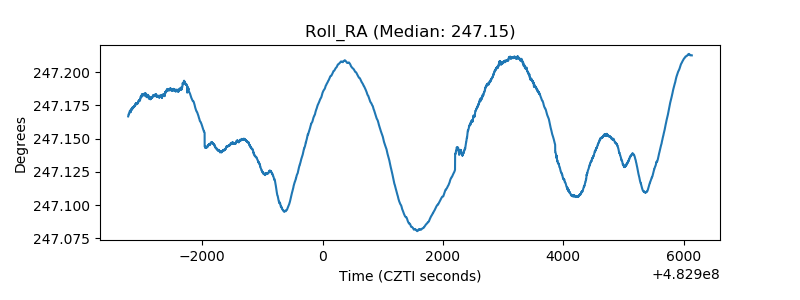 |
| Veto Counter |  |