| Param | Original file | Final file |
|---|---|---|
| Filename | modeM0/AS1A13_031T01_9000006462_51727cztM0_level2.fits | modeM0/AS1A13_031T01_9000006462_51727cztM0_level2_quad_clean.evt |
| Size (bytes) | 542,355,840 | 74,871,360 |
| Size | 517.2 MB | 71.4 MB |
| Events in quadrant A | 3,034,932 | 541,013 |
| Events in quadrant B | 3,062,077 | 588,541 |
| Events in quadrant C | 3,494,443 | 519,614 |
| Events in quadrant D | 10,051,110 | 228,173 |
| Mode M9 | |||
|---|---|---|---|
| Quadrant | BADHDUFLAG | Total packets | Discarded packets |
| A | 0 | 12 | 0 |
| B | 0 | 12 | 0 |
| C | 0 | 12 | 0 |
| D | 0 | 12 | 0 |
| Mode M0 | |||
|---|---|---|---|
| Quadrant | BADHDUFLAG | Total packets | Discarded packets |
| A | 0 | 12833 | 12 |
| B | 0 | 13052 | 13 |
| C | 0 | 14330 | 12 |
| D | 0 | 33793 | 112 |
| Mode SS | |||
|---|---|---|---|
| Quadrant | BADHDUFLAG | Total packets | Discarded packets |
| A | 0 | 111 | 1 |
| B | 0 | 112 | 0 |
| C | 0 | 114 | 0 |
| D | 0 | 114 | 0 |
| Quadrant | Total seconds | Saturated seconds | Saturation percentage |
|---|---|---|---|
| A | 5575 | 97 | 1.739910% |
| B | 5574 | 115 | 2.063150% |
| C | 5576 | 214 | 3.837877% |
| D | 5562 | 3293 | 59.205322% |
Noise dominated data is calculated using 1-second bins in cleaned event files. If a bin has >2000 counts, and if more than 50% of those come from <1% of pixels, then it is considered to be noise-dominated and hence unusable.
| Quadrant | # 1 sec bins | Bins with >0 counts | Bins with >2000 counts | High rate bins dominated by noise | Noise dominated (total time) | Noise dominated (detector-on time) | Marked lightcurve |
|---|---|---|---|---|---|---|---|
| A | 6741 | 5579 | 38 | 38 | 0.56% | 0.68% | 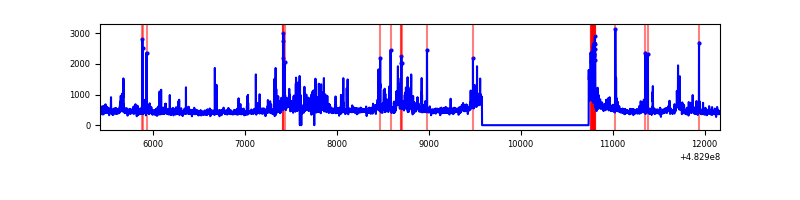 |
| B | 6741 | 5579 | 43 | 43 | 0.64% | 0.77% | 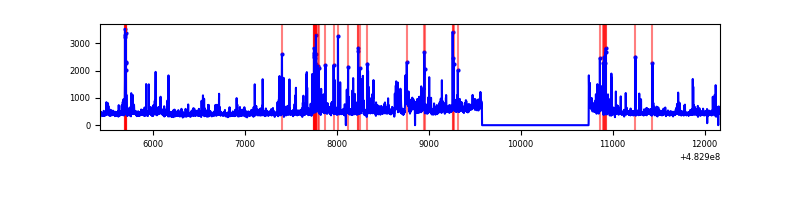 |
| C | 6742 | 5581 | 178 | 178 | 2.64% | 3.19% | 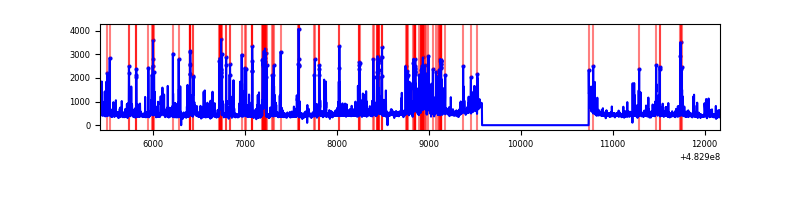 |
| D | 6740 | 5568 | 2860 | 2860 | 42.43% | 51.36% | 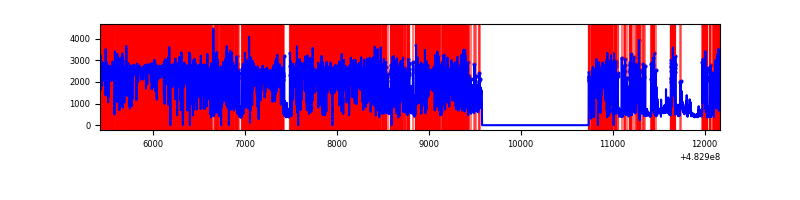 |
Top three noisy pixels from each quadrant. If the there are fewer than three noisy pixels in the level2.evt file, extra rows are filled as -1
| Pixel properties | Quadrant properties | ||||||
|---|---|---|---|---|---|---|---|
| Quadrant | DetID | PixID | Counts | Sigma | Mean | Median | Sigma |
| A | 11 | 3 | 198267 | 1323.52 | 603 | 589 | 149.4 |
| A | 4 | 3 | 73512 | 488.24 | 603 | 589 | 149.4 |
| A | 5 | 240 | 63442 | 420.82 | 603 | 589 | 149.4 |
| B | 5 | 172 | 186162 | 1456.05 | 598 | 579 | 127.5 |
| B | 10 | 41 | 87392 | 681.12 | 598 | 579 | 127.5 |
| B | 0 | 213 | 79889 | 622.25 | 598 | 579 | 127.5 |
| C | 0 | 192 | 442529 | 2787.87 | 577 | 574 | 158.5 |
| C | 13 | 3 | 270329 | 1701.63 | 577 | 574 | 158.5 |
| C | 15 | 231 | 168086 | 1056.67 | 577 | 574 | 158.5 |
| D | 11 | 129 | 6367892 | 60259.25 | 377 | 361 | 105.7 |
| D | 2 | 249 | 1545961 | 14626.81 | 377 | 361 | 105.7 |
| D | 0 | 146 | 227749 | 2151.89 | 377 | 361 | 105.7 |
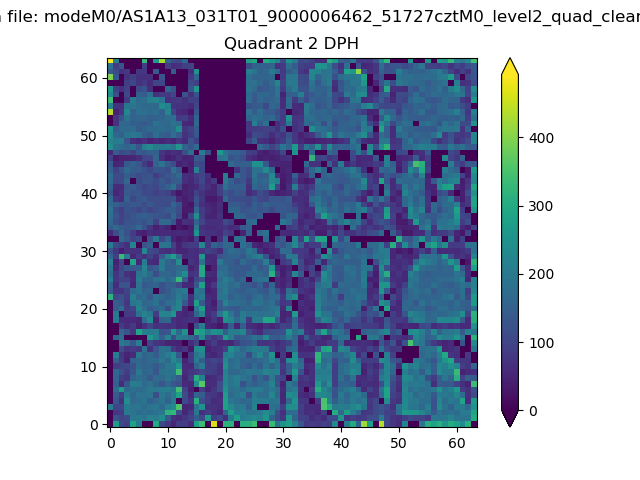
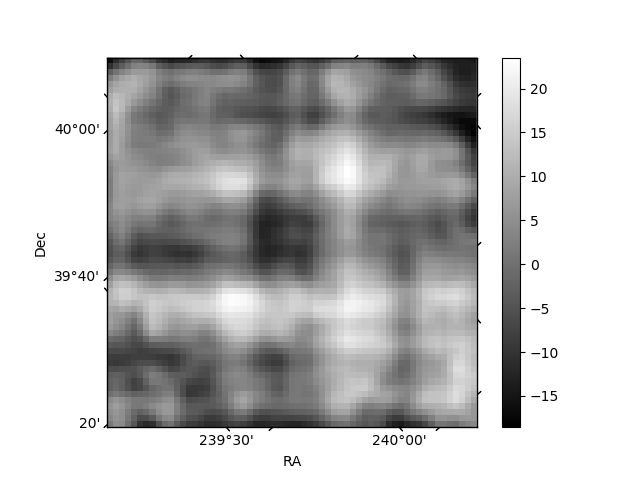
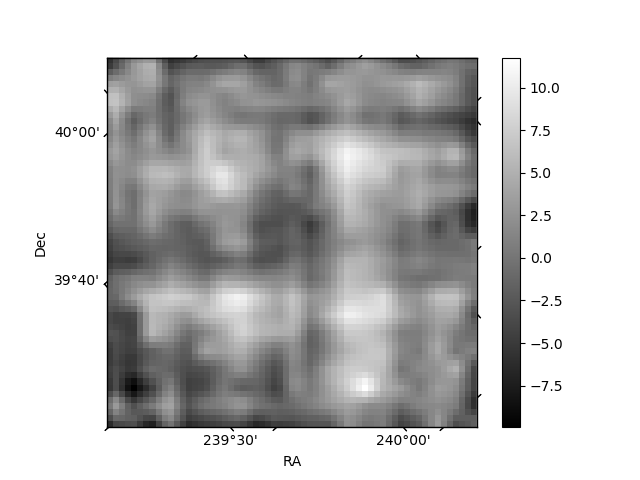
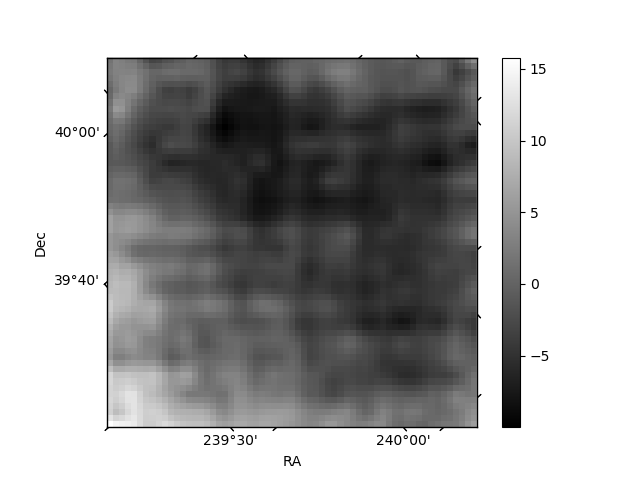
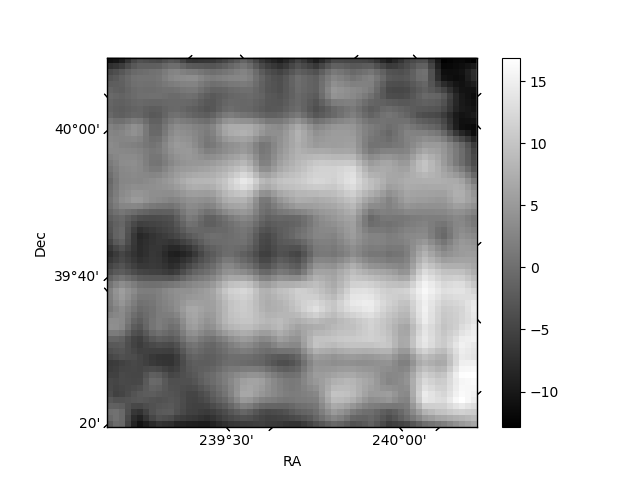
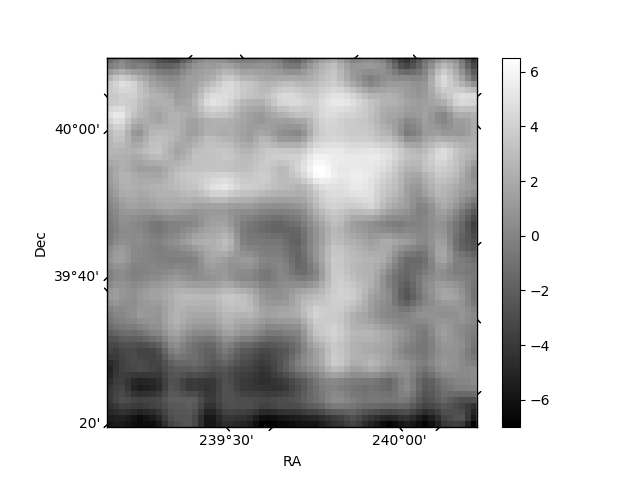
Histogram calculated using DETX and DETY for each event in the final _common_clean file
| Quadrant A | 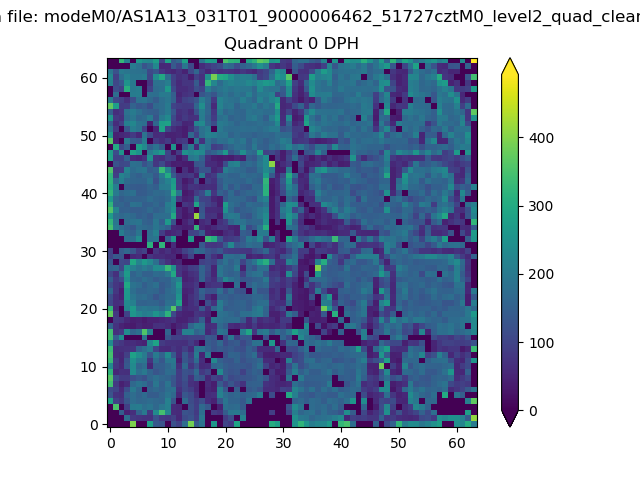 |
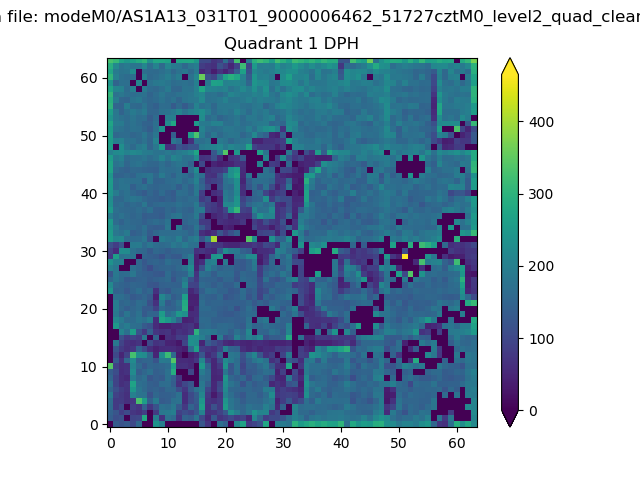 |
Quadrant B |
|---|---|---|---|
| Quadrant D | 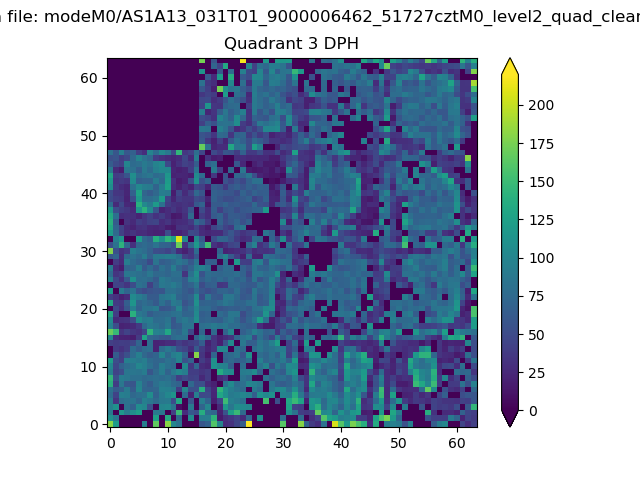 |
 |
Quadrant C |
| Plot type | Count rate plots | Images |
|---|---|---|
| Comparison with Poisson distribution Blue bars denote a histogram of data divided into 1 sec bins. Red curve is a Poisson curve with rate = median count rate of data. |
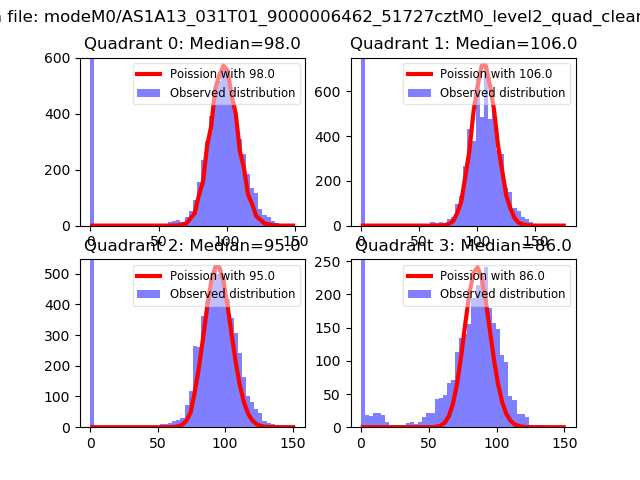 |
 |
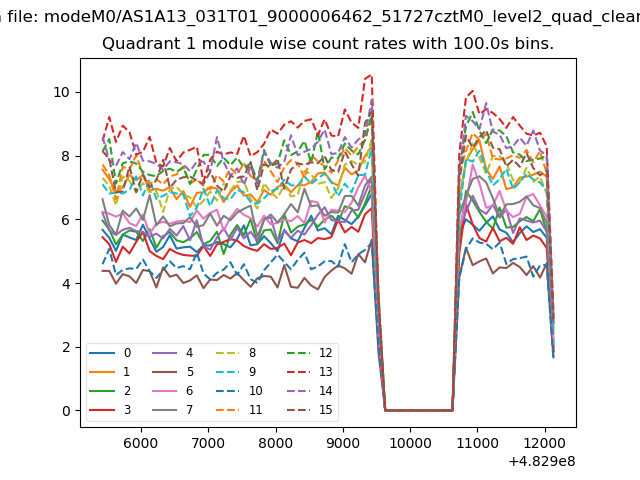
| Quadrant-wise count rates Data is divided into 100 sec bins |
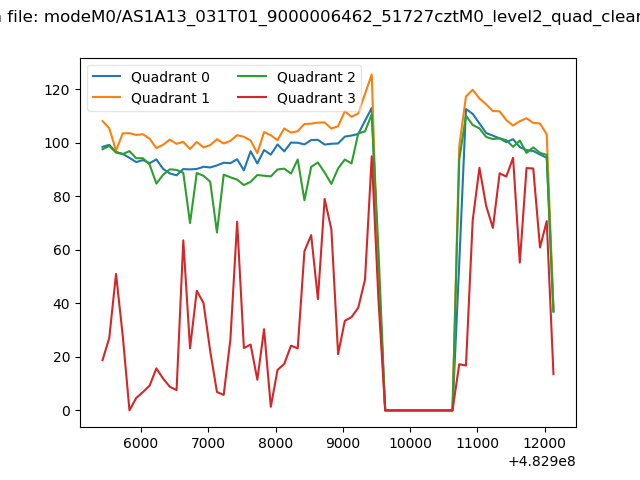 |
|
| Module-wise count rates for Quadrant A Data is divided into 100 sec bins |
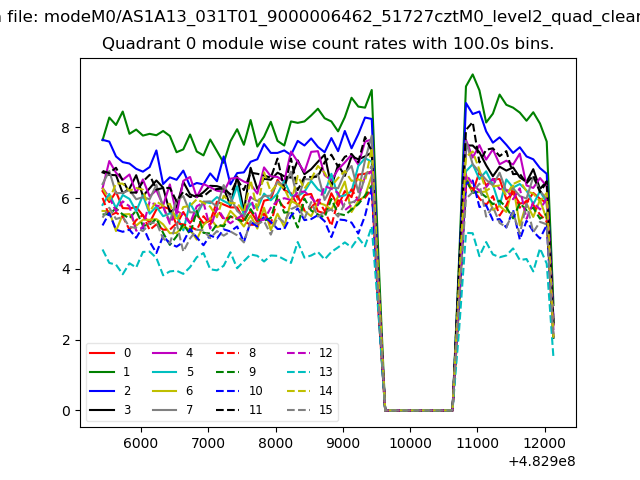 |
 |
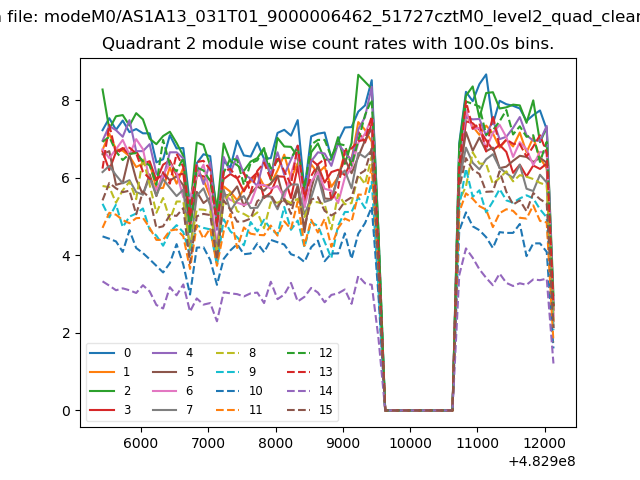
| Module-wise count rates for Quadrant B Data is divided into 100 sec bins |
 |
 |
| Module-wise count rates for Quadrant C Data is divided into 100 sec bins |
 |
 |
| Module-wise count rates for Quadrant D Data is divided into 100 sec bins |
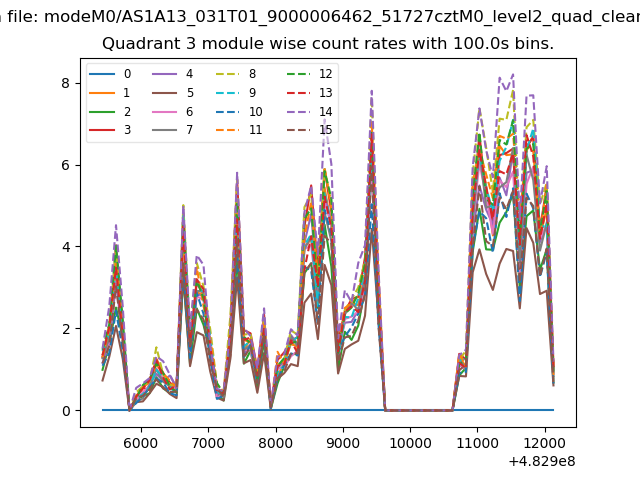 |
 |
| Parameter | Plot |
|---|---|
| CZT HV Monitor | 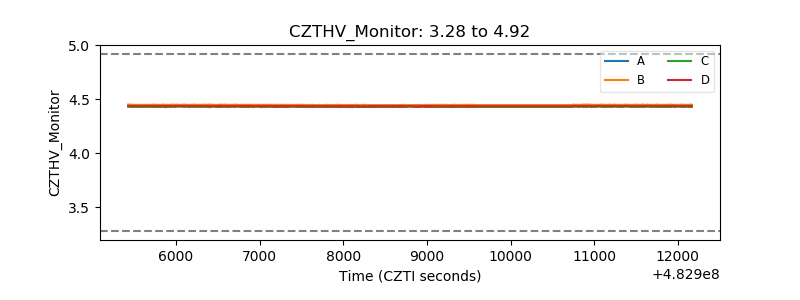 |
| D_VDD | 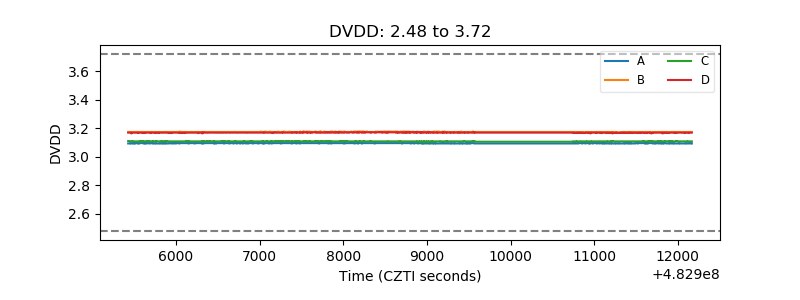 |
| Temperature 1 | 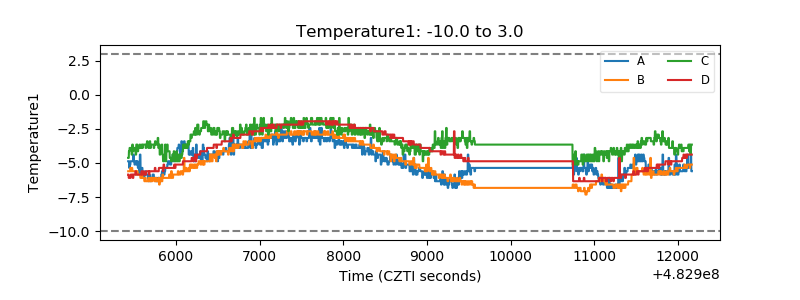 |
| Veto HV Monitor | 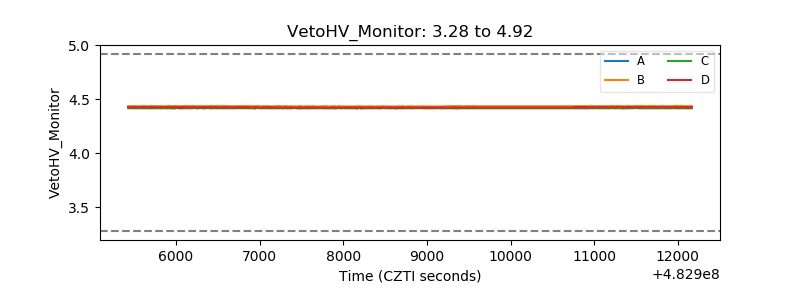 |
| Veto LLD | 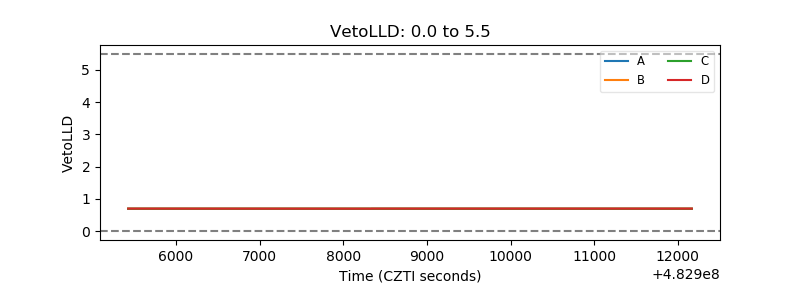 |
| Alpha Counter | 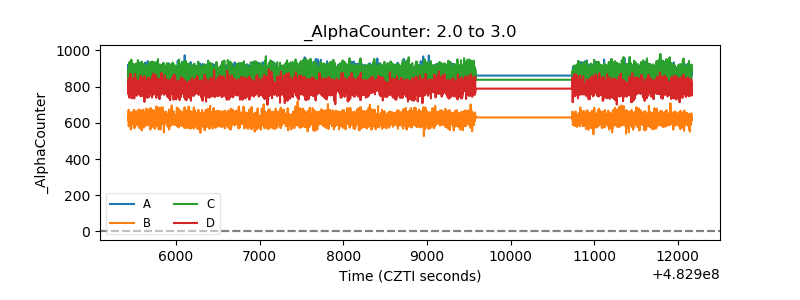 |
| _CPM_Rate | 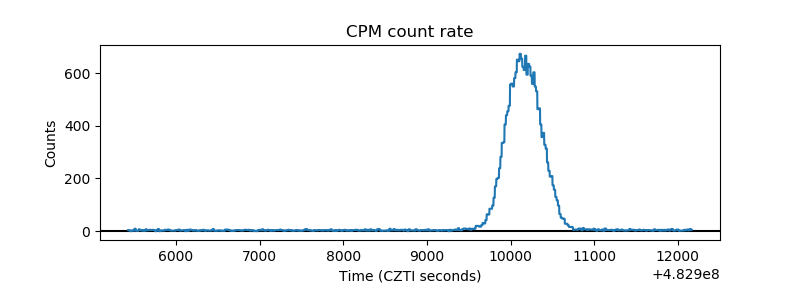 |
| CZT Counter | 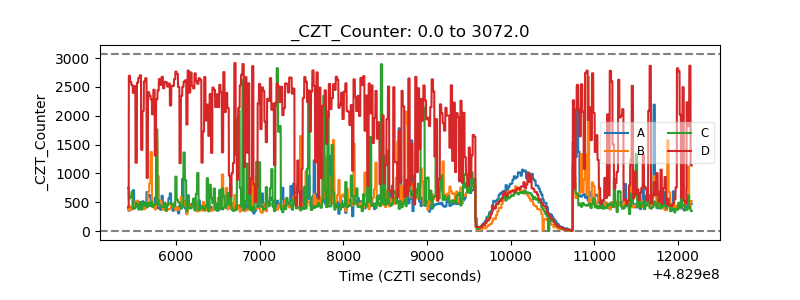 |
| +2.5 Volts monitor | 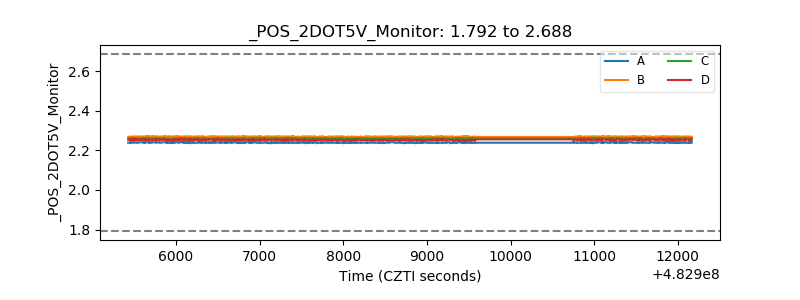 |
| +5 Volts monitor | 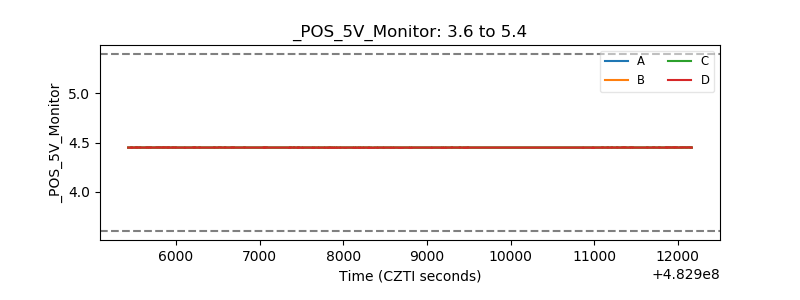 |
| _ROLL_ROT | 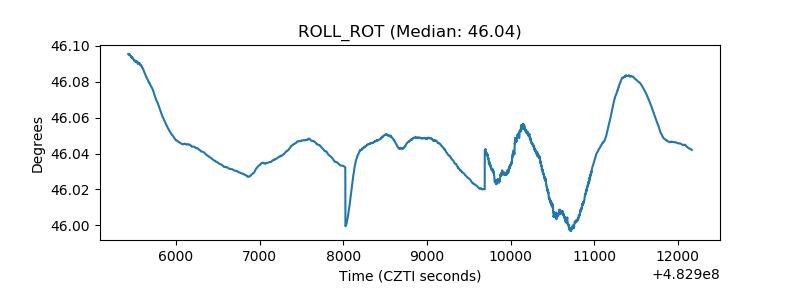 |
| _Roll_DEC | 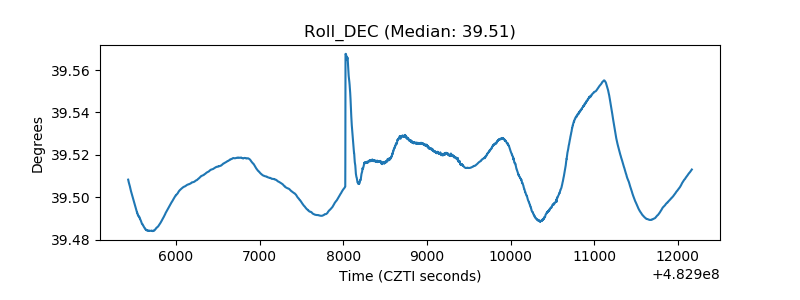 |
| _Roll_RA | 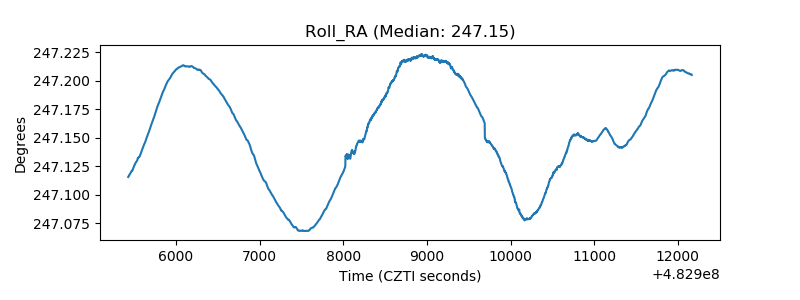 |
| Veto Counter | 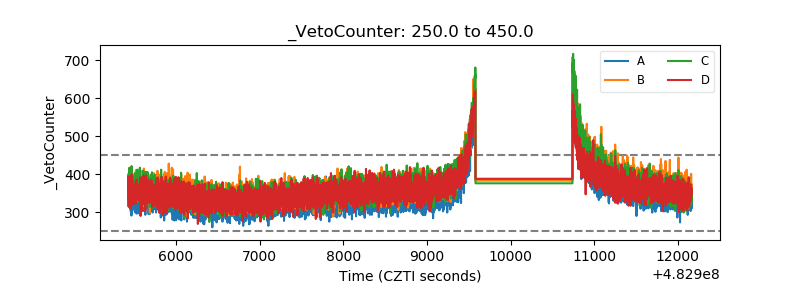 |