| Param | Original file | Final file |
|---|---|---|
| Filename | modeM0/AS1A13_090T01_9000006464cztM0_level2.fits | modeM0/AS1A13_090T01_9000006464cztM0_level2_quad_clean.evt |
| Size (bytes) | 4,335,693,120 | 1,371,741,120 |
| Size | 4.0 GB | 1.3 GB |
| Events in quadrant A | 26,113,916 | 1,283,272 |
| Events in quadrant B | 24,028,490 | 1,326,966 |
| Events in quadrant C | 25,384,098 | 1,178,664 |
| Events in quadrant D | 18,750,848 | 826,065 |
| Mode M9 | |||
|---|---|---|---|
| Quadrant | BADHDUFLAG | Total packets | Discarded packets |
| A | 0 | 617 | 0 |
| B | 0 | 617 | 0 |
| C | 0 | 617 | 0 |
| D | 0 | 617 | 0 |
| Mode SS | |||
|---|---|---|---|
| Quadrant | BADHDUFLAG | Total packets | Discarded packets |
| A | 0 | 10919 | 0 |
| B | 0 | 10919 | 0 |
| C | 0 | 10925 | 0 |
| D | 0 | 10918 | 0 |
| Mode M0 | |||
|---|---|---|---|
| Quadrant | BADHDUFLAG | Total packets | Discarded packets |
| A | 0 | 1612149 | 0 |
| B | 0 | 1765215 | 0 |
| C | 0 | 1536593 | 0 |
| D | 0 | 2542785 | 0 |
| Quadrant | Total seconds | Saturated seconds | Saturation percentage |
|---|---|---|---|
| A | 538723 | 33683 | 6.252378% |
| B | 538641 | 67989 | 12.622322% |
| C | 538724 | 34391 | 6.383788% |
| D | 538504 | 167803 | 31.160957% |
Noise dominated data is calculated using 1-second bins in cleaned event files. If a bin has >2000 counts, and if more than 50% of those come from <1% of pixels, then it is considered to be noise-dominated and hence unusable.
| Quadrant | # 1 sec bins | Bins with >0 counts | Bins with >2000 counts | High rate bins dominated by noise | Noise dominated (total time) | Noise dominated (detector-on time) | Marked lightcurve |
|---|---|---|---|---|---|---|---|
| A | 602941 | 538381 | 0 | 0 | 0.00% | 0.00% | 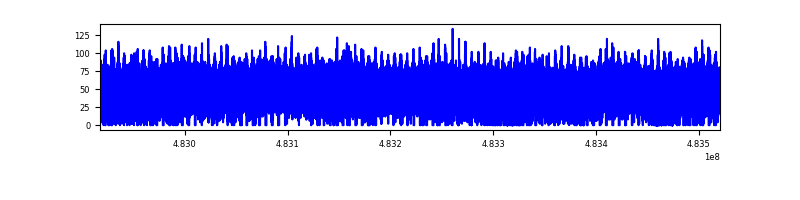 |
| B | 602942 | 537617 | 0 | 0 | 0.00% | 0.00% | 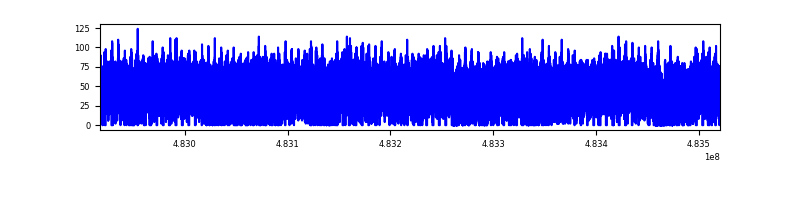 |
| C | 602942 | 538054 | 0 | 0 | 0.00% | 0.00% | 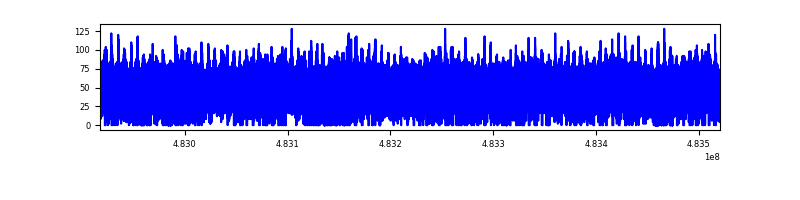 |
| D | 602942 | 526777 | 0 | 0 | 0.00% | 0.00% |  |
Top three noisy pixels from each quadrant. If the there are fewer than three noisy pixels in the level2.evt file, extra rows are filled as -1
| Pixel properties | Quadrant properties | ||||||
|---|---|---|---|---|---|---|---|
| Quadrant | DetID | PixID | Counts | Sigma | Mean | Median | Sigma |
| A | 14 | 188 | 27410 | 9.37 | 6895 | 6362 | 2245.8 |
| A | 9 | 255 | 25995 | 8.74 | 6895 | 6362 | 2245.8 |
| A | 14 | 95 | 21813 | 6.88 | 6895 | 6362 | 2245.8 |
| B | 3 | 25 | 19740 | 9.07 | 6401 | 6026 | 1512.8 |
| B | 9 | 173 | 19324 | 8.79 | 6401 | 6026 | 1512.8 |
| B | 3 | 17 | 19195 | 8.71 | 6401 | 6026 | 1512.8 |
| C | 15 | 175 | 20891 | 6.39 | 6828 | 6214 | 2295.5 |
| C | 15 | 127 | 20570 | 6.25 | 6828 | 6214 | 2295.5 |
| C | 2 | 31 | 20270 | 6.12 | 6828 | 6214 | 2295.5 |
| D | 6 | 218 | 23858 | 10.61 | 5386 | 4787 | 1797.3 |
| D | 3 | 30 | 18215 | 7.47 | 5386 | 4787 | 1797.3 |
| D | 15 | 11 | 17063 | 6.83 | 5386 | 4787 | 1797.3 |
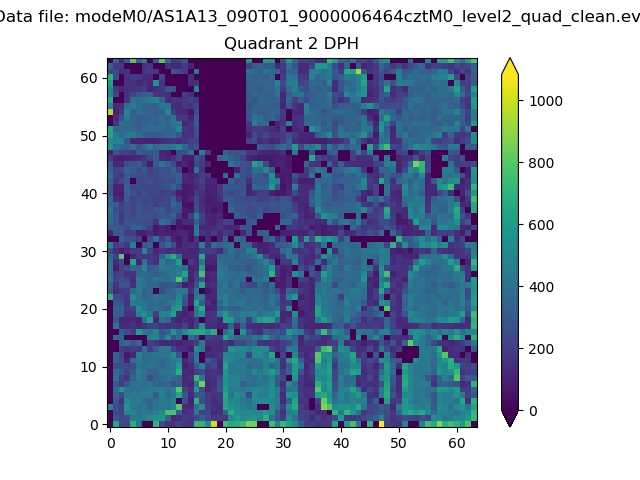
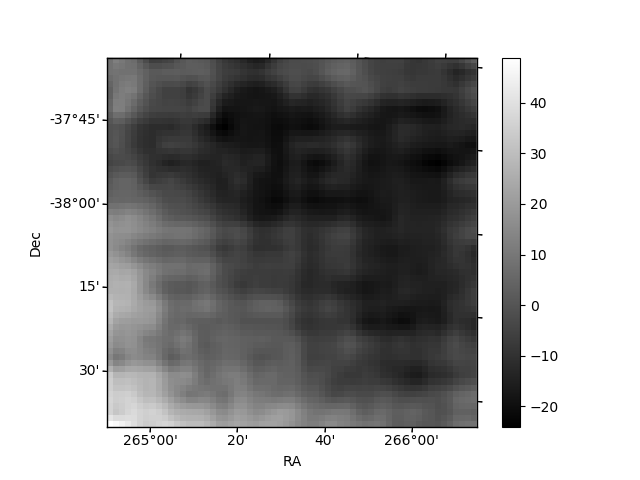
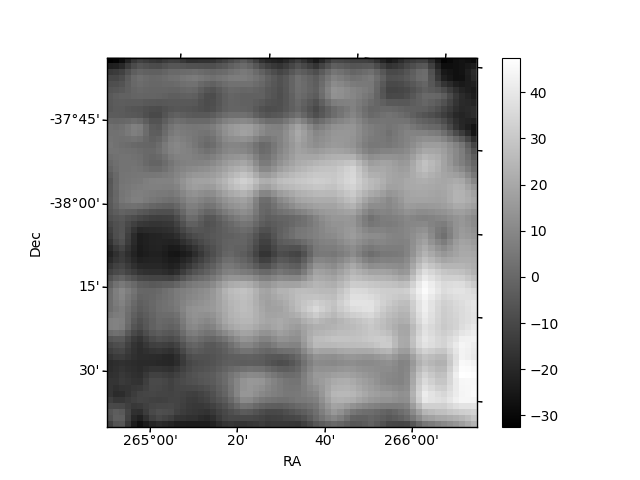
Histogram calculated using DETX and DETY for each event in the final _common_clean file
| Quadrant A | 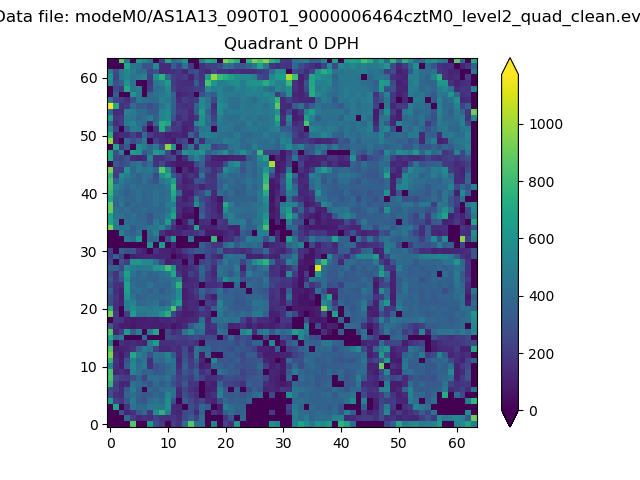 |
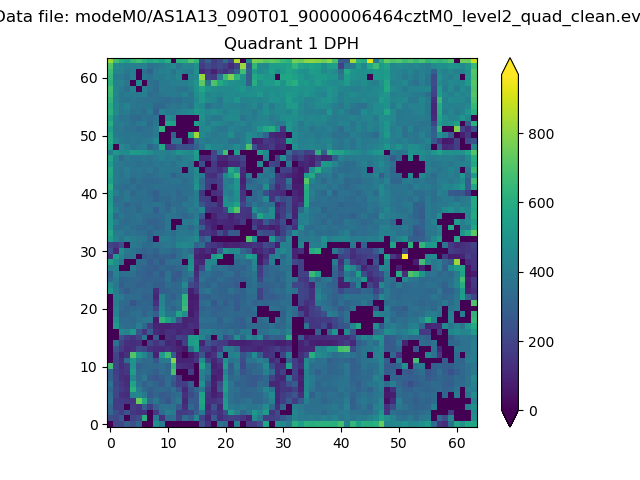 |
Quadrant B |
|---|---|---|---|
| Quadrant D | 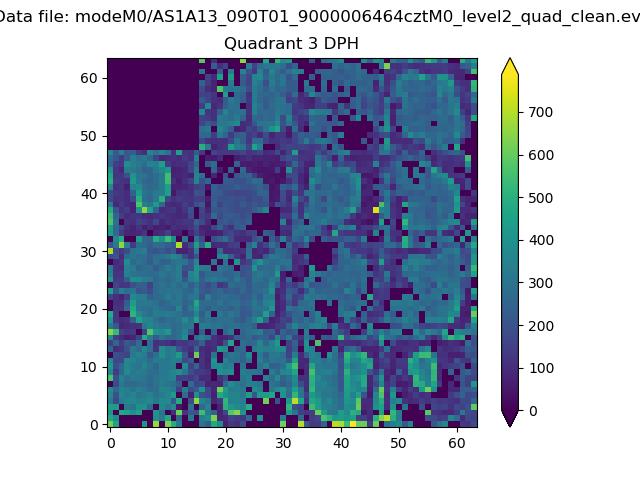 |
 |
Quadrant C |
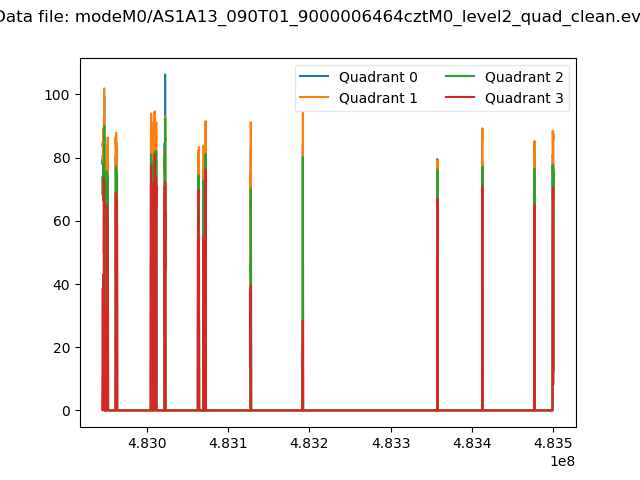
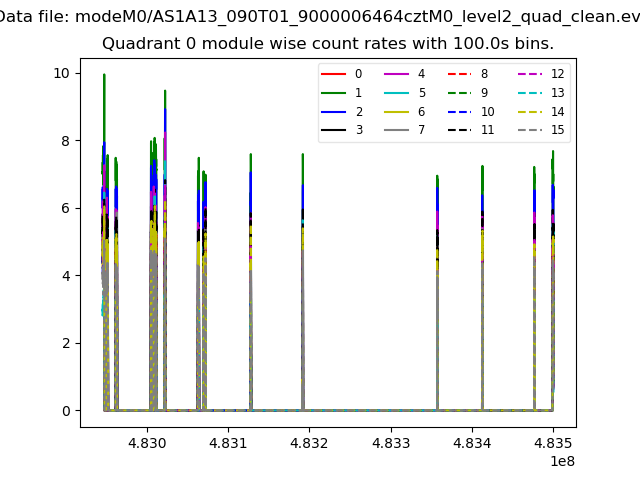
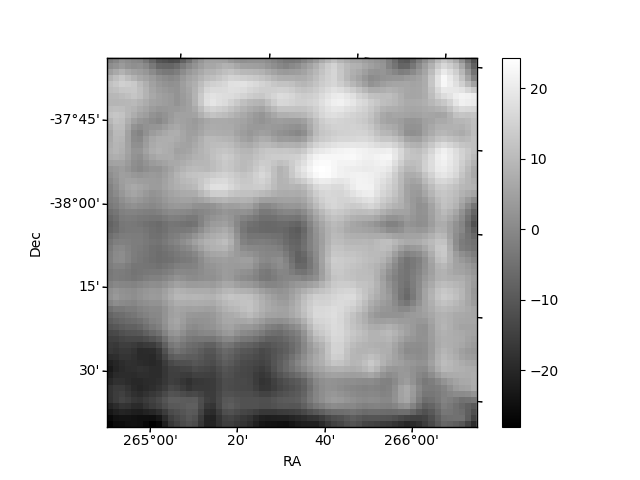
| Plot type | Count rate plots | Images |
|---|---|---|
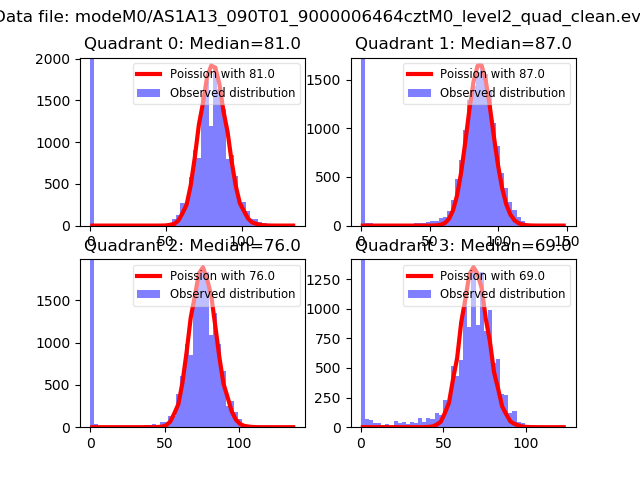
| Comparison with Poisson distribution Blue bars denote a histogram of data divided into 1 sec bins. Red curve is a Poisson curve with rate = median count rate of data. |
 |
 |
| Quadrant-wise count rates Data is divided into 100 sec bins |
 |
|
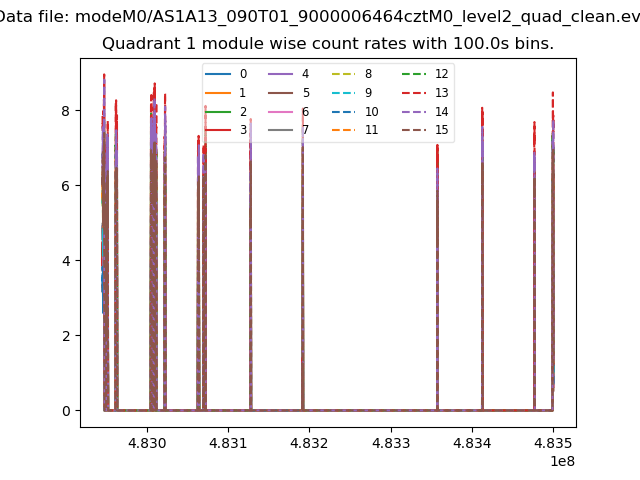
| Module-wise count rates for Quadrant A Data is divided into 100 sec bins |
 |
 |
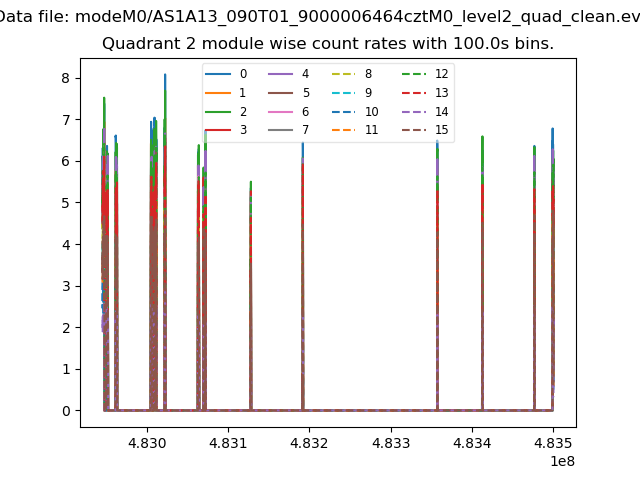
| Module-wise count rates for Quadrant B Data is divided into 100 sec bins |
 |
 |
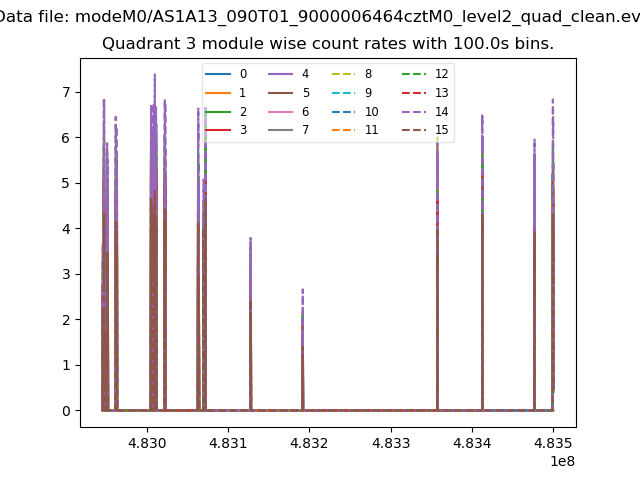
| Module-wise count rates for Quadrant C Data is divided into 100 sec bins |
 |
 |
| Module-wise count rates for Quadrant D Data is divided into 100 sec bins |
 |
 |
| Parameter | Plot |
|---|---|
| CZT HV Monitor | 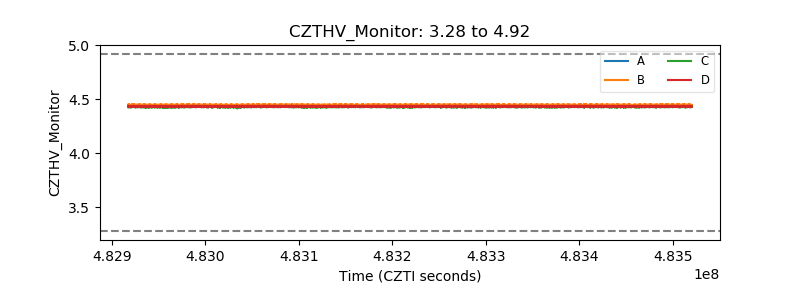 |
| D_VDD | 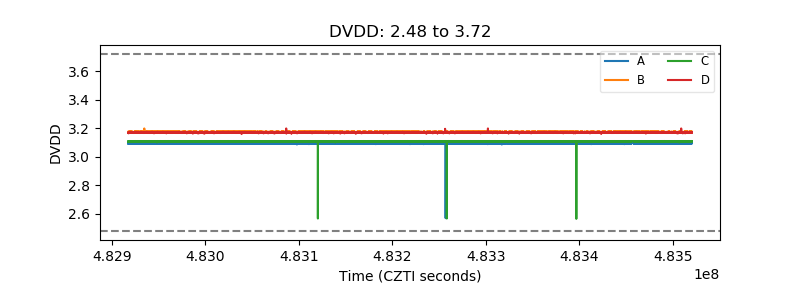 |
| Temperature 1 | 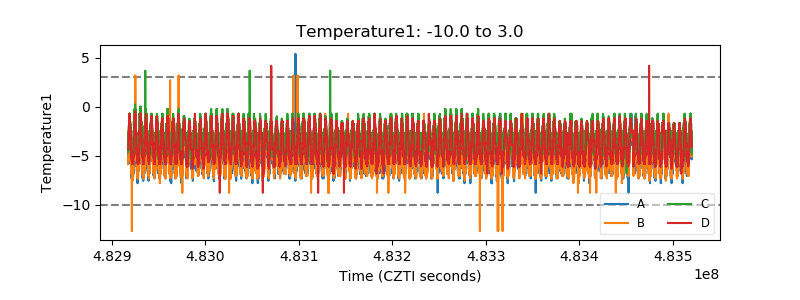 |
| Veto HV Monitor | 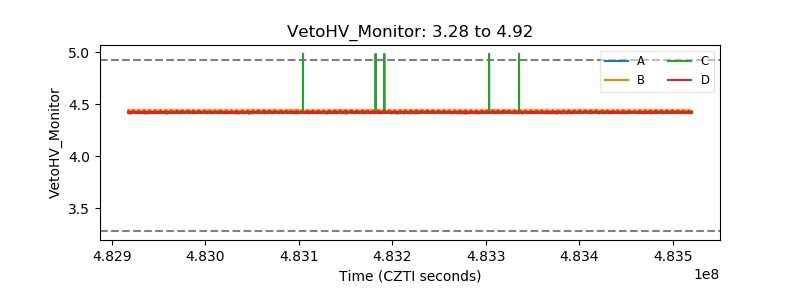 |
| Veto LLD | 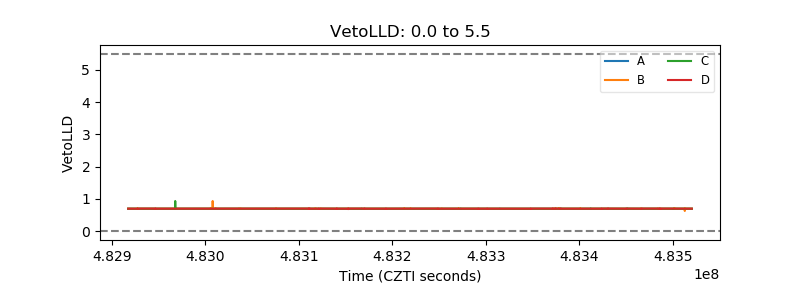 |
| Alpha Counter | 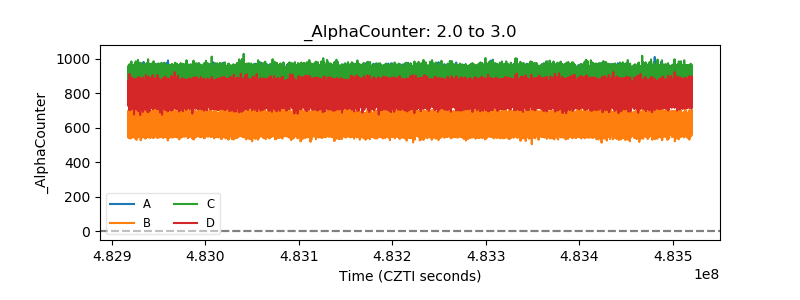 |
| _CPM_Rate | 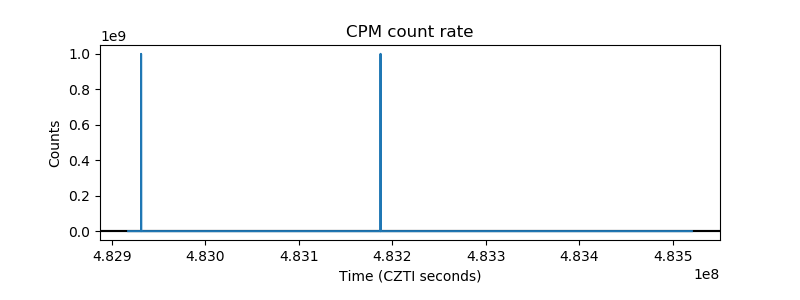 |
| CZT Counter | 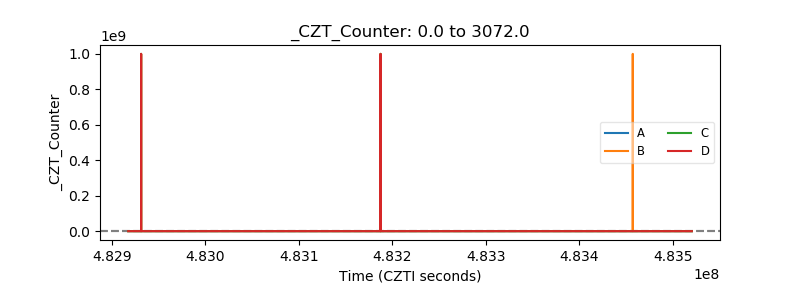 |
| +2.5 Volts monitor | 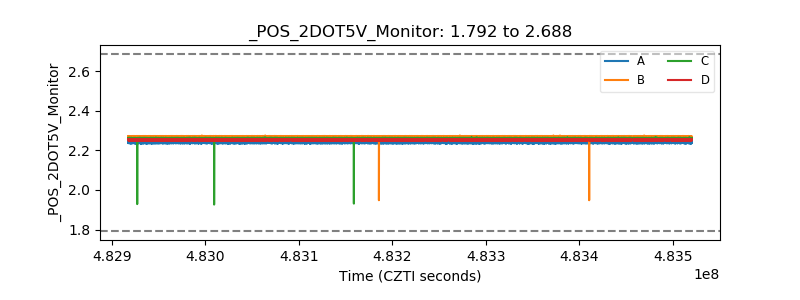 |
| +5 Volts monitor | 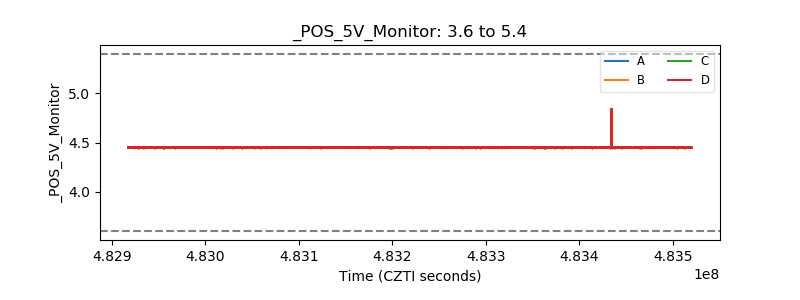 |
| _ROLL_ROT | 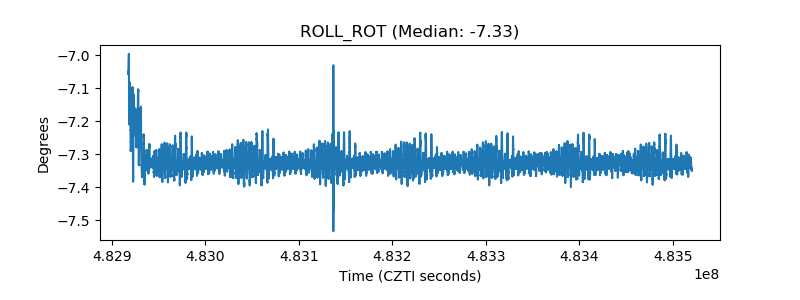 |
| _Roll_DEC | 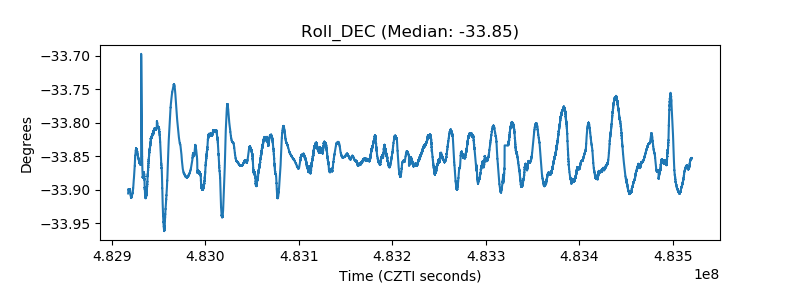 |
| _Roll_RA | 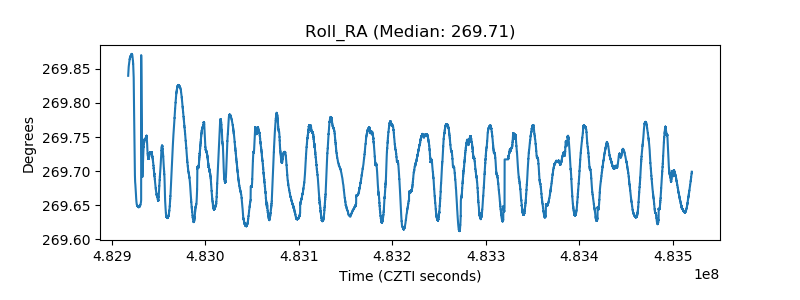 |
| Veto Counter | 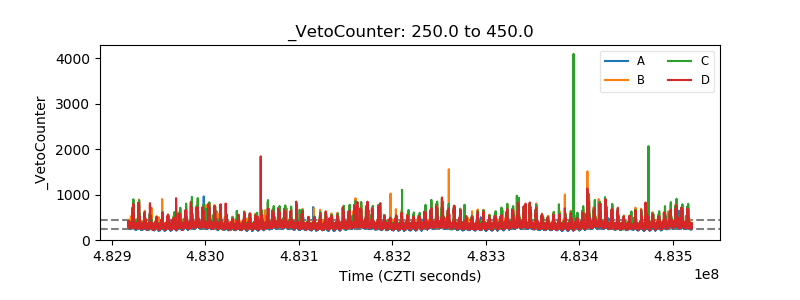 |