| Param | Original file | Final file |
|---|---|---|
| Filename | modeM0/AS1A13_090T01_9000006464_51729cztM0_level2.fits | modeM0/AS1A13_090T01_9000006464_51729cztM0_level2_quad_clean.evt |
| Size (bytes) | 588,738,240 | 79,197,120 |
| Size | 561.5 MB | 75.5 MB |
| Events in quadrant A | 3,554,110 | 557,937 |
| Events in quadrant B | 3,880,908 | 605,584 |
| Events in quadrant C | 3,592,664 | 549,663 |
| Events in quadrant D | 10,296,490 | 263,711 |
| Mode M9 | |||
|---|---|---|---|
| Quadrant | BADHDUFLAG | Total packets | Discarded packets |
| A | 0 | 9 | 0 |
| B | 0 | 9 | 0 |
| C | 0 | 9 | 0 |
| D | 0 | 9 | 0 |
| Mode SS | |||
|---|---|---|---|
| Quadrant | BADHDUFLAG | Total packets | Discarded packets |
| A | 0 | 122 | 0 |
| B | 0 | 122 | 0 |
| C | 0 | 122 | 0 |
| D | 0 | 122 | 0 |
| Mode M0 | |||
|---|---|---|---|
| Quadrant | BADHDUFLAG | Total packets | Discarded packets |
| A | 0 | 14619 | 1 |
| B | 0 | 15621 | 1 |
| C | 0 | 14871 | 1 |
| D | 0 | 34707 | 3 |
| Quadrant | Total seconds | Saturated seconds | Saturation percentage |
|---|---|---|---|
| A | 6030 | 286 | 4.742952% |
| B | 6031 | 349 | 5.786768% |
| C | 6031 | 219 | 3.631239% |
| D | 6030 | 3320 | 55.058043% |
Noise dominated data is calculated using 1-second bins in cleaned event files. If a bin has >2000 counts, and if more than 50% of those come from <1% of pixels, then it is considered to be noise-dominated and hence unusable.
| Quadrant | # 1 sec bins | Bins with >0 counts | Bins with >2000 counts | High rate bins dominated by noise | Noise dominated (total time) | Noise dominated (detector-on time) | Marked lightcurve |
|---|---|---|---|---|---|---|---|
| A | 6925 | 6030 | 119 | 119 | 1.72% | 1.97% | 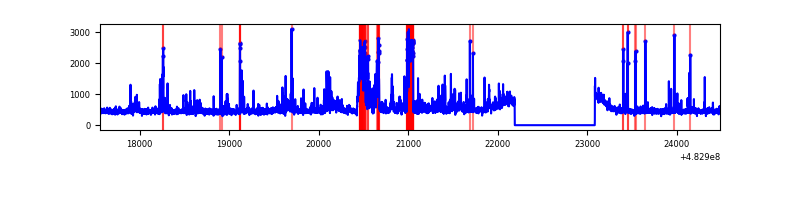 |
| B | 6926 | 6031 | 130 | 130 | 1.88% | 2.16% | 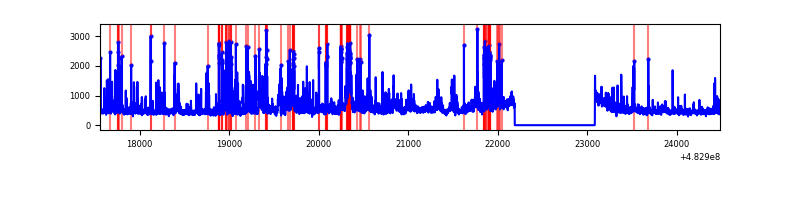 |
| C | 6926 | 6031 | 114 | 114 | 1.65% | 1.89% | 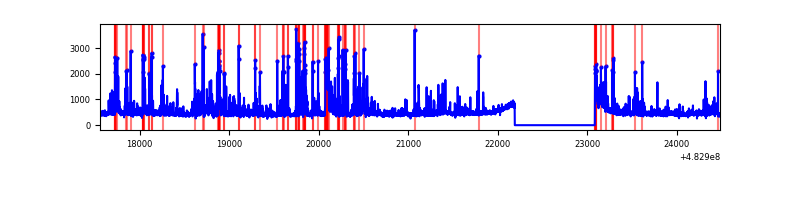 |
| D | 6924 | 6029 | 2674 | 2674 | 38.62% | 44.35% | 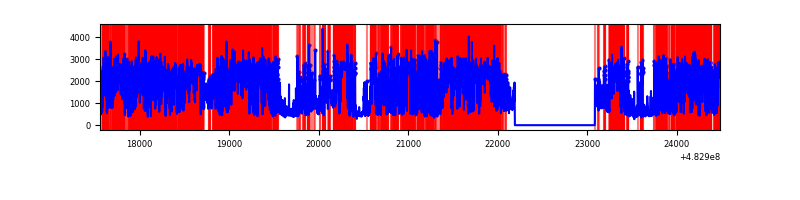 |
Top three noisy pixels from each quadrant. If the there are fewer than three noisy pixels in the level2.evt file, extra rows are filled as -1
| Pixel properties | Quadrant properties | ||||||
|---|---|---|---|---|---|---|---|
| Quadrant | DetID | PixID | Counts | Sigma | Mean | Median | Sigma |
| A | 4 | 175 | 281755 | 1727.89 | 669 | 654 | 162.7 |
| A | 13 | 248 | 159589 | 976.95 | 669 | 654 | 162.7 |
| A | 0 | 111 | 86468 | 527.49 | 669 | 654 | 162.7 |
| B | 0 | 216 | 180982 | 1279.36 | 658 | 637 | 141.0 |
| B | 6 | 51 | 146656 | 1035.85 | 658 | 637 | 141.0 |
| B | 0 | 213 | 129162 | 911.75 | 658 | 637 | 141.0 |
| C | 0 | 192 | 258953 | 1449.42 | 653 | 646 | 178.2 |
| C | 13 | 3 | 126247 | 704.78 | 653 | 646 | 178.2 |
| C | 2 | 207 | 96537 | 538.07 | 653 | 646 | 178.2 |
| D | 11 | 129 | 7928938 | 61011.78 | 463 | 446 | 130.0 |
| D | 8 | 176 | 231845 | 1780.67 | 463 | 446 | 130.0 |
| D | 12 | 218 | 66989 | 512.07 | 463 | 446 | 130.0 |
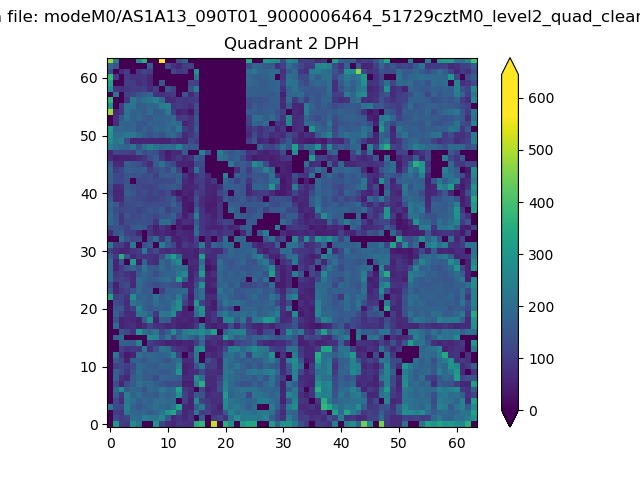
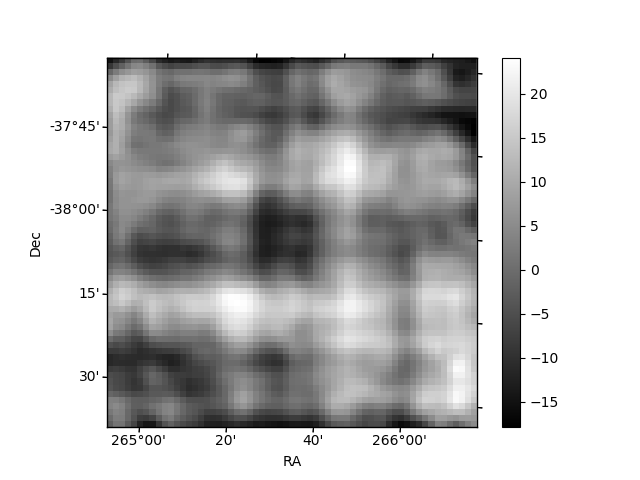
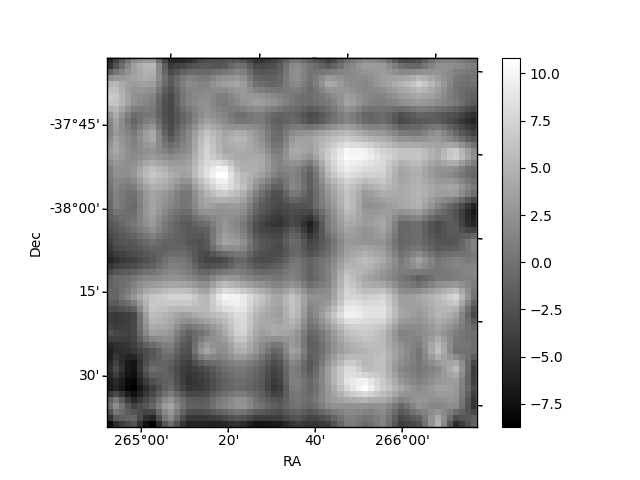
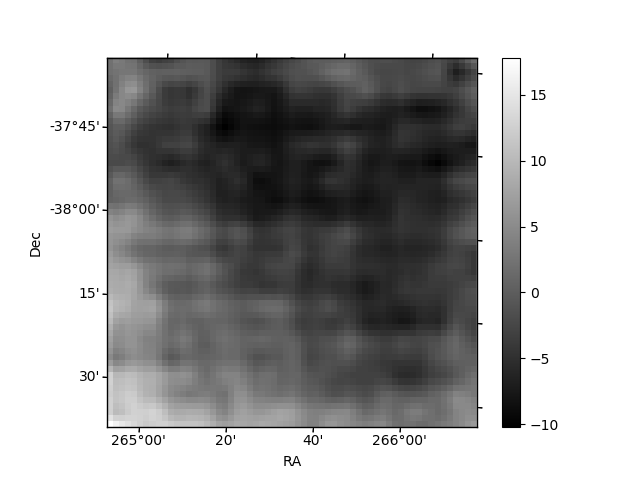
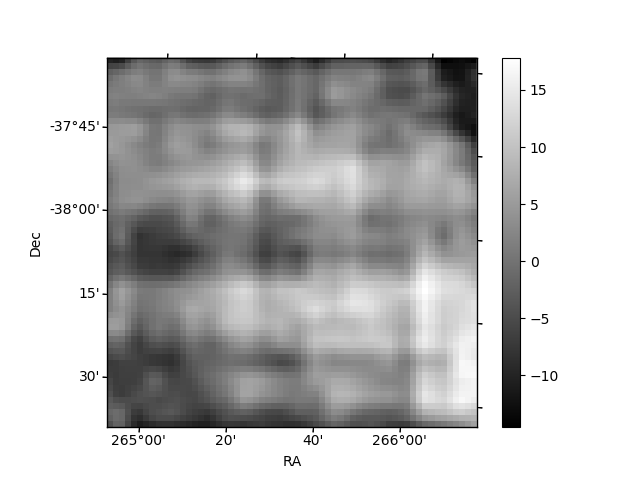
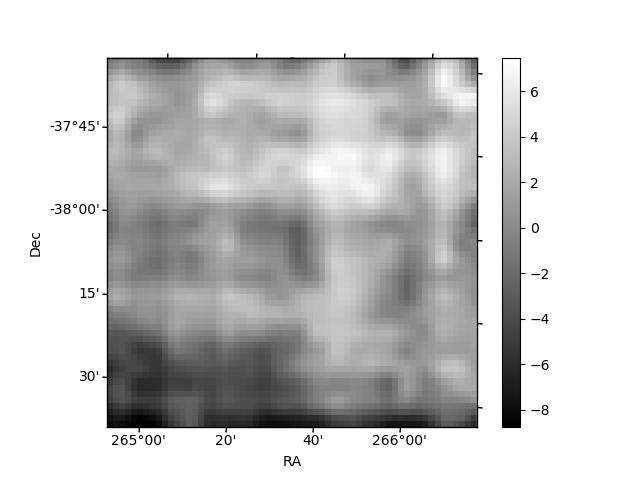
Histogram calculated using DETX and DETY for each event in the final _common_clean file
| Quadrant A | 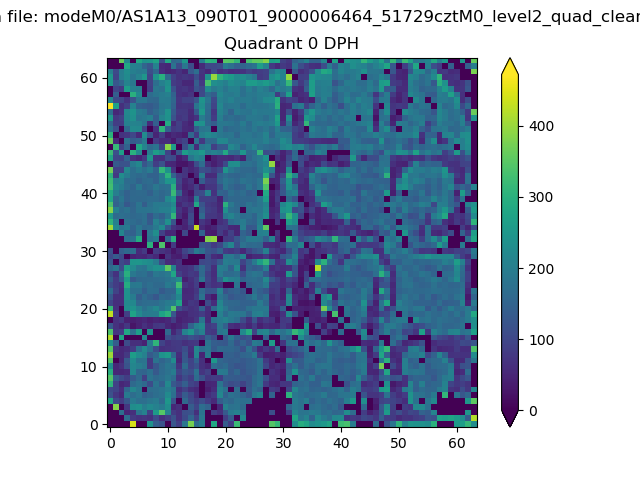 |
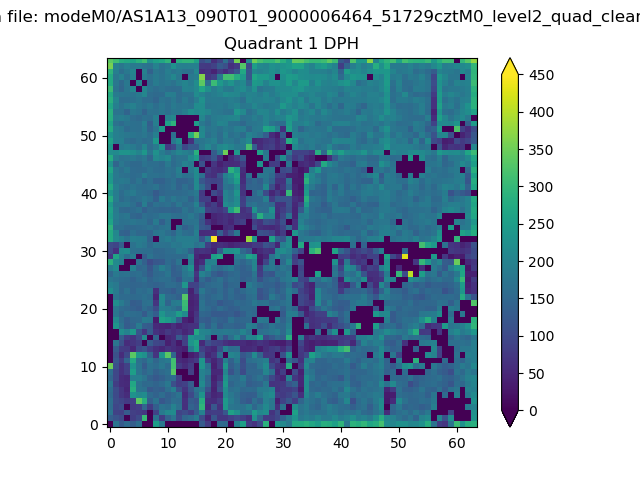 |
Quadrant B |
|---|---|---|---|
| Quadrant D | 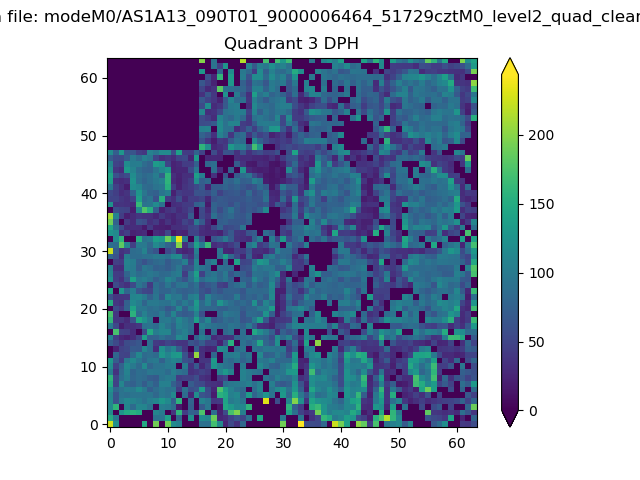 |
 |
Quadrant C |
| Plot type | Count rate plots | Images |
|---|---|---|
| Comparison with Poisson distribution Blue bars denote a histogram of data divided into 1 sec bins. Red curve is a Poisson curve with rate = median count rate of data. |
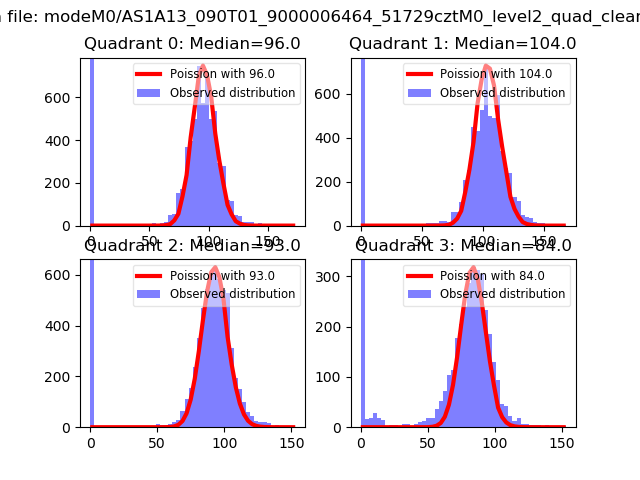 |
 |
| Quadrant-wise count rates Data is divided into 100 sec bins |
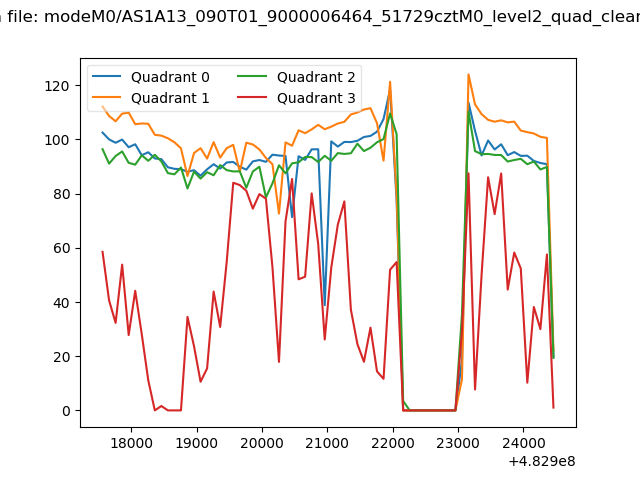 |
|
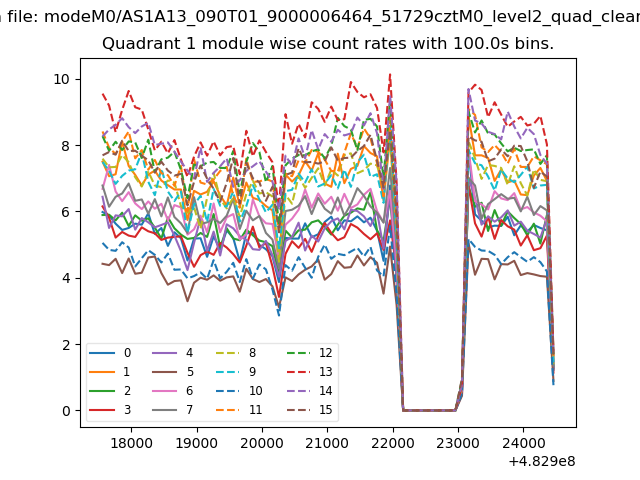
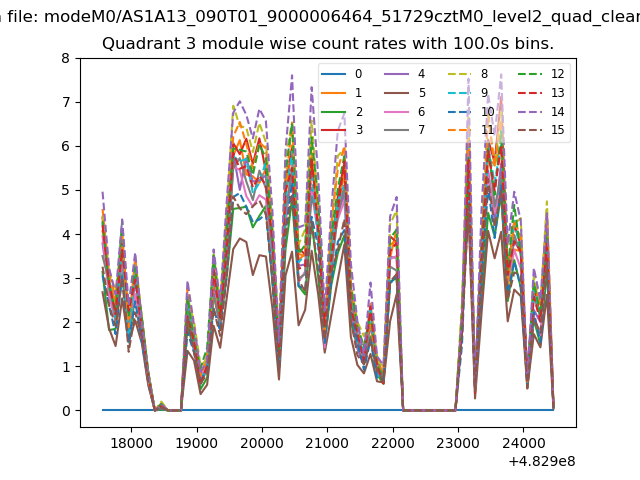
| Module-wise count rates for Quadrant A Data is divided into 100 sec bins |
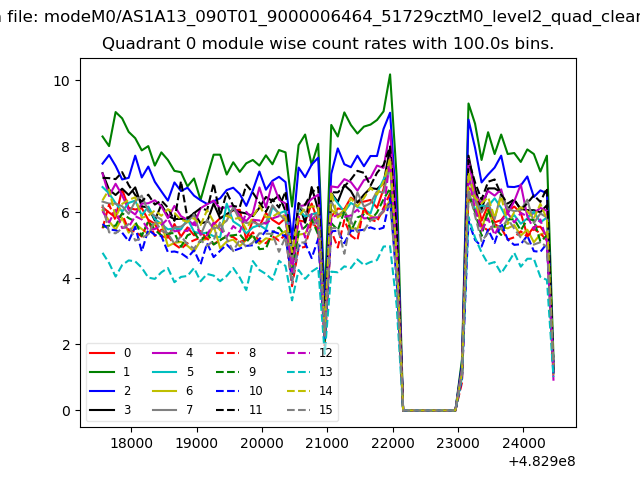 |
 |
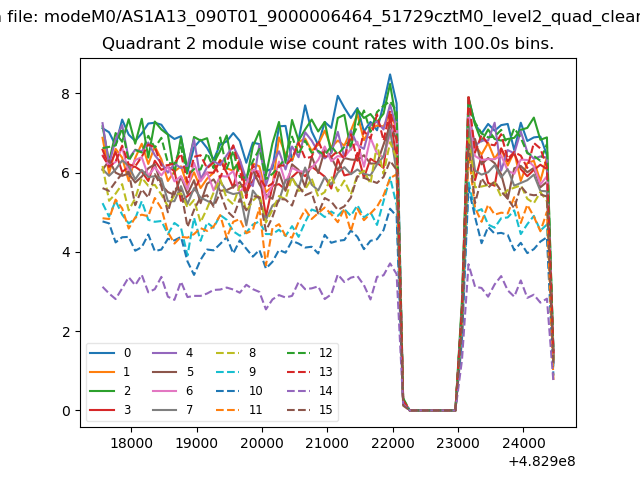
| Module-wise count rates for Quadrant B Data is divided into 100 sec bins |
 |
 |
| Module-wise count rates for Quadrant C Data is divided into 100 sec bins |
 |
 |
| Module-wise count rates for Quadrant D Data is divided into 100 sec bins |
 |
 |
| Parameter | Plot |
|---|---|
| CZT HV Monitor | 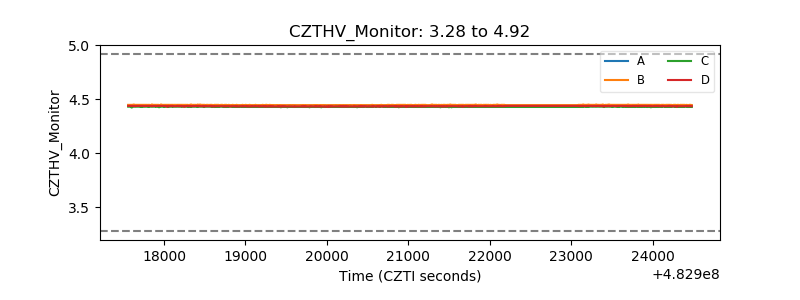 |
| D_VDD | 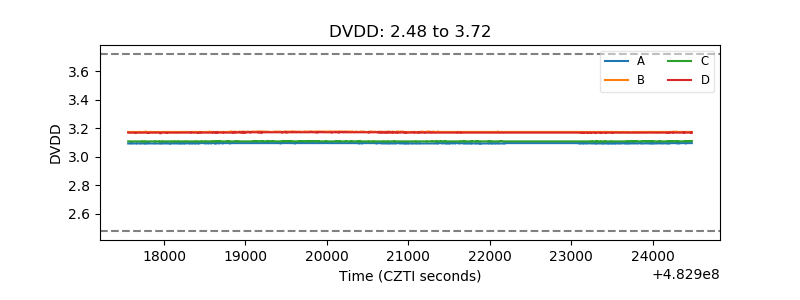 |
| Temperature 1 | 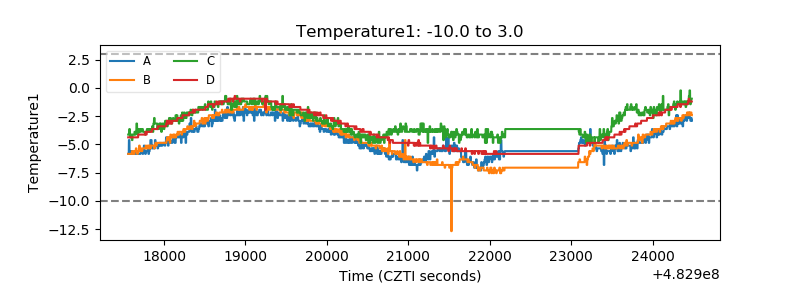 |
| Veto HV Monitor |  |
| Veto LLD | 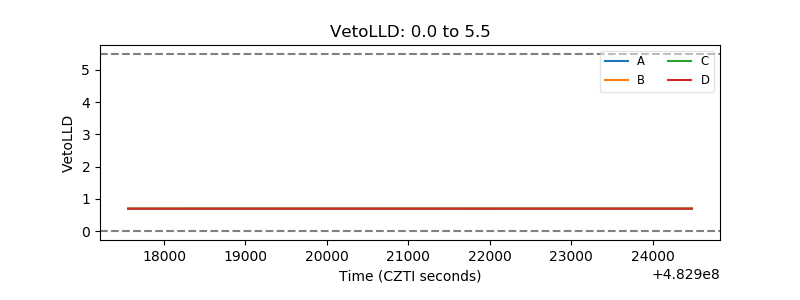 |
| Alpha Counter | 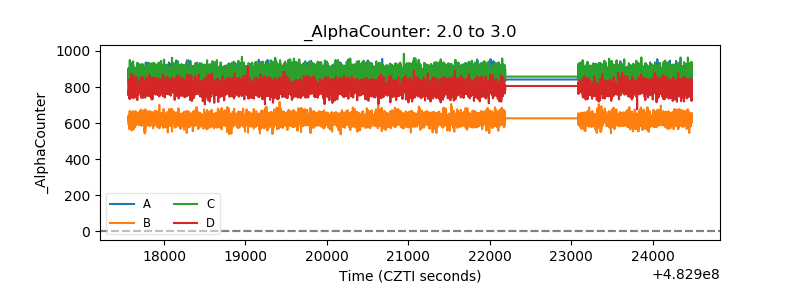 |
| _CPM_Rate | 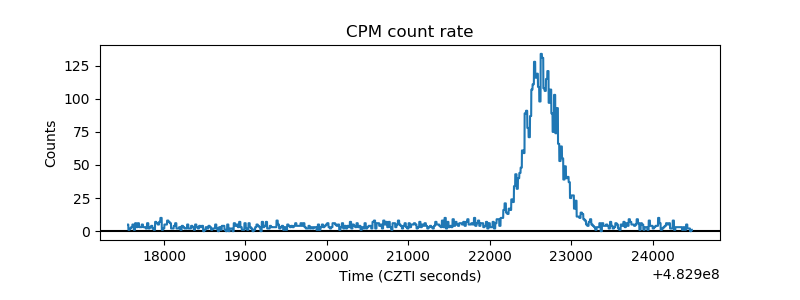 |
| CZT Counter | 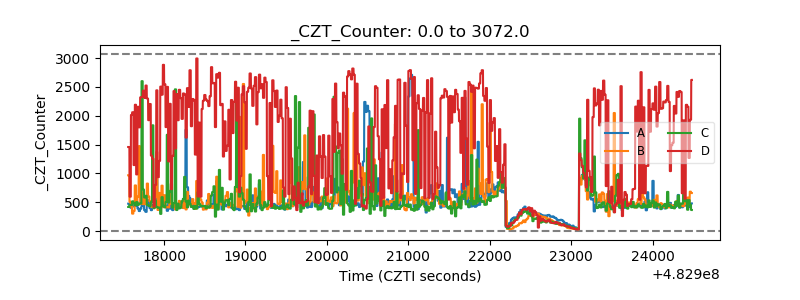 |
| +2.5 Volts monitor | 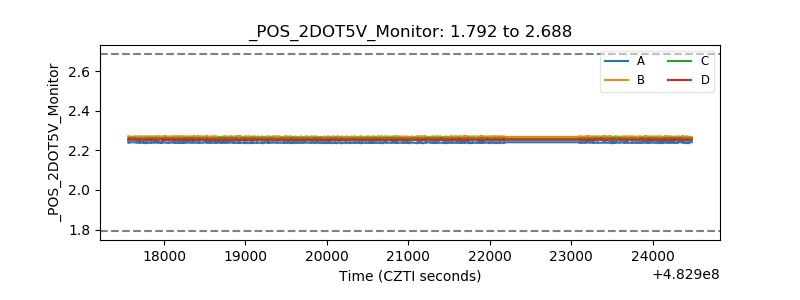 |
| +5 Volts monitor | 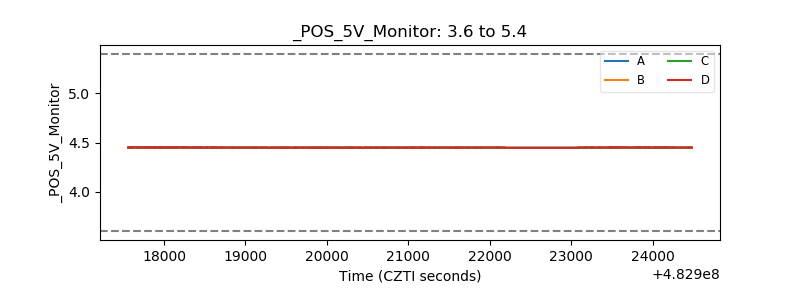 |
| _ROLL_ROT | 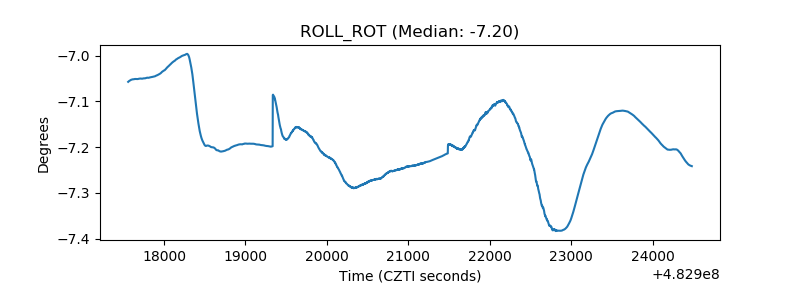 |
| _Roll_DEC |  |
| _Roll_RA | 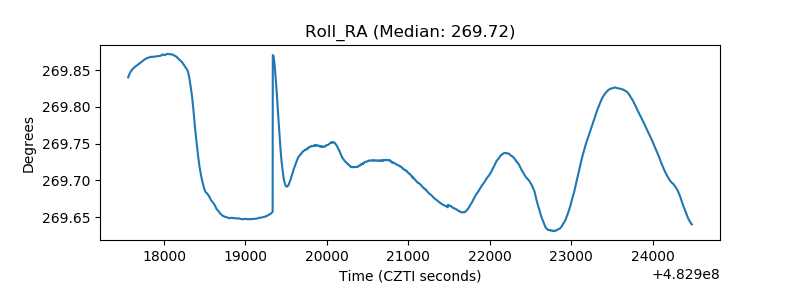 |
| Veto Counter | 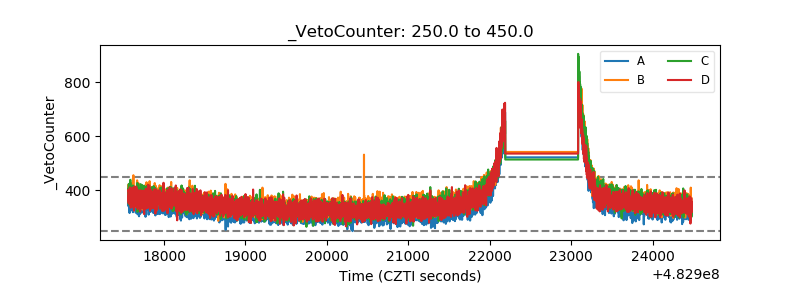 |