| Param | Original file | Final file |
|---|---|---|
| Filename | modeM0/AS1A13_090T01_9000006464_51730cztM0_level2.fits | modeM0/AS1A13_090T01_9000006464_51730cztM0_level2_quad_clean.evt |
| Size (bytes) | 782,726,400 | 95,685,120 |
| Size | 746.5 MB | 91.3 MB |
| Events in quadrant A | 6,172,801 | 669,782 |
| Events in quadrant B | 5,008,559 | 734,279 |
| Events in quadrant C | 4,456,253 | 667,565 |
| Events in quadrant D | 12,765,925 | 313,136 |
| Mode M9 | |||
|---|---|---|---|
| Quadrant | BADHDUFLAG | Total packets | Discarded packets |
| A | 0 | 10 | 0 |
| B | 0 | 11 | 0 |
| C | 0 | 11 | 0 |
| D | 0 | 11 | 0 |
| Mode SS | |||
|---|---|---|---|
| Quadrant | BADHDUFLAG | Total packets | Discarded packets |
| A | 0 | 152 | 0 |
| B | 0 | 152 | 0 |
| C | 0 | 152 | 0 |
| D | 0 | 152 | 0 |
| Mode M0 | |||
|---|---|---|---|
| Quadrant | BADHDUFLAG | Total packets | Discarded packets |
| A | 0 | 23458 | 3 |
| B | 0 | 19854 | 3 |
| C | 0 | 18395 | 3 |
| D | 0 | 42985 | 3 |
| Quadrant | Total seconds | Saturated seconds | Saturation percentage |
|---|---|---|---|
| A | 7357 | 636 | 8.644828% |
| B | 7357 | 454 | 6.170994% |
| C | 7357 | 378 | 5.137964% |
| D | 7357 | 4038 | 54.886503% |
Noise dominated data is calculated using 1-second bins in cleaned event files. If a bin has >2000 counts, and if more than 50% of those come from <1% of pixels, then it is considered to be noise-dominated and hence unusable.
| Quadrant | # 1 sec bins | Bins with >0 counts | Bins with >2000 counts | High rate bins dominated by noise | Noise dominated (total time) | Noise dominated (detector-on time) | Marked lightcurve |
|---|---|---|---|---|---|---|---|
| A | 7992 | 7358 | 304 | 304 | 3.80% | 4.13% | 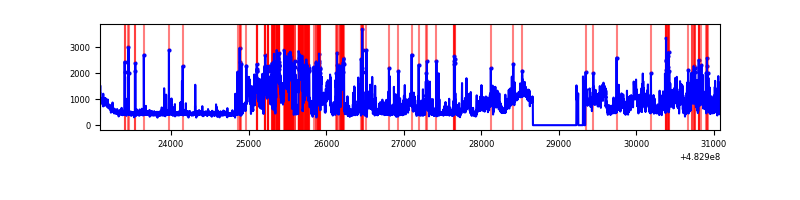 |
| B | 7992 | 7358 | 121 | 121 | 1.51% | 1.64% | 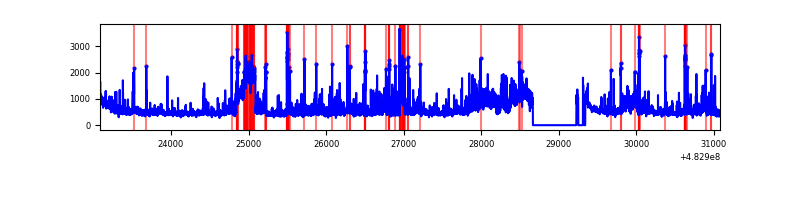 |
| C | 7992 | 7359 | 182 | 182 | 2.28% | 2.47% | 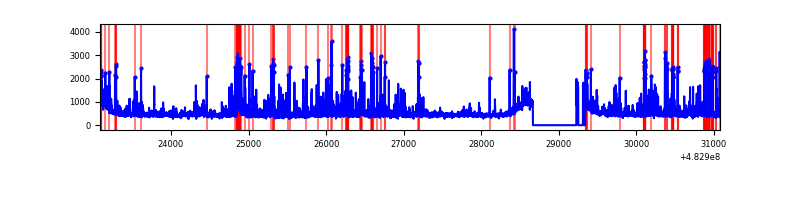 |
| D | 7992 | 7357 | 3535 | 3535 | 44.23% | 48.05% | 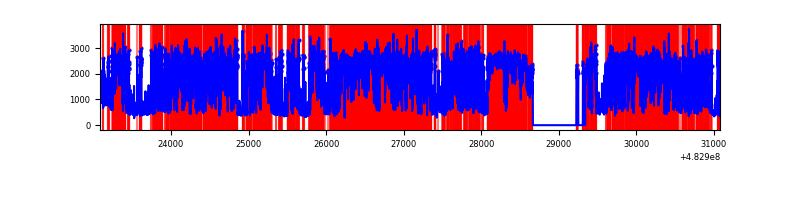 |
Top three noisy pixels from each quadrant. If the there are fewer than three noisy pixels in the level2.evt file, extra rows are filled as -1
| Pixel properties | Quadrant properties | ||||||
|---|---|---|---|---|---|---|---|
| Quadrant | DetID | PixID | Counts | Sigma | Mean | Median | Sigma |
| A | 12 | 3 | 1048030 | 5113.71 | 829 | 807 | 204.8 |
| A | 4 | 175 | 1007870 | 4917.6 | 829 | 807 | 204.8 |
| A | 11 | 3 | 207567 | 1009.63 | 829 | 807 | 204.8 |
| B | 5 | 172 | 328772 | 1847.53 | 815 | 786 | 177.5 |
| B | 10 | 254 | 325576 | 1829.53 | 815 | 786 | 177.5 |
| B | 1 | 255 | 123096 | 688.97 | 815 | 786 | 177.5 |
| C | 15 | 231 | 219959 | 987.93 | 805 | 797 | 221.8 |
| C | 13 | 3 | 215689 | 968.69 | 805 | 797 | 221.8 |
| C | 12 | 250 | 206887 | 929.01 | 805 | 797 | 221.8 |
| D | 11 | 129 | 9930793 | 62907.49 | 563 | 542 | 157.9 |
| D | 8 | 176 | 260225 | 1645.07 | 563 | 542 | 157.9 |
| D | 2 | 249 | 152057 | 959.84 | 563 | 542 | 157.9 |
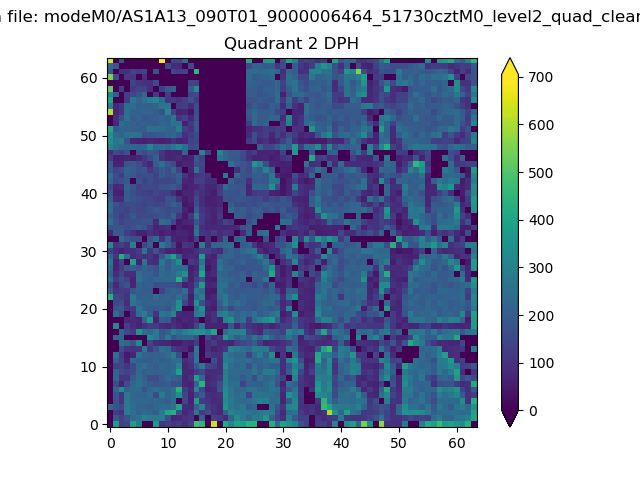
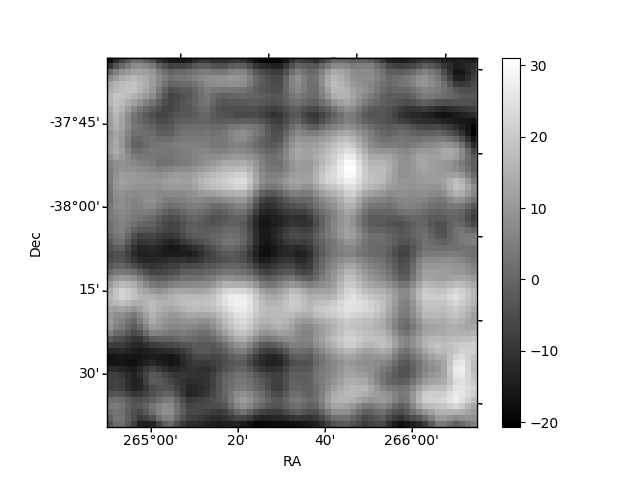
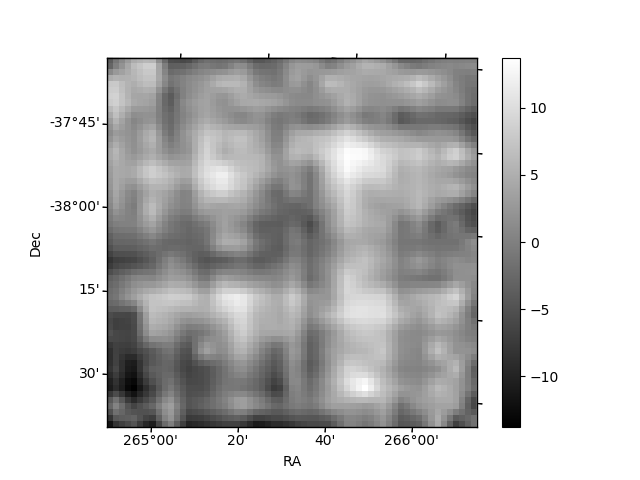
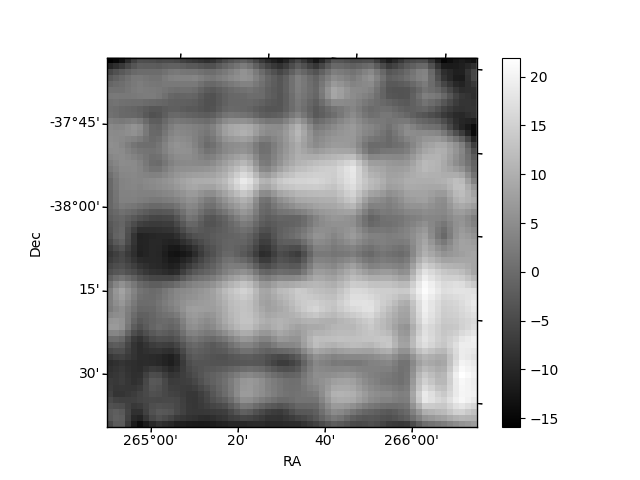
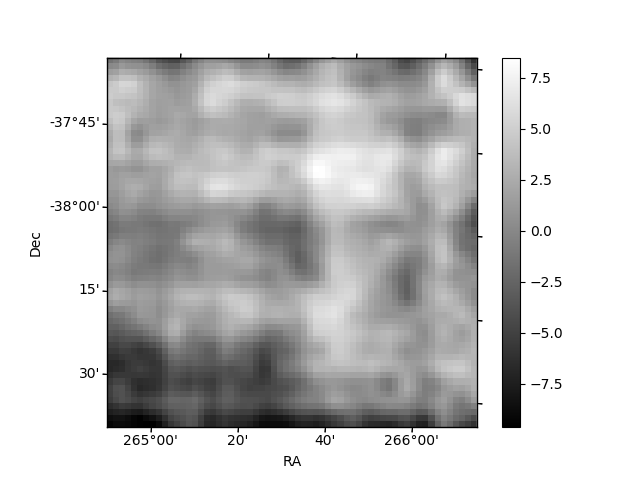
Histogram calculated using DETX and DETY for each event in the final _common_clean file
| Quadrant A | 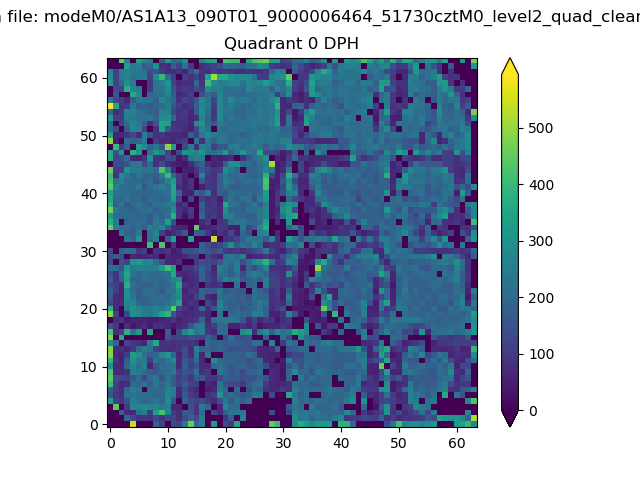 |
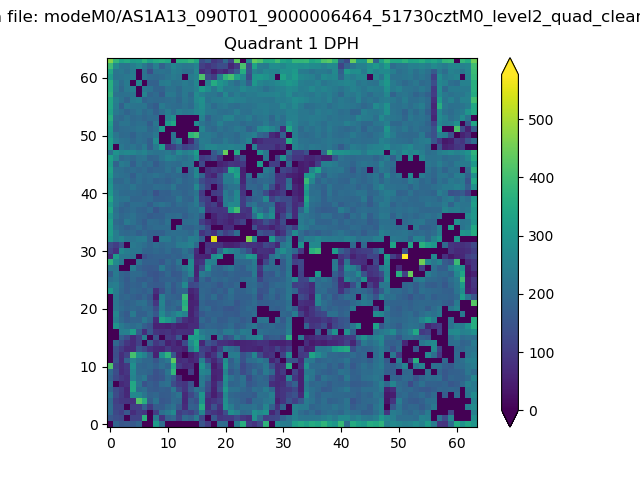 |
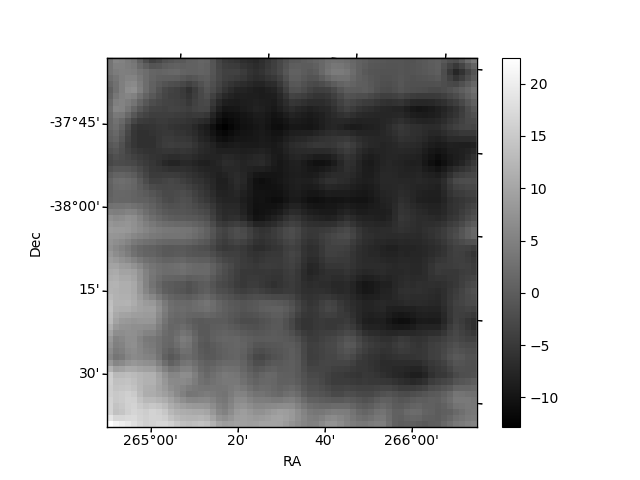
Quadrant B |
|---|---|---|---|
| Quadrant D | 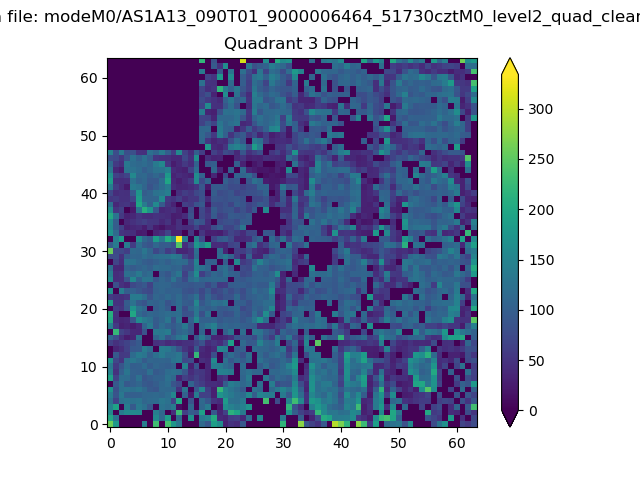 |
 |
Quadrant C |
| Plot type | Count rate plots | Images |
|---|---|---|
| Comparison with Poisson distribution Blue bars denote a histogram of data divided into 1 sec bins. Red curve is a Poisson curve with rate = median count rate of data. |
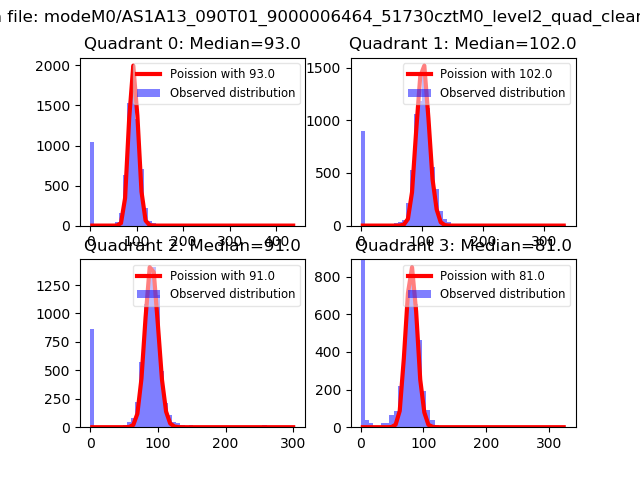 |
 |
| Quadrant-wise count rates Data is divided into 100 sec bins |
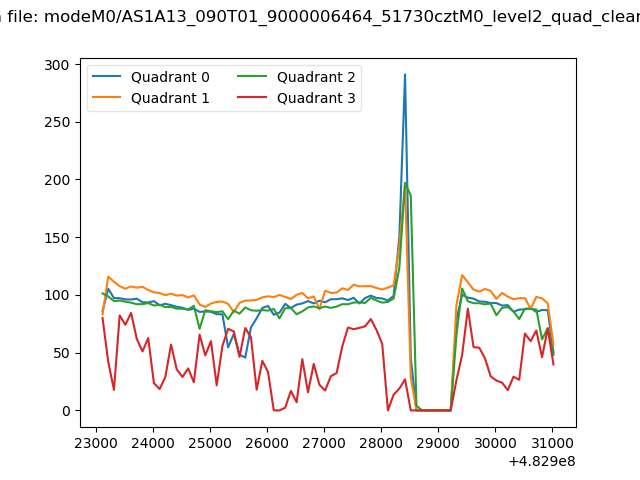 |
|
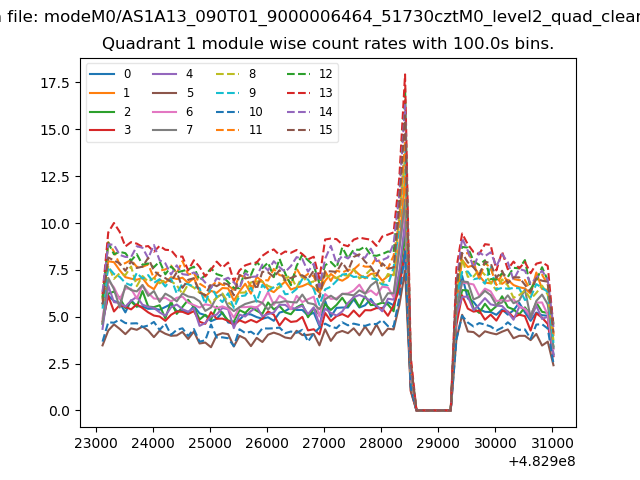
| Module-wise count rates for Quadrant A Data is divided into 100 sec bins |
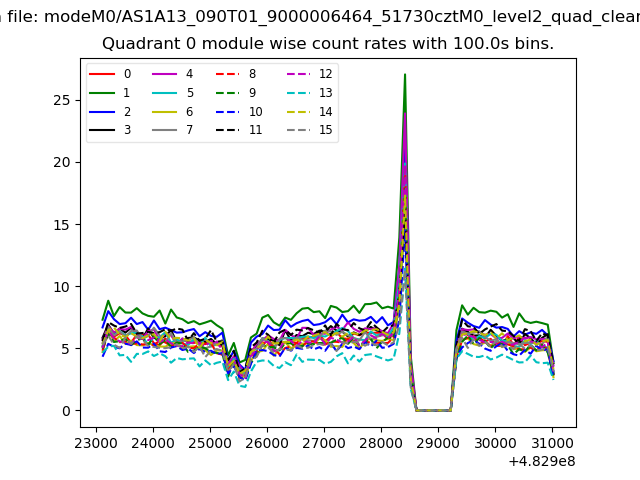 |
 |
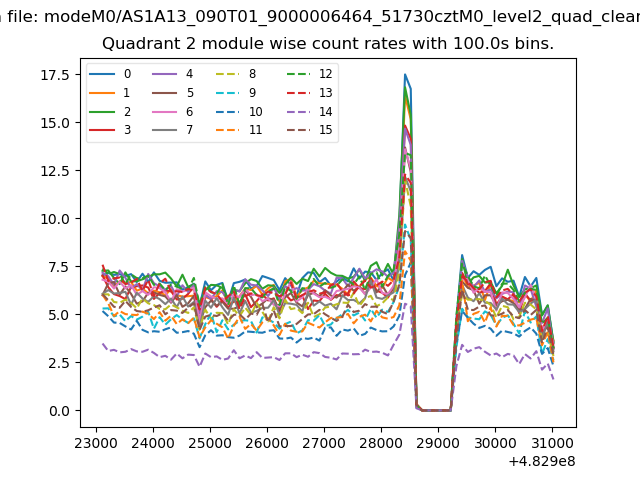
| Module-wise count rates for Quadrant B Data is divided into 100 sec bins |
 |
 |
| Module-wise count rates for Quadrant C Data is divided into 100 sec bins |
 |
 |
| Module-wise count rates for Quadrant D Data is divided into 100 sec bins |
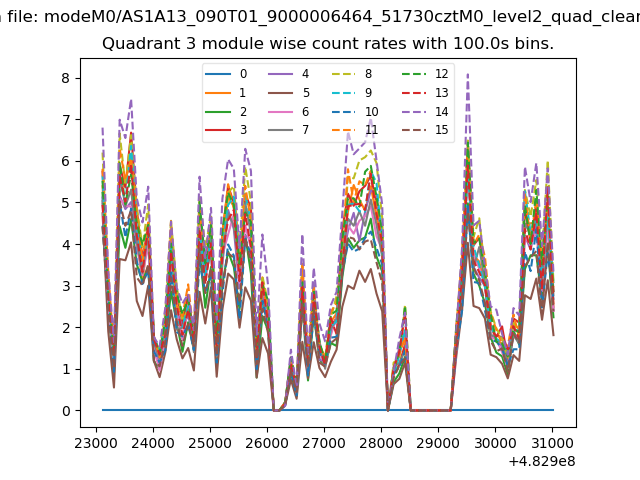 |
 |
| Parameter | Plot |
|---|---|
| CZT HV Monitor |  |
| D_VDD | 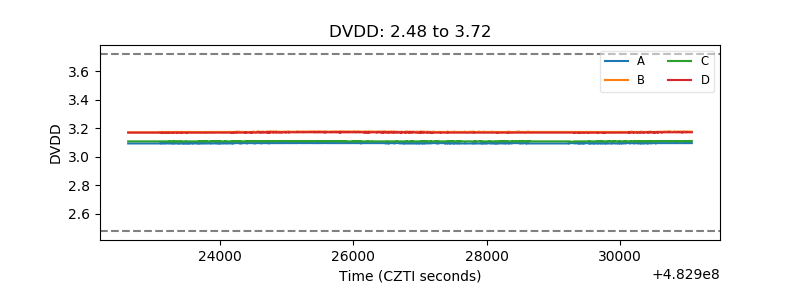 |
| Temperature 1 | 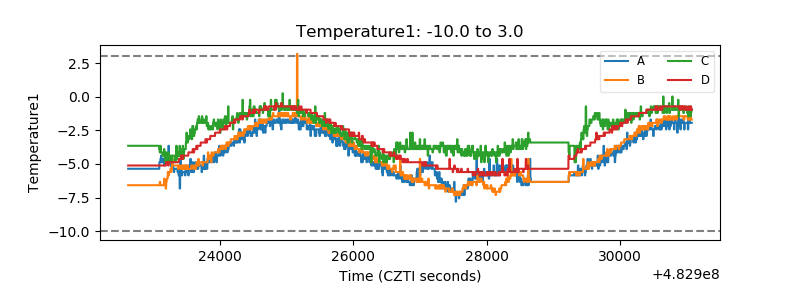 |
| Veto HV Monitor | 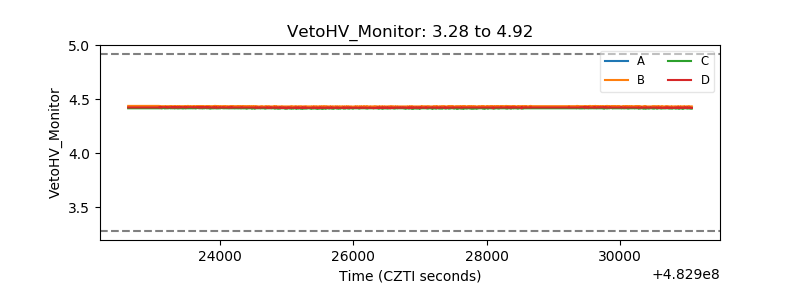 |
| Veto LLD | 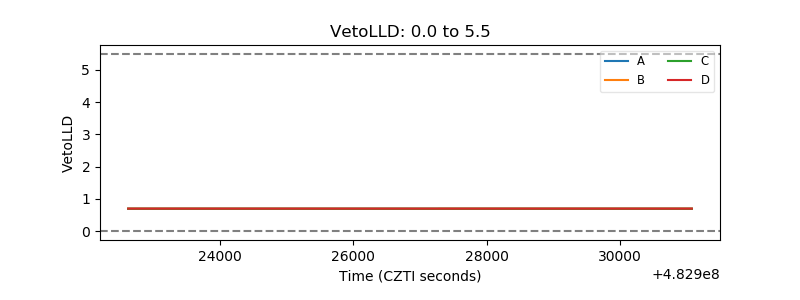 |
| Alpha Counter | 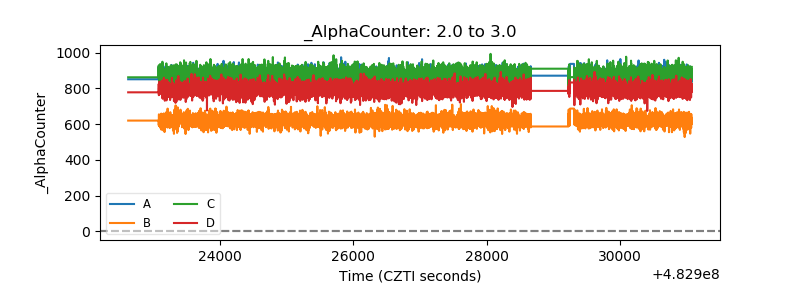 |
| _CPM_Rate | 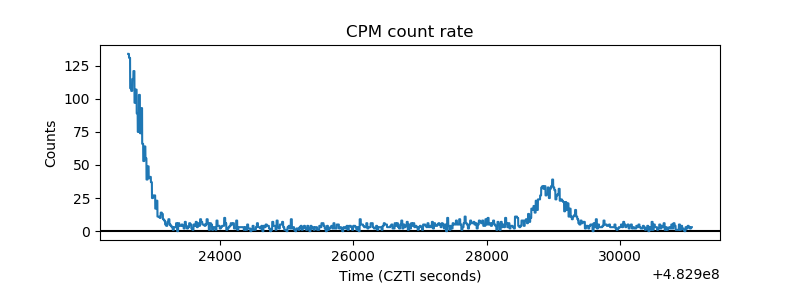 |
| CZT Counter | 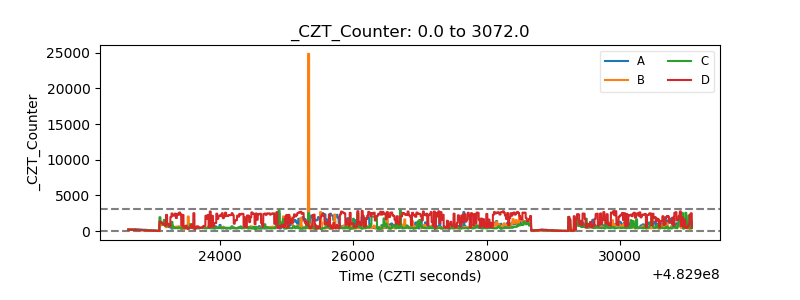 |
| +2.5 Volts monitor | 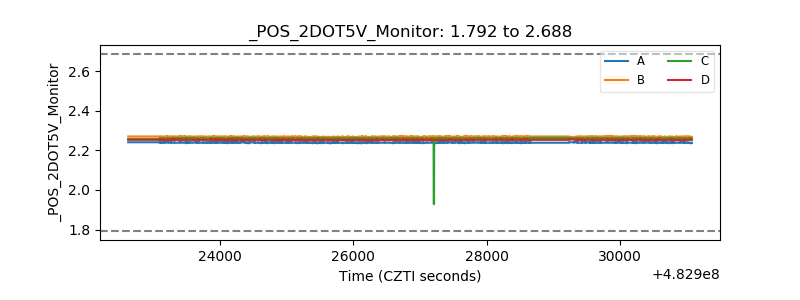 |
| +5 Volts monitor | 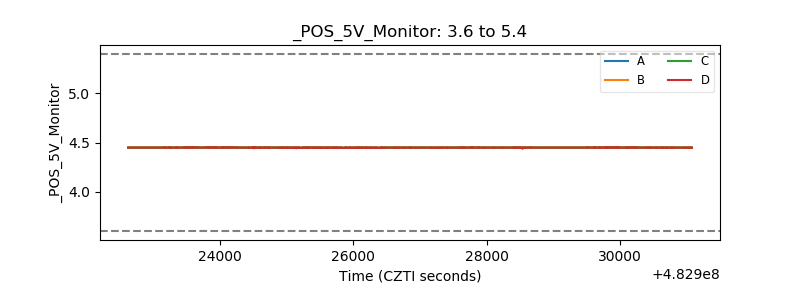 |
| _ROLL_ROT | 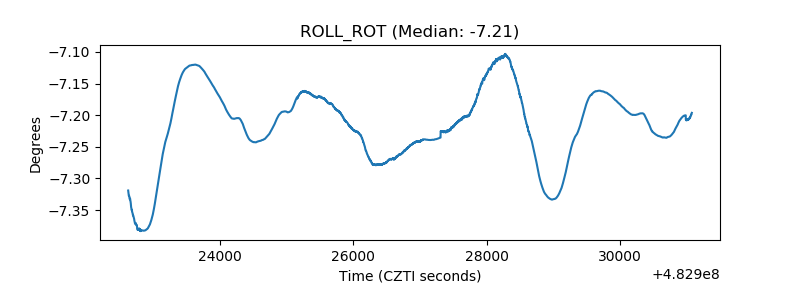 |
| _Roll_DEC |  |
| _Roll_RA | 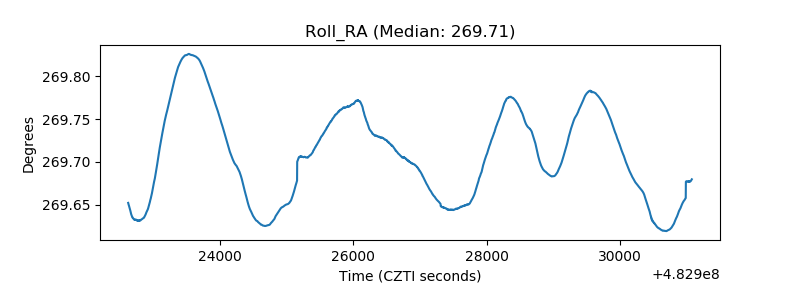 |
| Veto Counter | 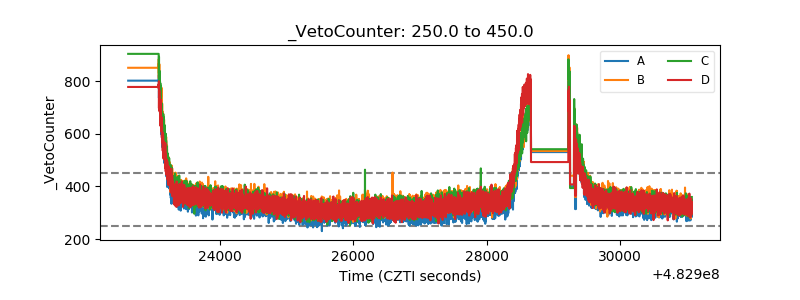 |