| Param | Original file | Final file |
|---|---|---|
| Filename | modeM0/AS1A13_090T01_9000006464_51731cztM0_level2.fits | modeM0/AS1A13_090T01_9000006464_51731cztM0_level2_quad_clean.evt |
| Size (bytes) | 855,400,320 | 101,217,600 |
| Size | 815.8 MB | 96.5 MB |
| Events in quadrant A | 6,997,180 | 694,045 |
| Events in quadrant B | 5,195,868 | 774,256 |
| Events in quadrant C | 4,974,535 | 704,510 |
| Events in quadrant D | 13,887,897 | 344,944 |
| Mode SS | |||
|---|---|---|---|
| Quadrant | BADHDUFLAG | Total packets | Discarded packets |
| A | 0 | 158 | 0 |
| B | 0 | 158 | 0 |
| C | 0 | 158 | 0 |
| D | 0 | 158 | 0 |
| Mode M0 | |||
|---|---|---|---|
| Quadrant | BADHDUFLAG | Total packets | Discarded packets |
| A | 0 | 26321 | 0 |
| B | 0 | 20689 | 0 |
| C | 0 | 20232 | 0 |
| D | 0 | 46678 | 0 |
| Quadrant | Total seconds | Saturated seconds | Saturation percentage |
|---|---|---|---|
| A | 7859 | 721 | 9.174195% |
| B | 7859 | 401 | 5.102430% |
| C | 7860 | 278 | 3.536896% |
| D | 7860 | 4215 | 53.625954% |
Noise dominated data is calculated using 1-second bins in cleaned event files. If a bin has >2000 counts, and if more than 50% of those come from <1% of pixels, then it is considered to be noise-dominated and hence unusable.
| Quadrant | # 1 sec bins | Bins with >0 counts | Bins with >2000 counts | High rate bins dominated by noise | Noise dominated (total time) | Noise dominated (detector-on time) | Marked lightcurve |
|---|---|---|---|---|---|---|---|
| A | 7859 | 7859 | 459 | 459 | 5.84% | 5.84% | 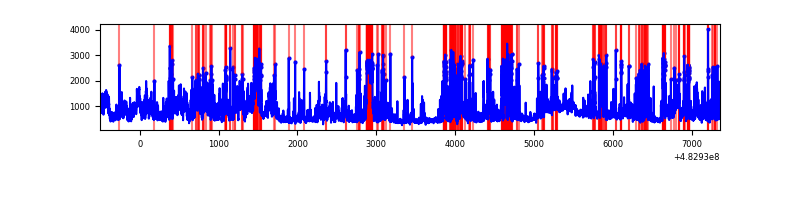 |
| B | 7859 | 7859 | 137 | 137 | 1.74% | 1.74% | 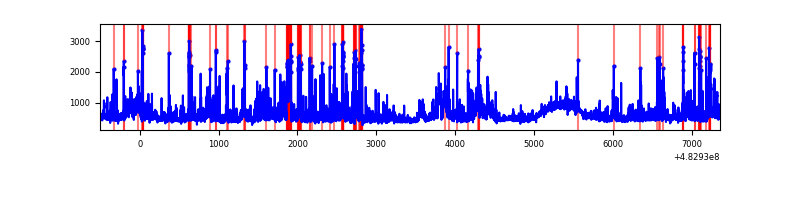 |
| C | 7860 | 7860 | 195 | 195 | 2.48% | 2.48% | 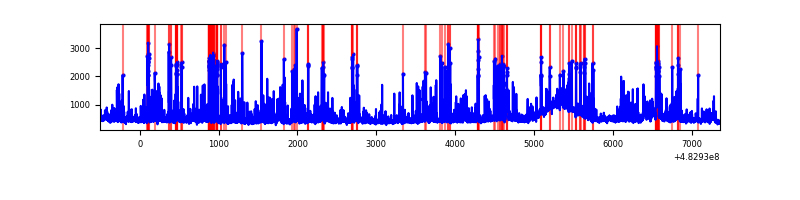 |
| D | 7860 | 7860 | 3797 | 3797 | 48.31% | 48.31% | 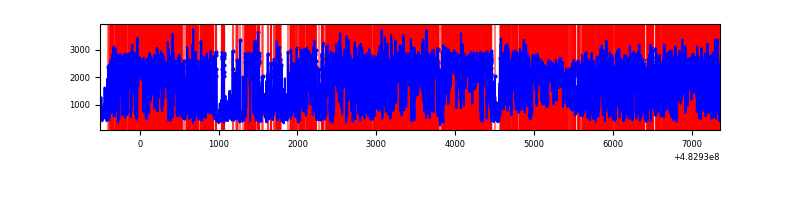 |
Top three noisy pixels from each quadrant. If the there are fewer than three noisy pixels in the level2.evt file, extra rows are filled as -1
| Pixel properties | Quadrant properties | ||||||
|---|---|---|---|---|---|---|---|
| Quadrant | DetID | PixID | Counts | Sigma | Mean | Median | Sigma |
| A | 12 | 3 | 1008947 | 4794.93 | 867 | 847 | 210.2 |
| A | 0 | 111 | 908962 | 4319.36 | 867 | 847 | 210.2 |
| A | 4 | 175 | 443446 | 2105.18 | 867 | 847 | 210.2 |
| B | 4 | 174 | 267835 | 1411.0 | 873 | 843 | 189.2 |
| B | 1 | 239 | 216556 | 1140.0 | 873 | 843 | 189.2 |
| B | 0 | 216 | 149718 | 786.77 | 873 | 843 | 189.2 |
| C | 13 | 3 | 318189 | 1357.38 | 855 | 849 | 233.8 |
| C | 3 | 233 | 290356 | 1238.32 | 855 | 849 | 233.8 |
| C | 15 | 231 | 199342 | 849.02 | 855 | 849 | 233.8 |
| D | 11 | 129 | 10813844 | 63169.18 | 615 | 593 | 171.2 |
| D | 8 | 176 | 134446 | 781.95 | 615 | 593 | 171.2 |
| D | 2 | 120 | 123405 | 717.45 | 615 | 593 | 171.2 |
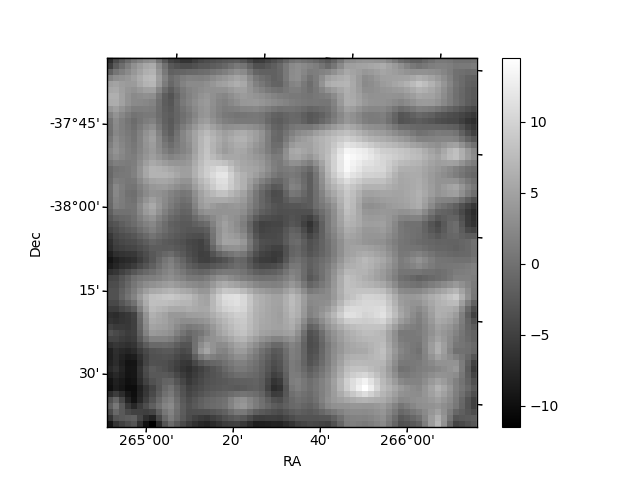
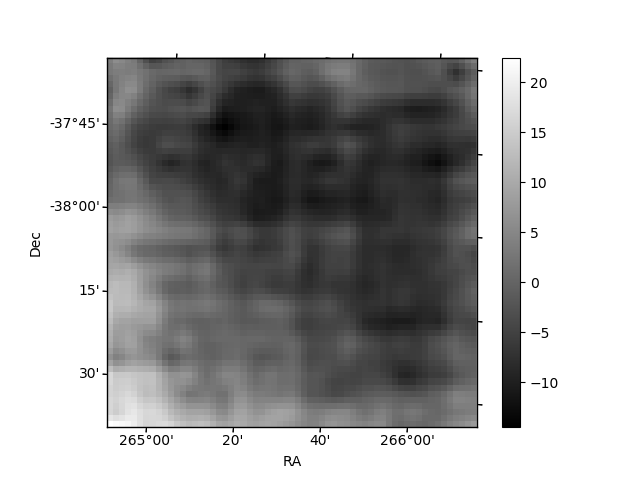
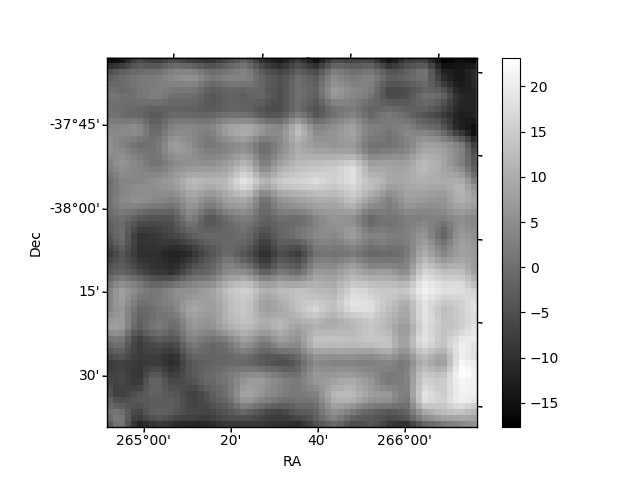
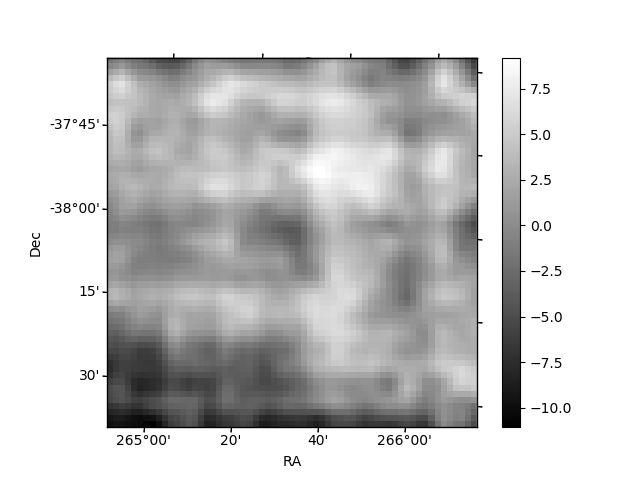
Histogram calculated using DETX and DETY for each event in the final _common_clean file
| Quadrant A | 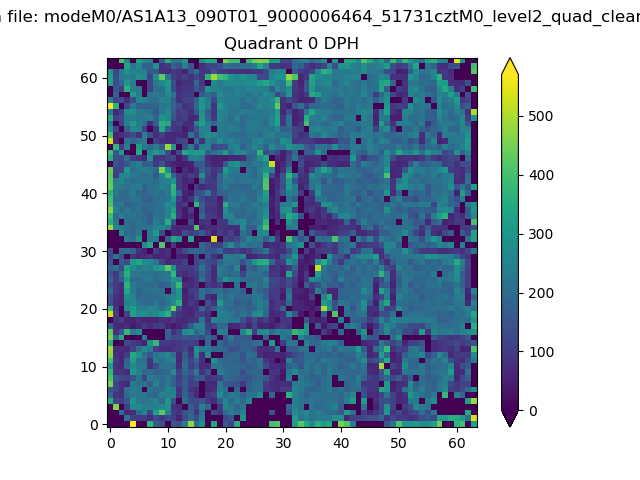 |
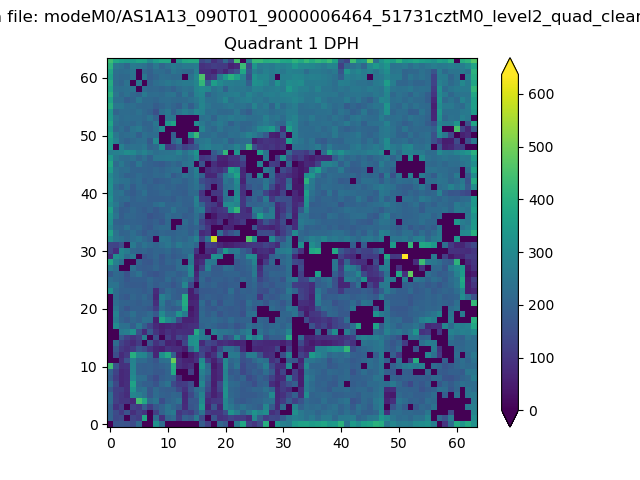 |
Quadrant B |
|---|---|---|---|
| Quadrant D | 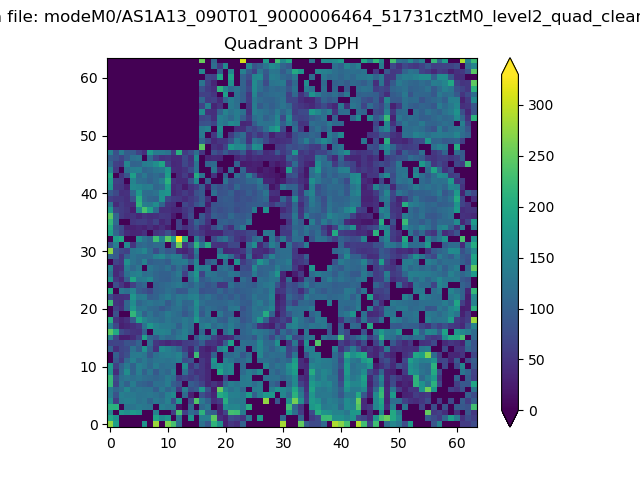 |
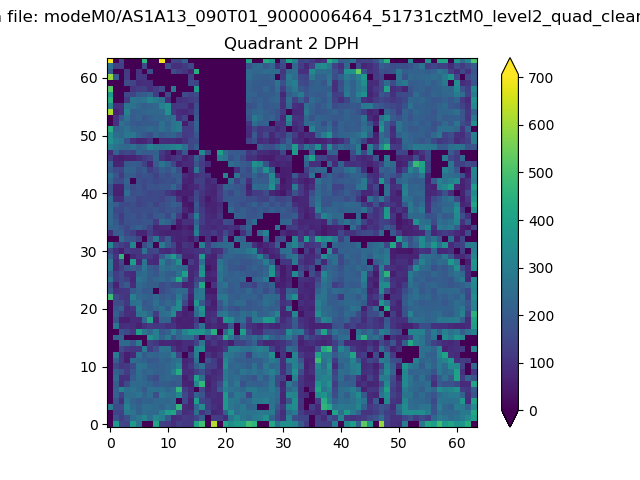 |
Quadrant C |
| Plot type | Count rate plots | Images |
|---|---|---|
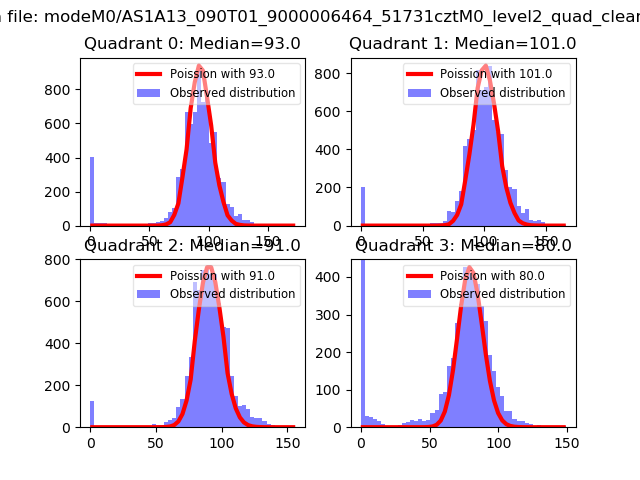
| Comparison with Poisson distribution Blue bars denote a histogram of data divided into 1 sec bins. Red curve is a Poisson curve with rate = median count rate of data. |
 |
 |
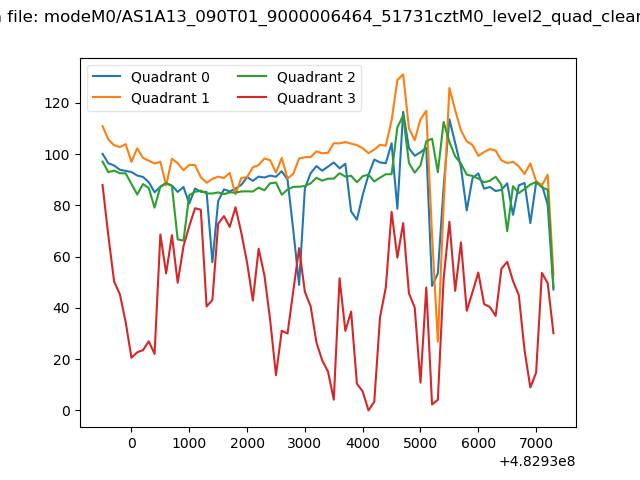
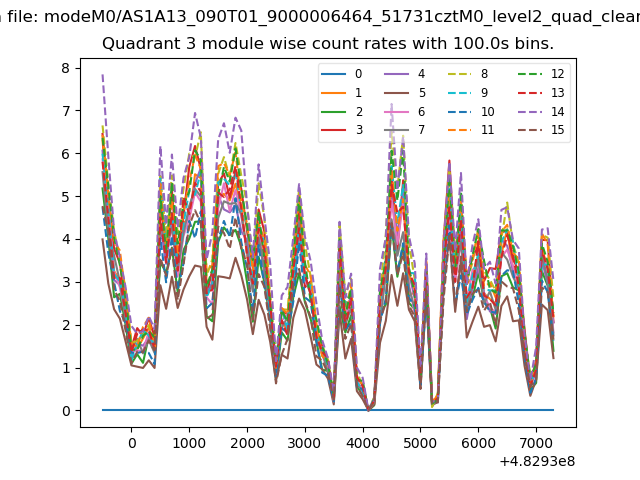
| Quadrant-wise count rates Data is divided into 100 sec bins |
 |
|
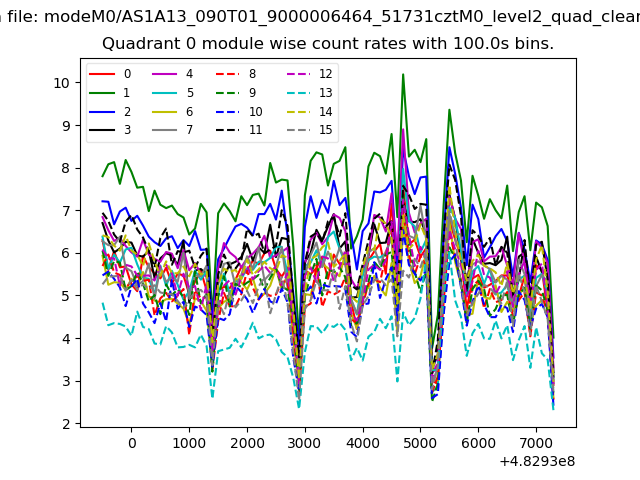
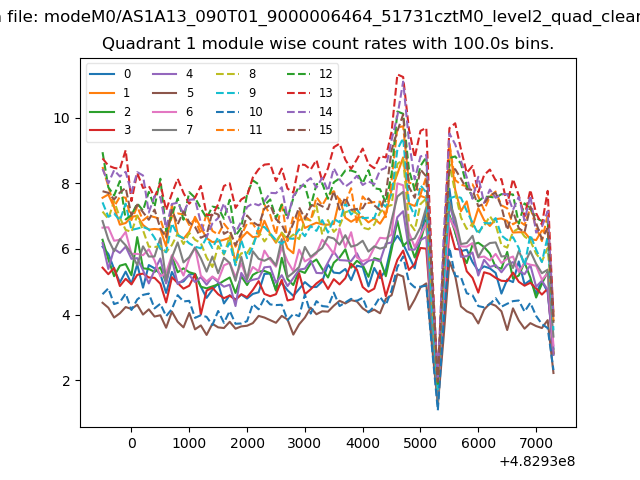
| Module-wise count rates for Quadrant A Data is divided into 100 sec bins |
 |
 |
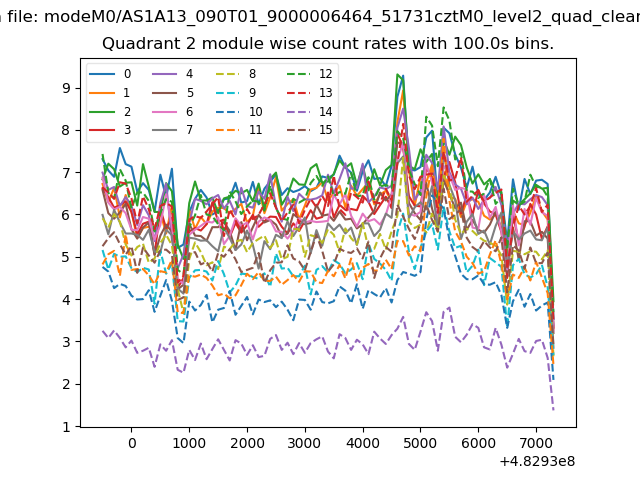
| Module-wise count rates for Quadrant B Data is divided into 100 sec bins |
 |
 |
| Module-wise count rates for Quadrant C Data is divided into 100 sec bins |
 |
 |
| Module-wise count rates for Quadrant D Data is divided into 100 sec bins |
 |
 |
| Parameter | Plot |
|---|---|
| CZT HV Monitor | 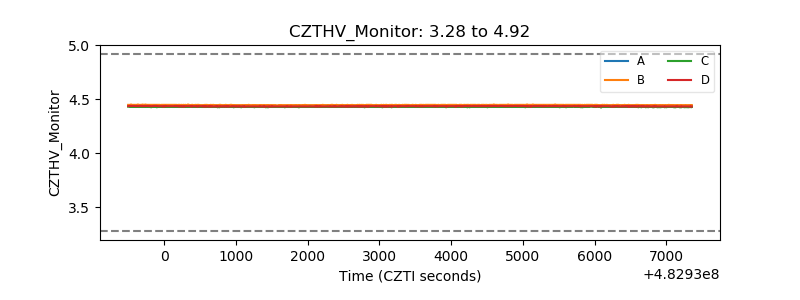 |
| D_VDD | 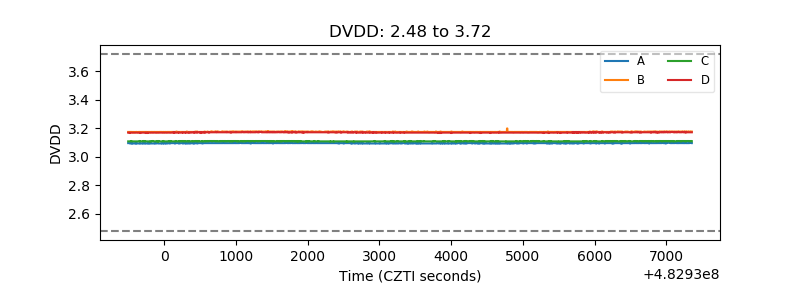 |
| Temperature 1 | 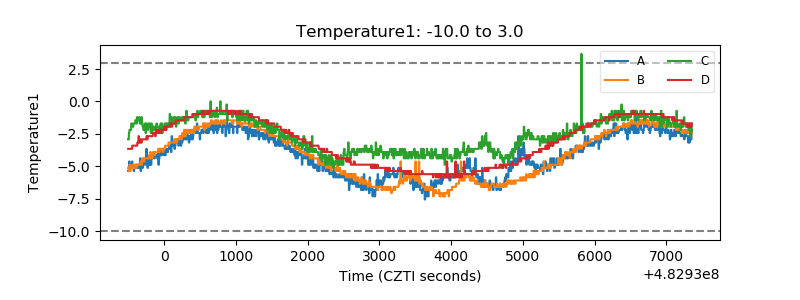 |
| Veto HV Monitor | 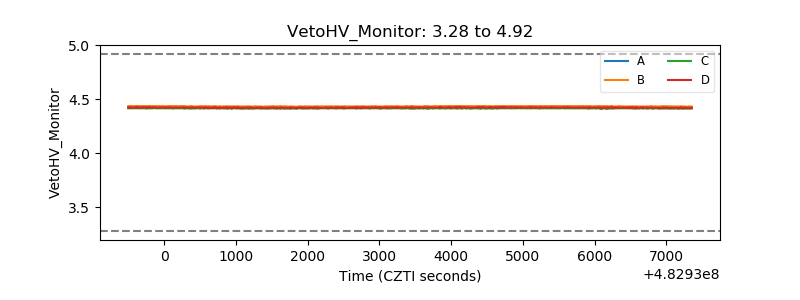 |
| Veto LLD | 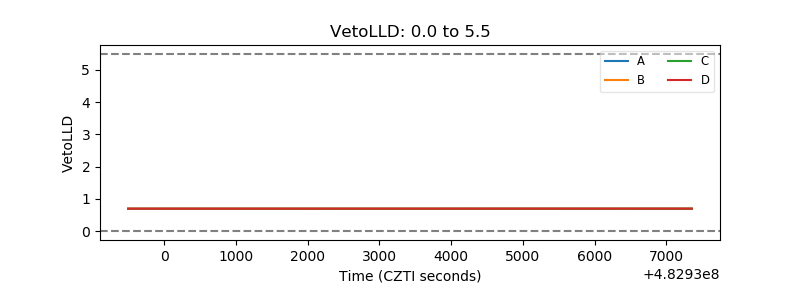 |
| Alpha Counter | 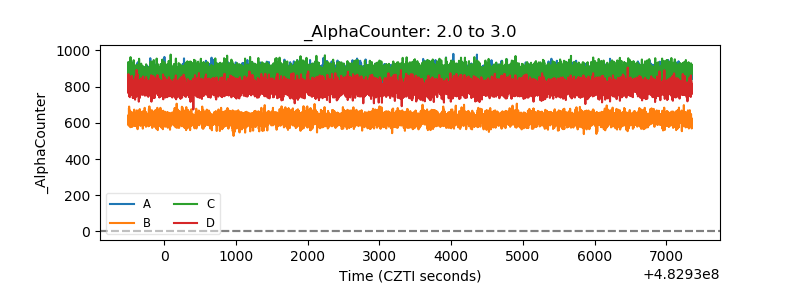 |
| _CPM_Rate | 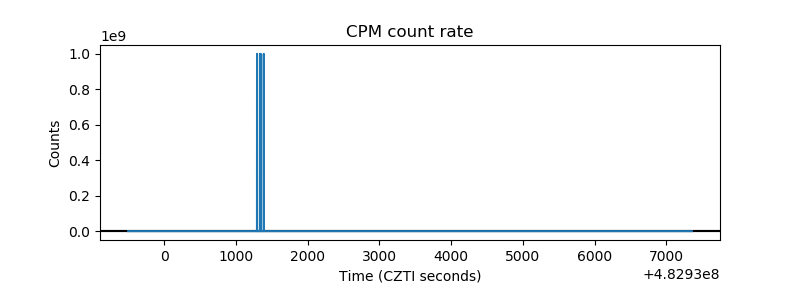 |
| CZT Counter | 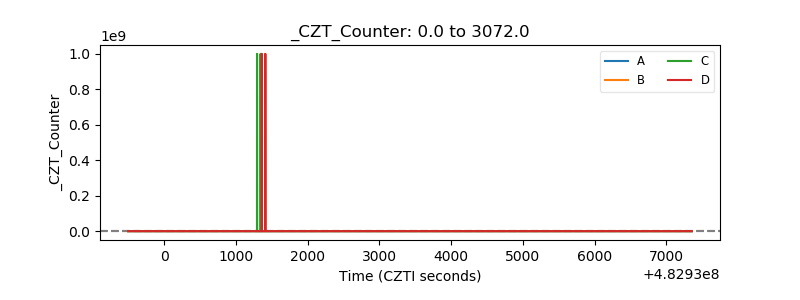 |
| +2.5 Volts monitor | 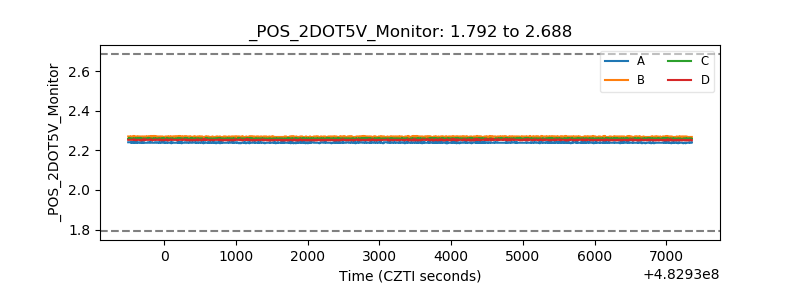 |
| +5 Volts monitor | 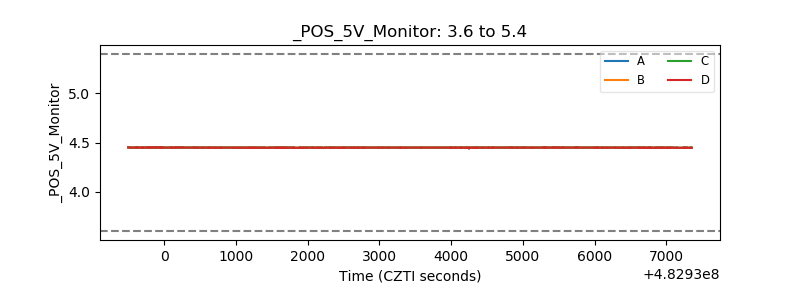 |
| _ROLL_ROT | 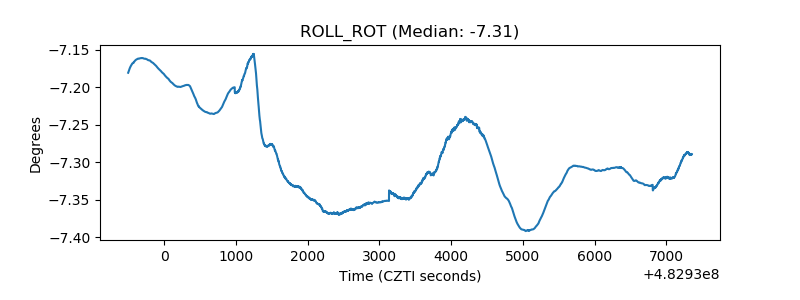 |
| _Roll_DEC | 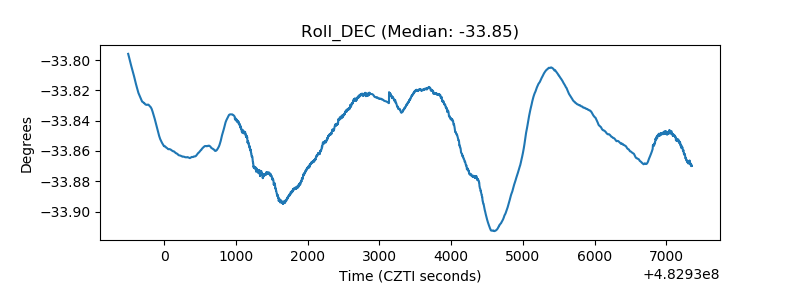 |
| _Roll_RA | 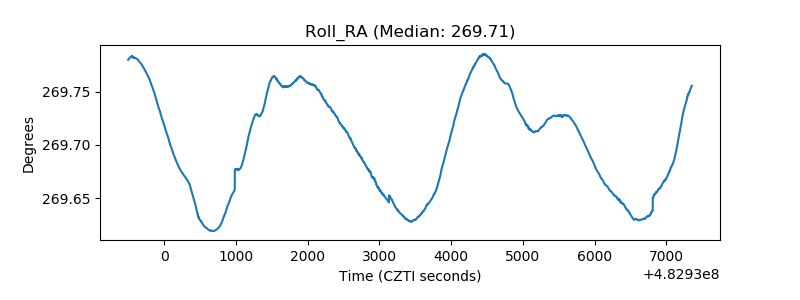 |
| Veto Counter | 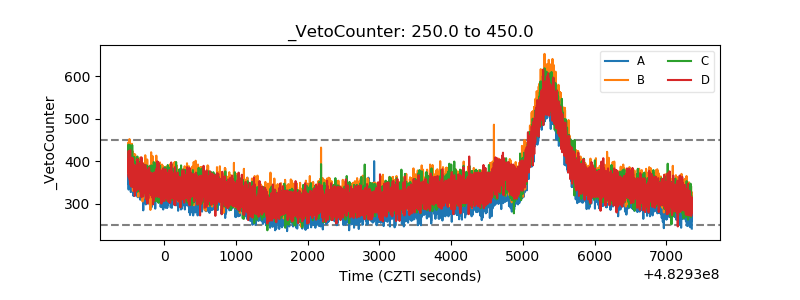 |