| Param | Original file | Final file |
|---|---|---|
| Filename | modeM0/AS1A13_090T01_9000006464_51732cztM0_level2.fits | modeM0/AS1A13_090T01_9000006464_51732cztM0_level2_quad_clean.evt |
| Size (bytes) | 824,771,520 | 113,140,800 |
| Size | 786.6 MB | 107.9 MB |
| Events in quadrant A | 6,038,237 | 845,044 |
| Events in quadrant B | 5,189,420 | 857,286 |
| Events in quadrant C | 4,834,046 | 760,243 |
| Events in quadrant D | 13,878,830 | 433,156 |
| Mode SS | |||
|---|---|---|---|
| Quadrant | BADHDUFLAG | Total packets | Discarded packets |
| A | 0 | 152 | 0 |
| B | 0 | 152 | 0 |
| C | 0 | 152 | 0 |
| D | 0 | 152 | 0 |
| Mode M0 | |||
|---|---|---|---|
| Quadrant | BADHDUFLAG | Total packets | Discarded packets |
| A | 0 | 23279 | 0 |
| B | 0 | 20576 | 0 |
| C | 0 | 19682 | 0 |
| D | 0 | 46506 | 5 |
| Quadrant | Total seconds | Saturated seconds | Saturation percentage |
|---|---|---|---|
| A | 7620 | 319 | 4.186352% |
| B | 7621 | 234 | 3.070463% |
| C | 7621 | 206 | 2.703057% |
| D | 7620 | 4036 | 52.965879% |
Noise dominated data is calculated using 1-second bins in cleaned event files. If a bin has >2000 counts, and if more than 50% of those come from <1% of pixels, then it is considered to be noise-dominated and hence unusable.
| Quadrant | # 1 sec bins | Bins with >0 counts | Bins with >2000 counts | High rate bins dominated by noise | Noise dominated (total time) | Noise dominated (detector-on time) | Marked lightcurve |
|---|---|---|---|---|---|---|---|
| A | 7620 | 7620 | 270 | 270 | 3.54% | 3.54% | 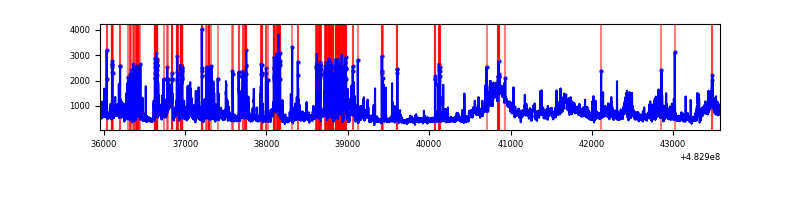 |
| B | 7621 | 7621 | 182 | 182 | 2.39% | 2.39% | 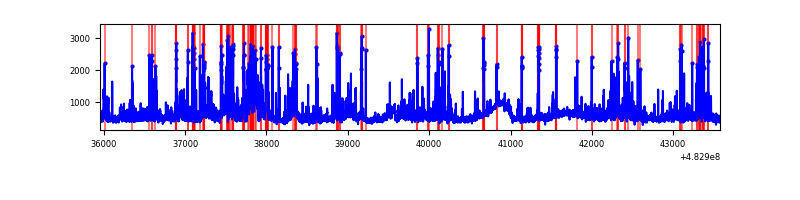 |
| C | 7621 | 7621 | 175 | 175 | 2.30% | 2.30% | 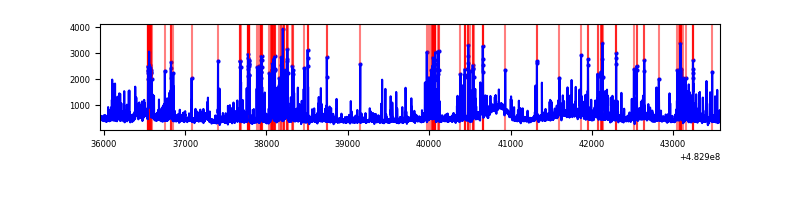 |
| D | 7619 | 7619 | 3806 | 3806 | 49.95% | 49.95% | 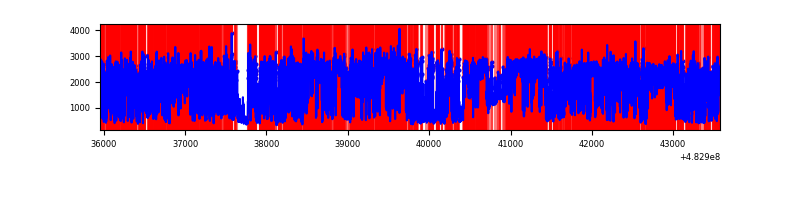 |
Top three noisy pixels from each quadrant. If the there are fewer than three noisy pixels in the level2.evt file, extra rows are filled as -1
| Pixel properties | Quadrant properties | ||||||
|---|---|---|---|---|---|---|---|
| Quadrant | DetID | PixID | Counts | Sigma | Mean | Median | Sigma |
| A | 12 | 3 | 844340 | 3824.77 | 862 | 843 | 220.5 |
| A | 0 | 111 | 807734 | 3658.79 | 862 | 843 | 220.5 |
| A | 4 | 175 | 197287 | 890.76 | 862 | 843 | 220.5 |
| B | 4 | 174 | 491533 | 2704.33 | 838 | 811 | 181.5 |
| B | 4 | 206 | 218031 | 1197.08 | 838 | 811 | 181.5 |
| B | 10 | 254 | 179870 | 986.78 | 838 | 811 | 181.5 |
| C | 13 | 3 | 411950 | 1776.42 | 820 | 812 | 231.4 |
| C | 12 | 249 | 170708 | 734.08 | 820 | 812 | 231.4 |
| C | 3 | 233 | 155612 | 668.85 | 820 | 812 | 231.4 |
| D | 11 | 129 | 10398246 | 58218.66 | 610 | 586 | 178.6 |
| D | 7 | 159 | 205417 | 1146.89 | 610 | 586 | 178.6 |
| D | 2 | 249 | 156921 | 875.35 | 610 | 586 | 178.6 |
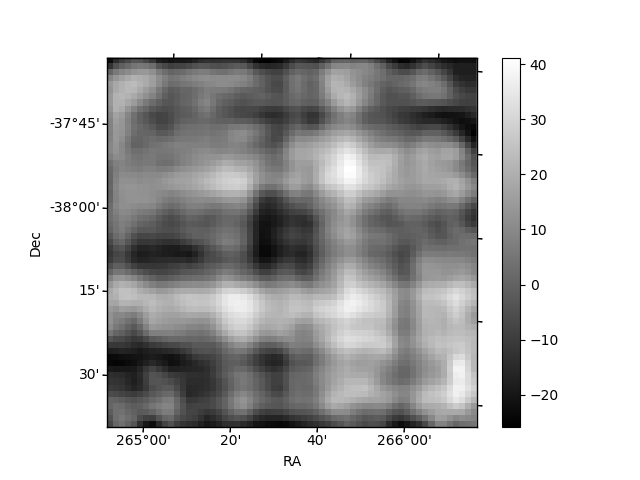
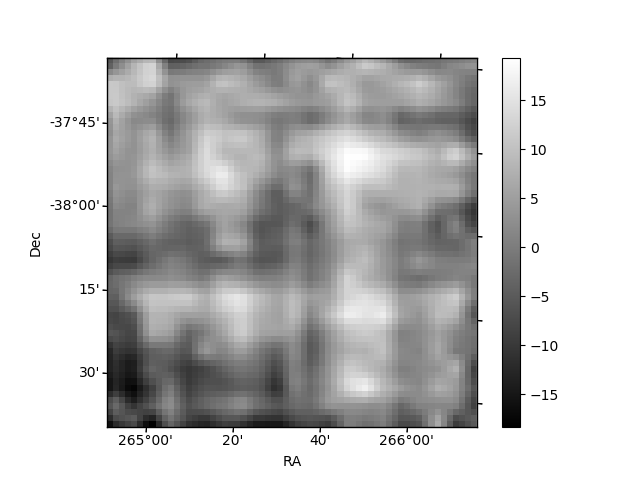
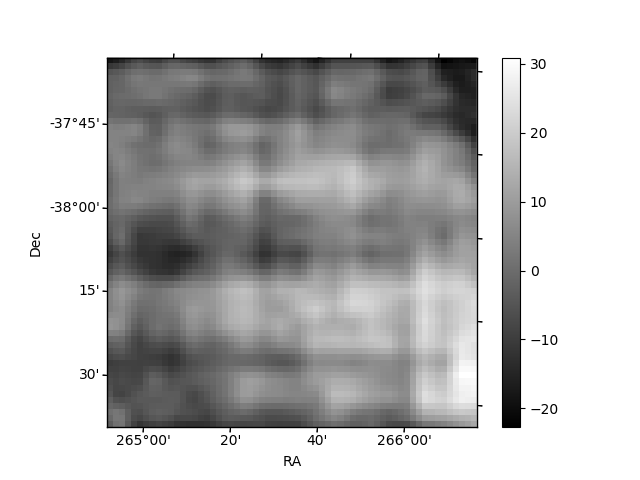
Histogram calculated using DETX and DETY for each event in the final _common_clean file
| Quadrant A | 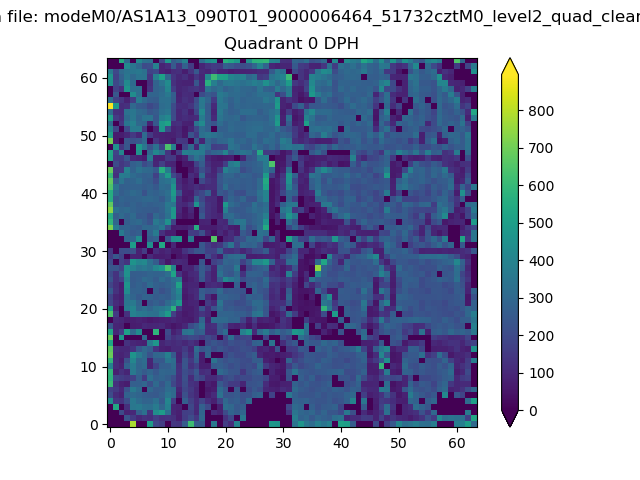 |
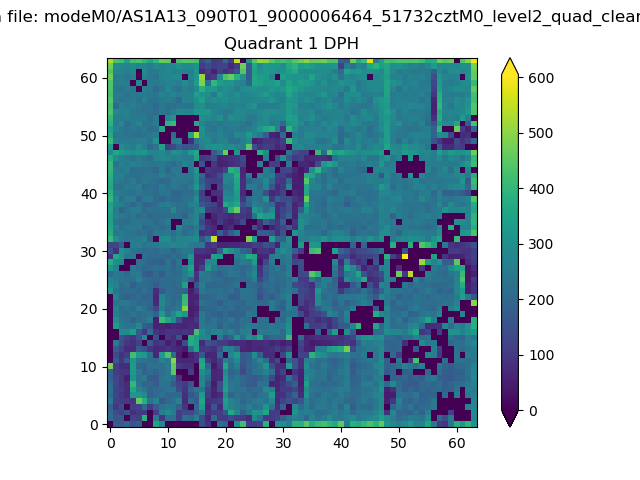 |
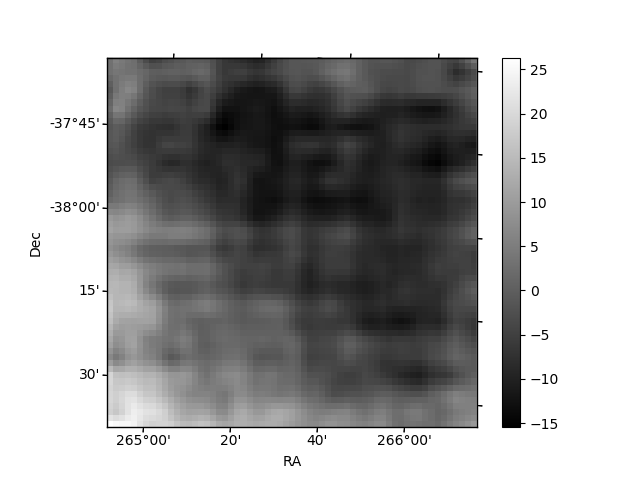
Quadrant B |
|---|---|---|---|
| Quadrant D | 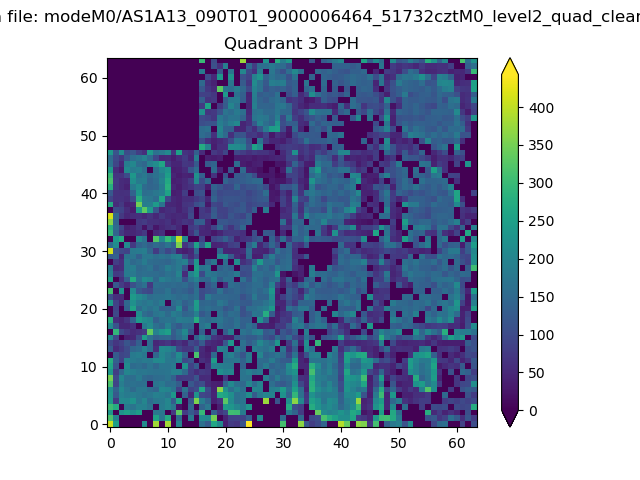 |
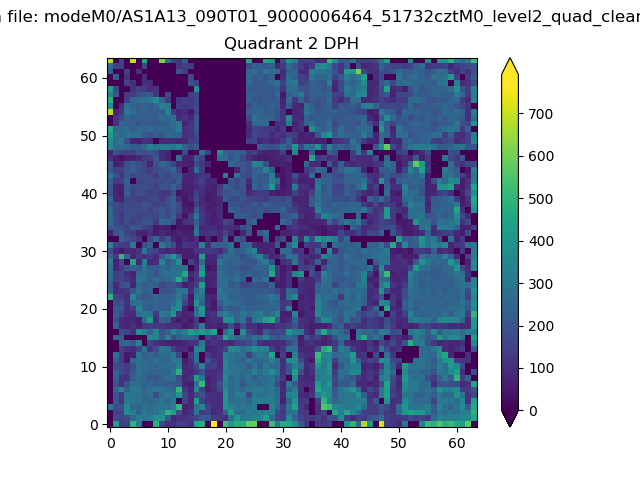 |
Quadrant C |
| Plot type | Count rate plots | Images |
|---|---|---|
| Comparison with Poisson distribution Blue bars denote a histogram of data divided into 1 sec bins. Red curve is a Poisson curve with rate = median count rate of data. |
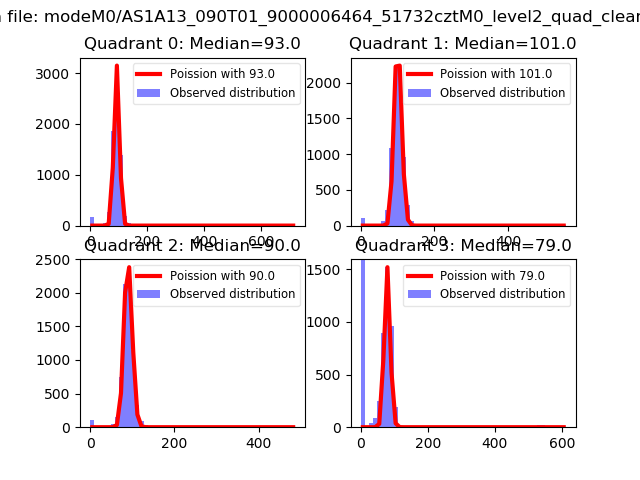 |
 |
| Quadrant-wise count rates Data is divided into 100 sec bins |
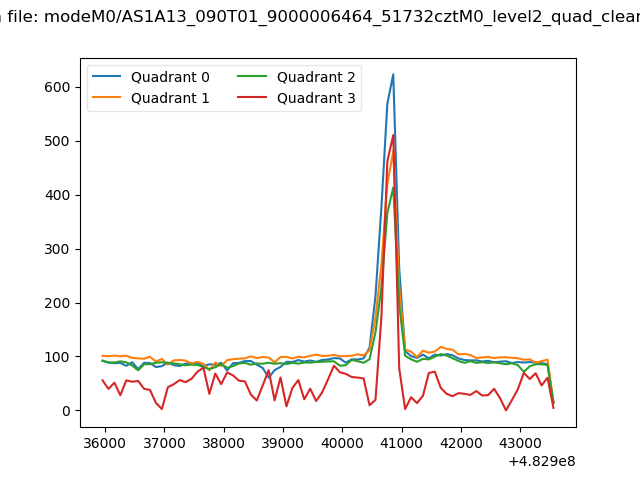 |
|
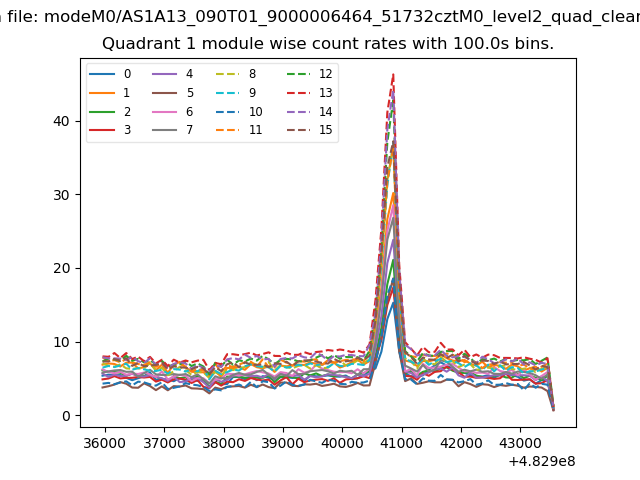
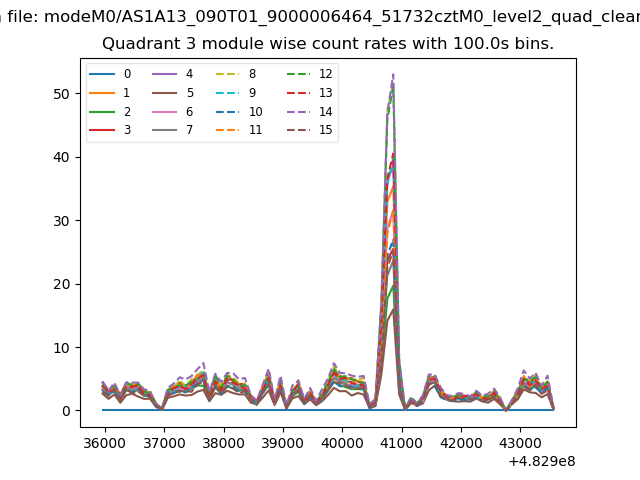
| Module-wise count rates for Quadrant A Data is divided into 100 sec bins |
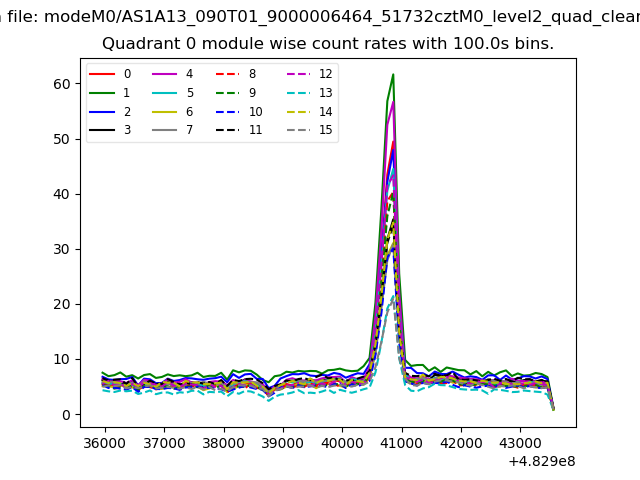 |
 |
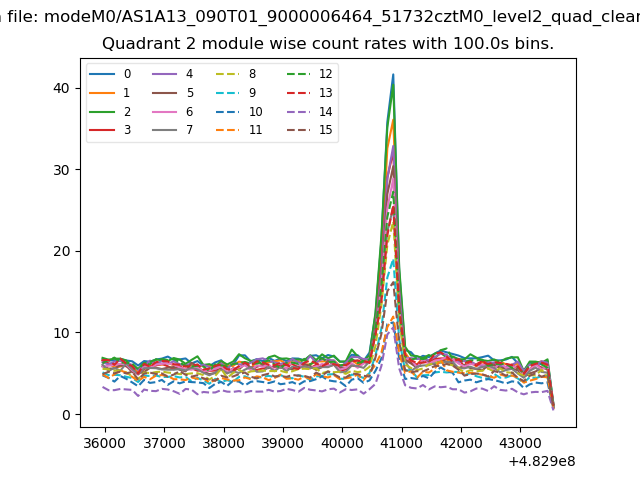
| Module-wise count rates for Quadrant B Data is divided into 100 sec bins |
 |
 |
| Module-wise count rates for Quadrant C Data is divided into 100 sec bins |
 |
 |
| Module-wise count rates for Quadrant D Data is divided into 100 sec bins |
 |
 |
| Parameter | Plot |
|---|---|
| CZT HV Monitor | 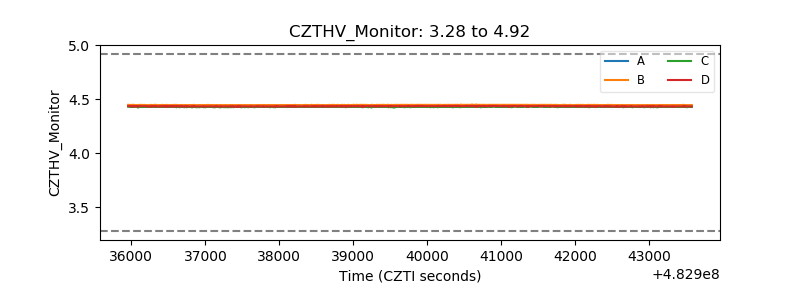 |
| D_VDD | 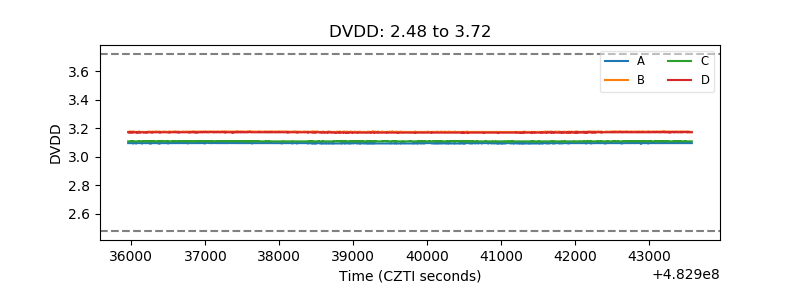 |
| Temperature 1 | 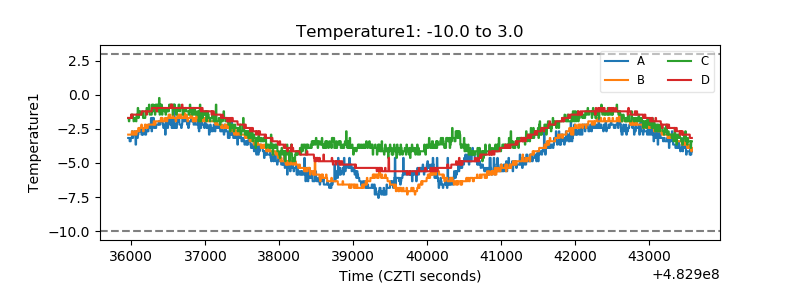 |
| Veto HV Monitor |  |
| Veto LLD | 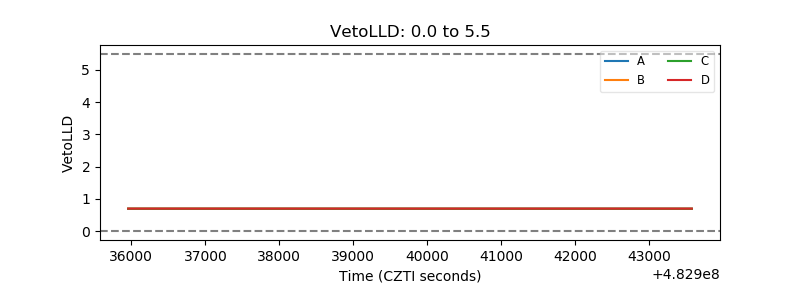 |
| Alpha Counter | 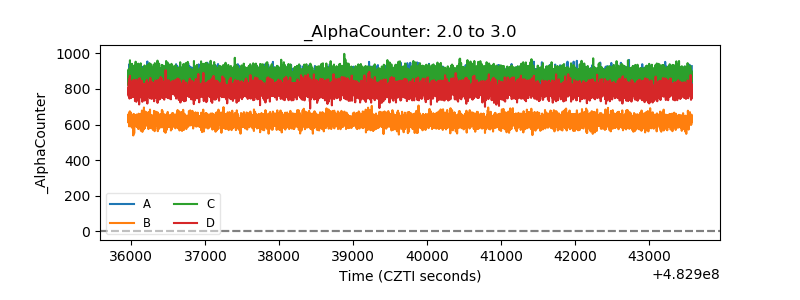 |
| _CPM_Rate | 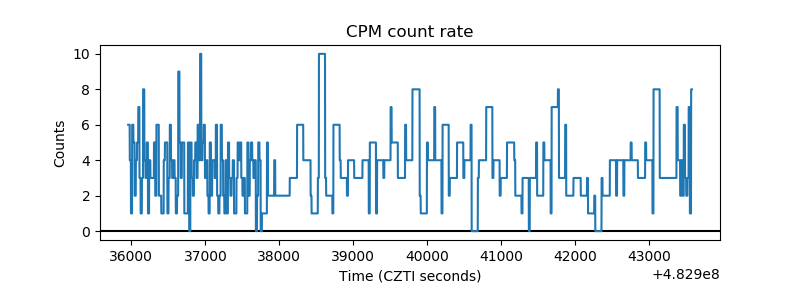 |
| CZT Counter | 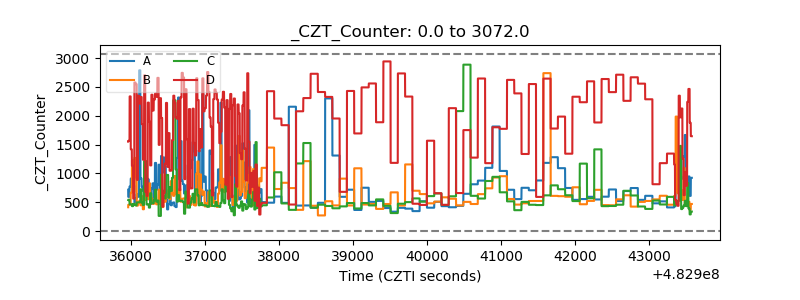 |
| +2.5 Volts monitor | 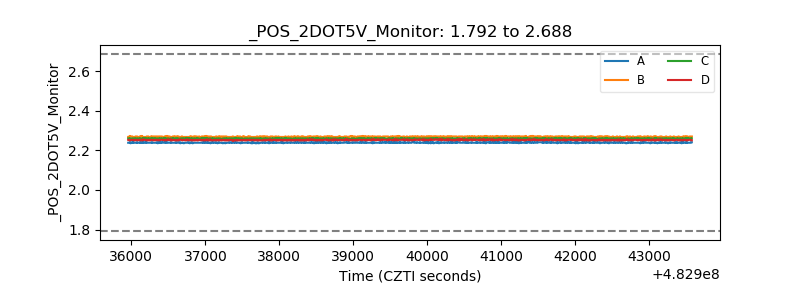 |
| +5 Volts monitor | 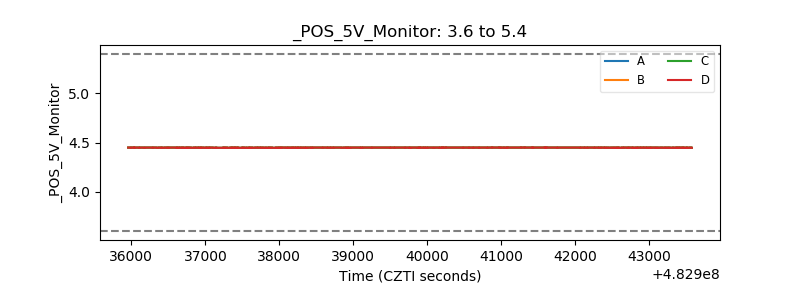 |
| _ROLL_ROT | 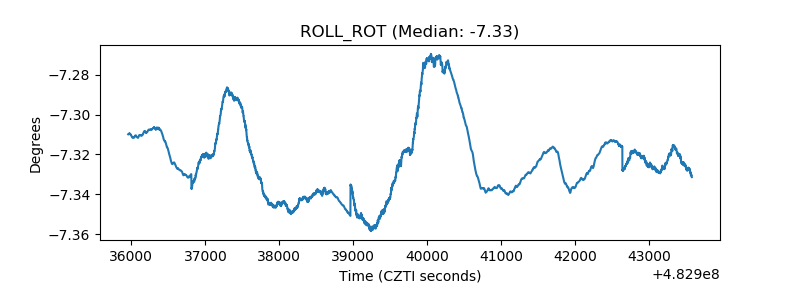 |
| _Roll_DEC | 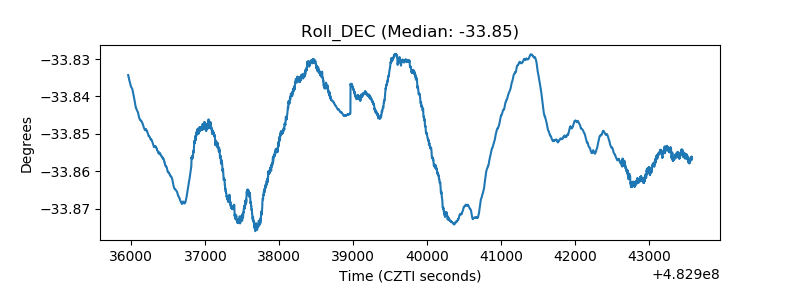 |
| _Roll_RA | 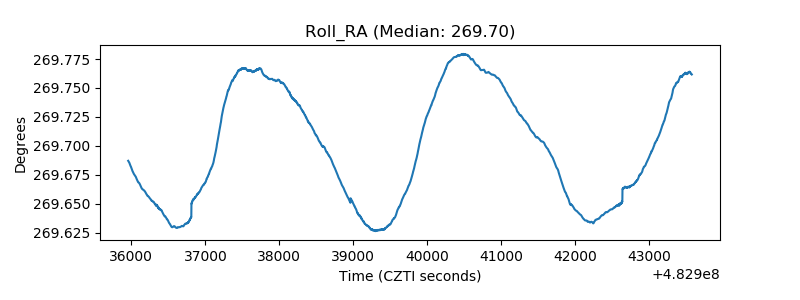 |
| Veto Counter | 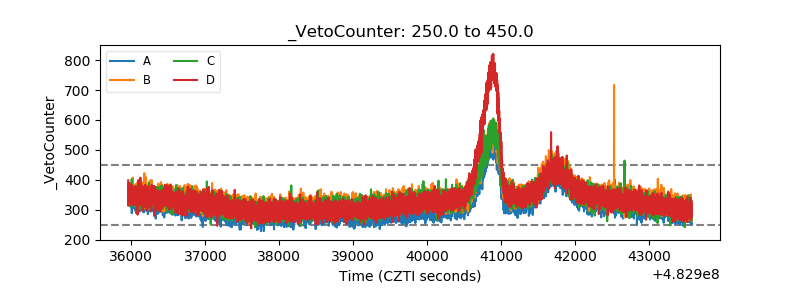 |