| Param | Original file | Final file |
|---|---|---|
| Filename | modeM0/AS1A13_090T01_9000006464_51733cztM0_level2.fits | modeM0/AS1A13_090T01_9000006464_51733cztM0_level2_quad_clean.evt |
| Size (bytes) | 928,111,680 | 106,937,280 |
| Size | 885.1 MB | 102.0 MB |
| Events in quadrant A | 5,900,270 | 773,552 |
| Events in quadrant B | 6,856,850 | 799,643 |
| Events in quadrant C | 5,577,343 | 738,634 |
| Events in quadrant D | 15,372,938 | 344,004 |
| Mode SS | |||
|---|---|---|---|
| Quadrant | BADHDUFLAG | Total packets | Discarded packets |
| A | 0 | 166 | 0 |
| B | 0 | 166 | 0 |
| C | 0 | 166 | 0 |
| D | 0 | 166 | 0 |
| Mode M0 | |||
|---|---|---|---|
| Quadrant | BADHDUFLAG | Total packets | Discarded packets |
| A | 0 | 23407 | 0 |
| B | 0 | 26123 | 2 |
| C | 0 | 22414 | 0 |
| D | 0 | 51436 | 0 |
| Quadrant | Total seconds | Saturated seconds | Saturation percentage |
|---|---|---|---|
| A | 8379 | 184 | 2.195966% |
| B | 8379 | 727 | 8.676453% |
| C | 8379 | 279 | 3.329753% |
| D | 8379 | 4734 | 56.498389% |
Noise dominated data is calculated using 1-second bins in cleaned event files. If a bin has >2000 counts, and if more than 50% of those come from <1% of pixels, then it is considered to be noise-dominated and hence unusable.
| Quadrant | # 1 sec bins | Bins with >0 counts | Bins with >2000 counts | High rate bins dominated by noise | Noise dominated (total time) | Noise dominated (detector-on time) | Marked lightcurve |
|---|---|---|---|---|---|---|---|
| A | 8379 | 8379 | 126 | 126 | 1.50% | 1.50% | 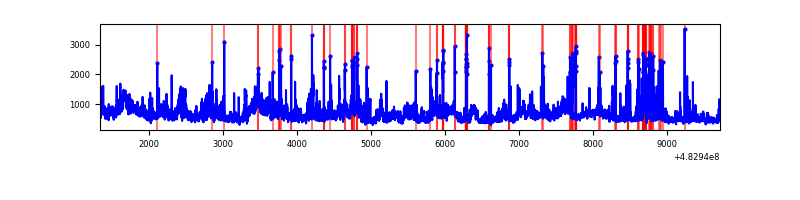 |
| B | 8379 | 8379 | 535 | 535 | 6.39% | 6.39% | 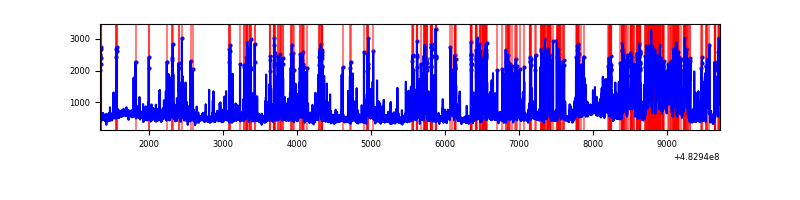 |
| C | 8379 | 8379 | 242 | 242 | 2.89% | 2.89% | 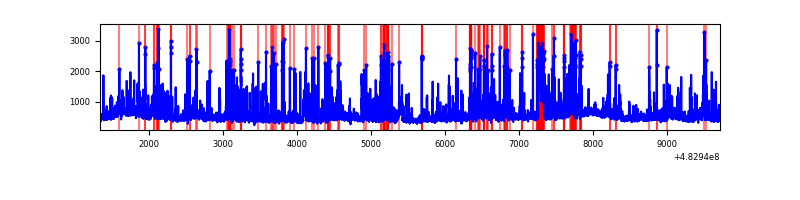 |
| D | 8378 | 8378 | 4460 | 4460 | 53.23% | 53.23% | 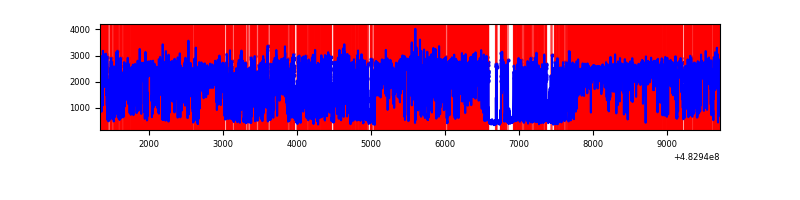 |
Top three noisy pixels from each quadrant. If the there are fewer than three noisy pixels in the level2.evt file, extra rows are filled as -1
| Pixel properties | Quadrant properties | ||||||
|---|---|---|---|---|---|---|---|
| Quadrant | DetID | PixID | Counts | Sigma | Mean | Median | Sigma |
| A | 12 | 3 | 1006913 | 4443.26 | 920 | 896 | 226.4 |
| A | 11 | 3 | 245413 | 1079.95 | 920 | 896 | 226.4 |
| A | 3 | 114 | 226957 | 998.44 | 920 | 896 | 226.4 |
| B | 4 | 206 | 1702410 | 8905.44 | 888 | 857 | 191.1 |
| B | 8 | 128 | 265730 | 1386.27 | 888 | 857 | 191.1 |
| B | 1 | 207 | 220145 | 1147.69 | 888 | 857 | 191.1 |
| C | 13 | 3 | 482302 | 1973.11 | 888 | 881 | 244.0 |
| C | 15 | 148 | 432753 | 1770.04 | 888 | 881 | 244.0 |
| C | 15 | 178 | 220325 | 899.4 | 888 | 881 | 244.0 |
| D | 11 | 129 | 10913258 | 63545.69 | 611 | 589 | 171.7 |
| D | 7 | 60 | 570079 | 3316.2 | 611 | 589 | 171.7 |
| D | 15 | 123 | 359146 | 2087.92 | 611 | 589 | 171.7 |
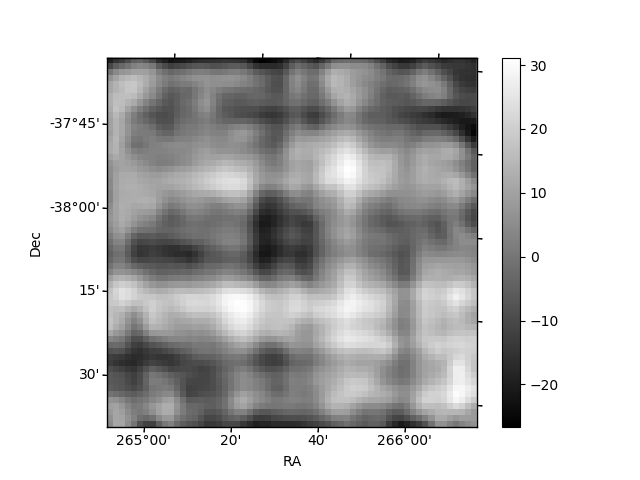
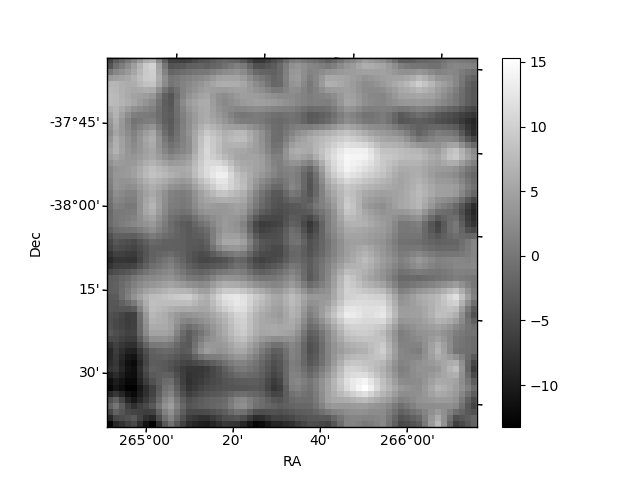
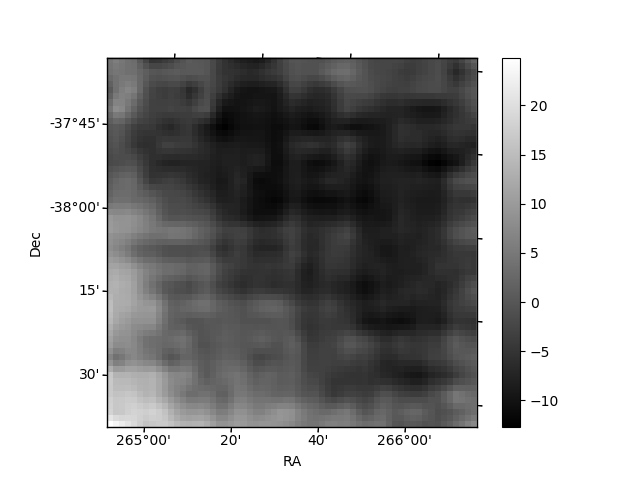
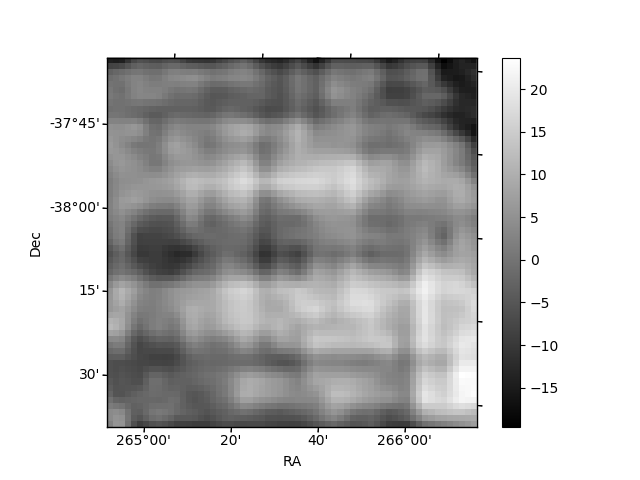
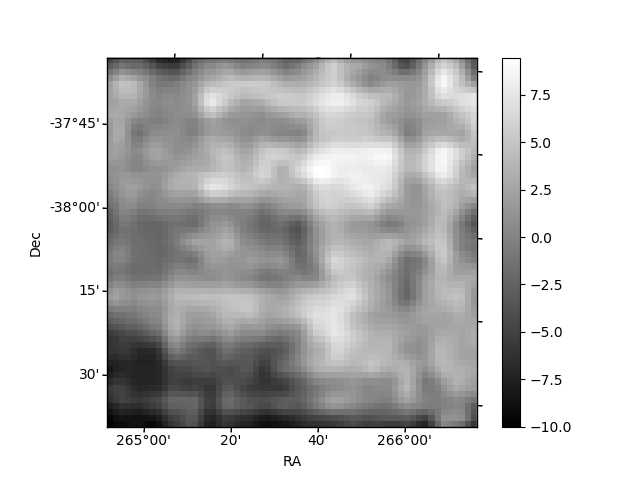
Histogram calculated using DETX and DETY for each event in the final _common_clean file
| Quadrant A | 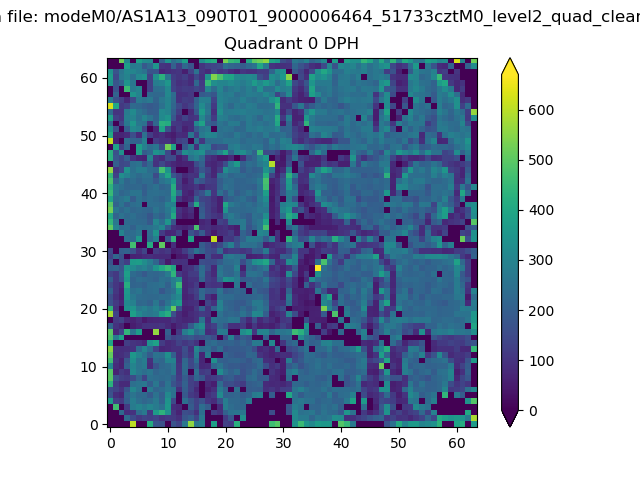 |
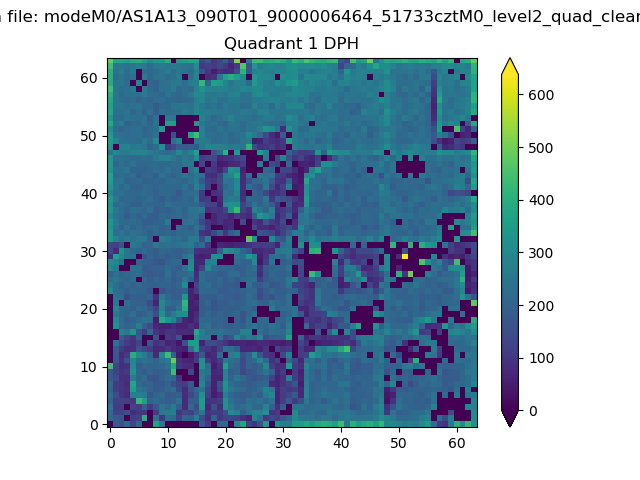 |
Quadrant B |
|---|---|---|---|
| Quadrant D | 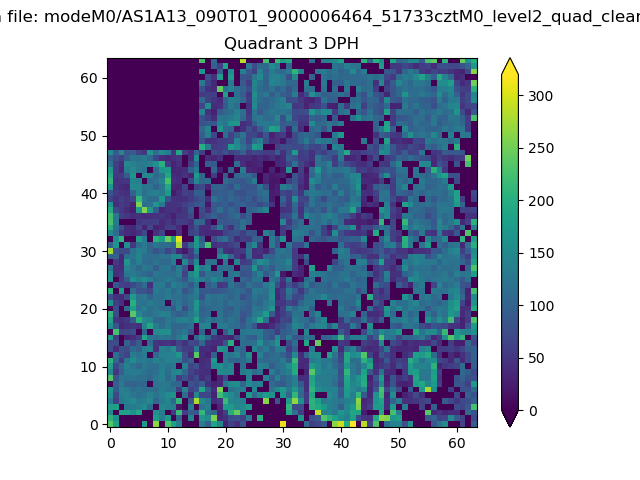 |
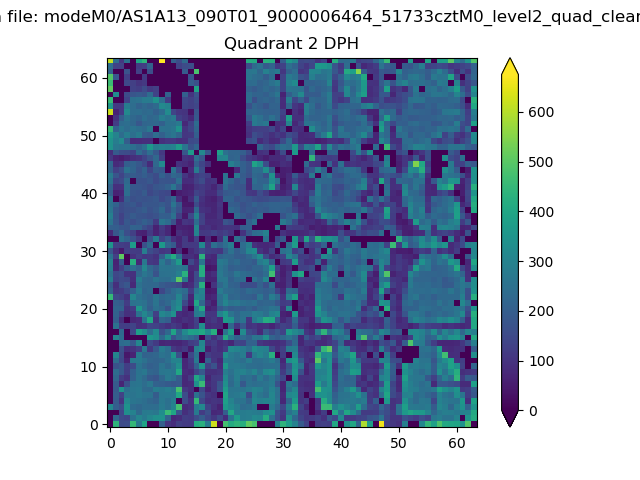 |
Quadrant C |
| Plot type | Count rate plots | Images |
|---|---|---|
| Comparison with Poisson distribution Blue bars denote a histogram of data divided into 1 sec bins. Red curve is a Poisson curve with rate = median count rate of data. |
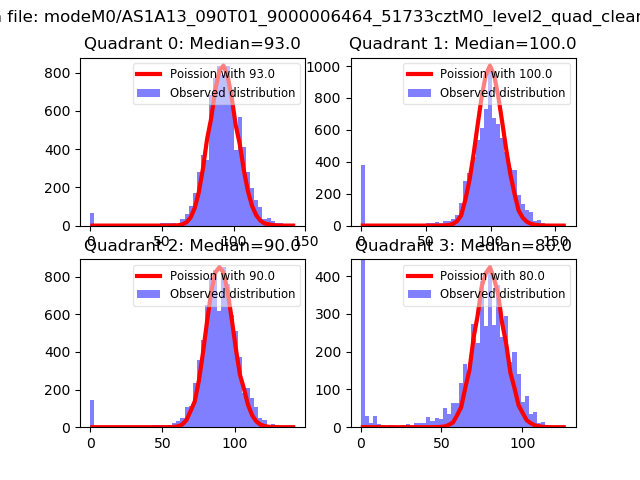 |
 |
| Quadrant-wise count rates Data is divided into 100 sec bins |
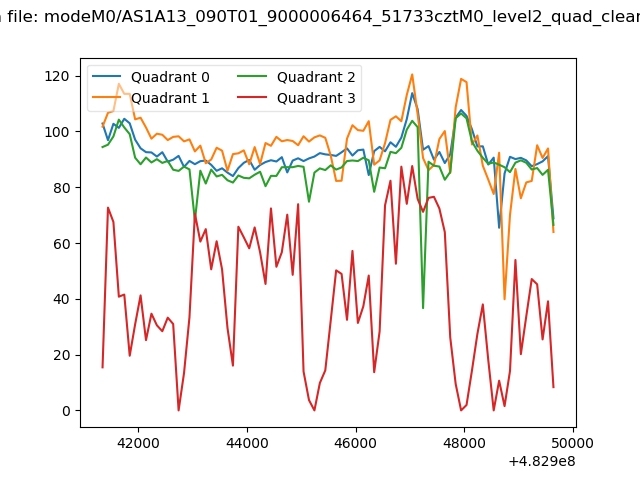 |
|
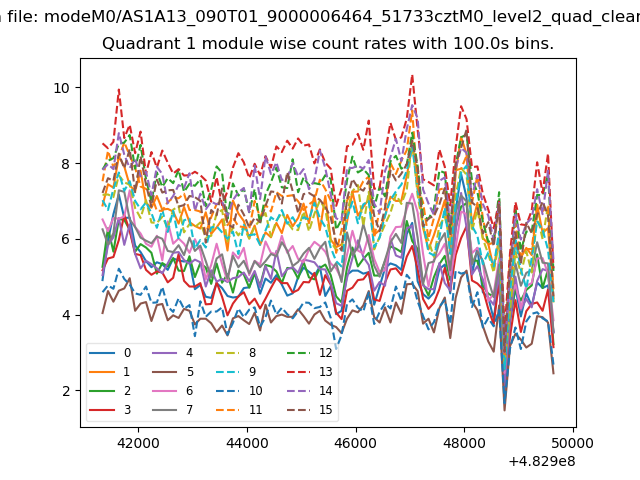
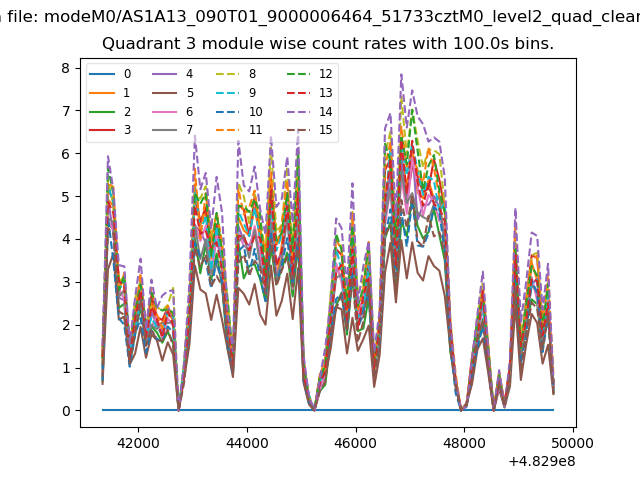
| Module-wise count rates for Quadrant A Data is divided into 100 sec bins |
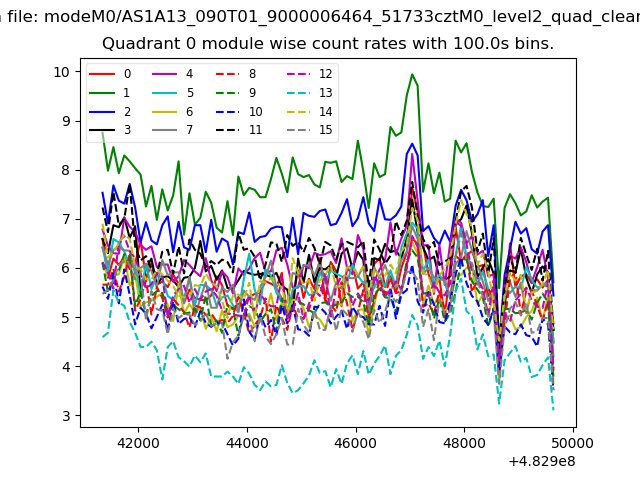 |
 |
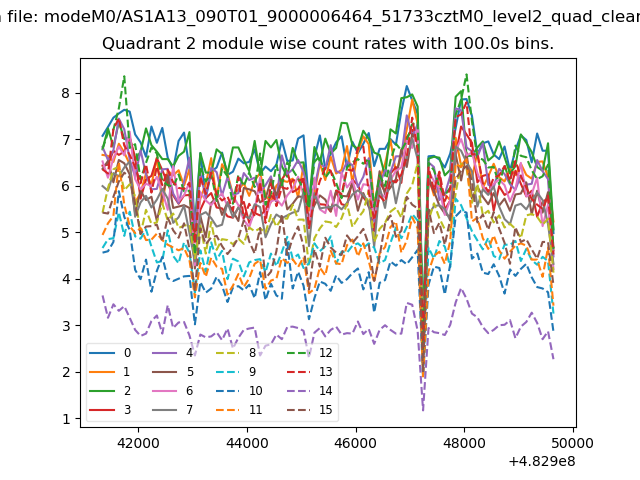
| Module-wise count rates for Quadrant B Data is divided into 100 sec bins |
 |
 |
| Module-wise count rates for Quadrant C Data is divided into 100 sec bins |
 |
 |
| Module-wise count rates for Quadrant D Data is divided into 100 sec bins |
 |
 |
| Parameter | Plot |
|---|---|
| CZT HV Monitor | 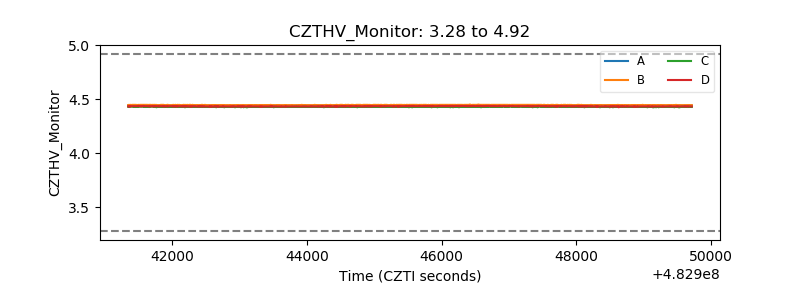 |
| D_VDD | 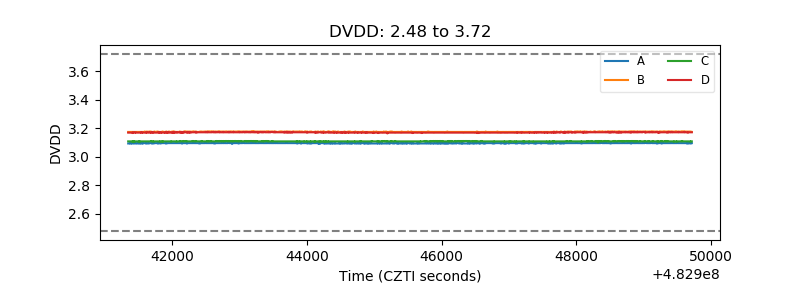 |
| Temperature 1 | 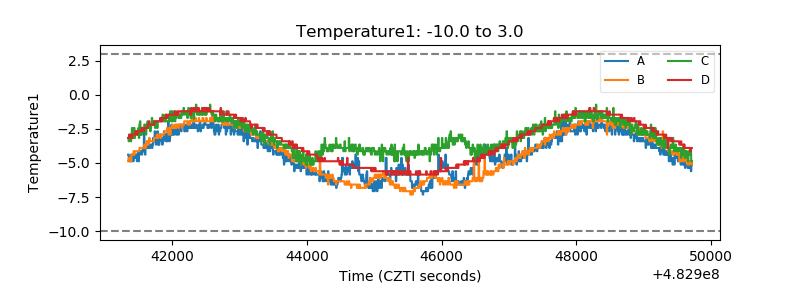 |
| Veto HV Monitor | 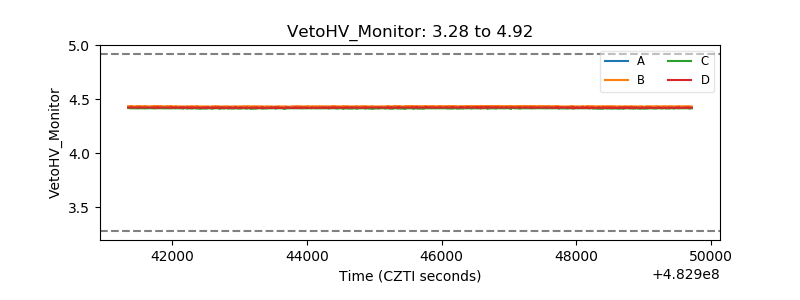 |
| Veto LLD | 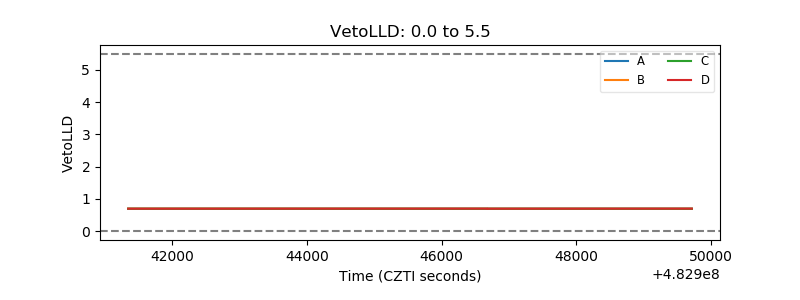 |
| Alpha Counter | 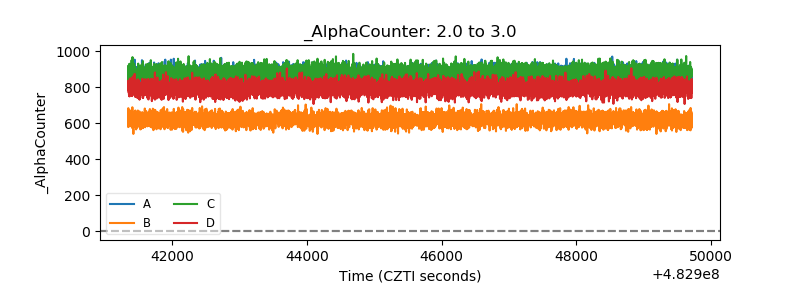 |
| _CPM_Rate | 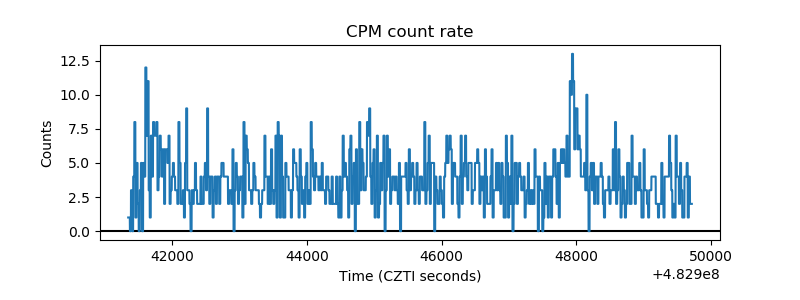 |
| CZT Counter | 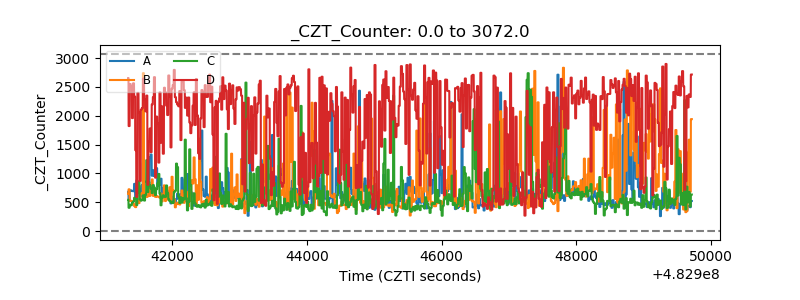 |
| +2.5 Volts monitor | 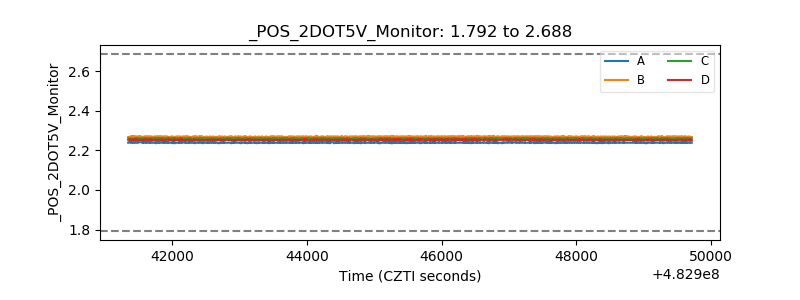 |
| +5 Volts monitor | 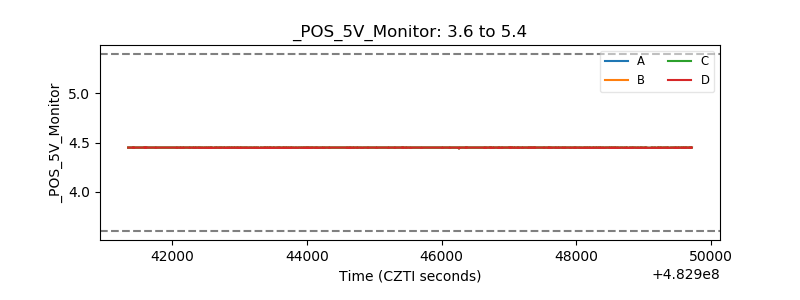 |
| _ROLL_ROT | 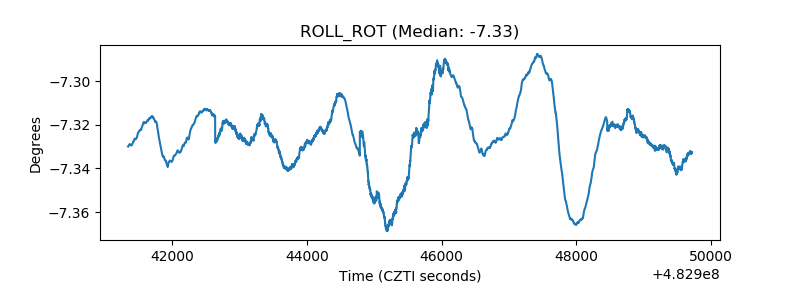 |
| _Roll_DEC | 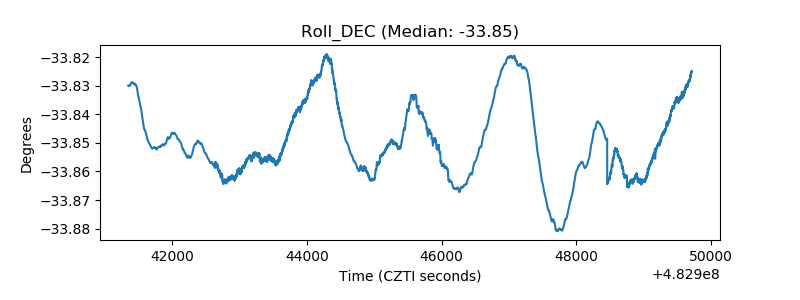 |
| _Roll_RA | 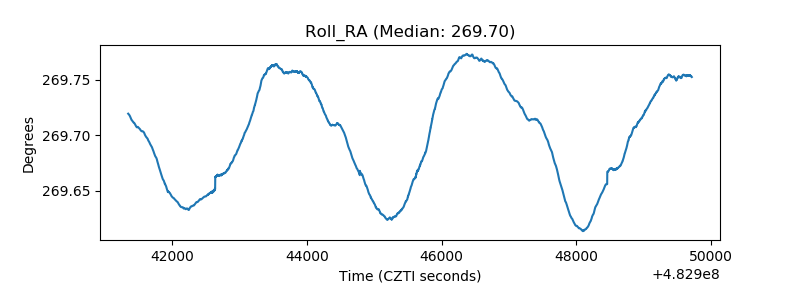 |
| Veto Counter | 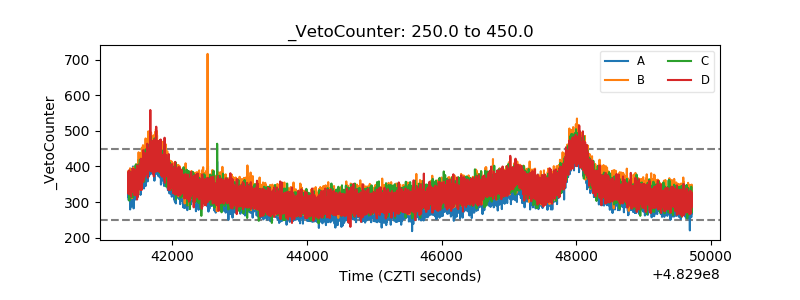 |