| Param | Original file | Final file |
|---|---|---|
| Filename | modeM0/AS1A13_090T01_9000006464_51736cztM0_level2.fits | modeM0/AS1A13_090T01_9000006464_51736cztM0_level2_quad_clean.evt |
| Size (bytes) | 1,872,869,760 | 229,979,520 |
| Size | 1.7 GB | 219.3 MB |
| Events in quadrant A | 11,094,019 | 1,667,626 |
| Events in quadrant B | 12,778,260 | 1,721,382 |
| Events in quadrant C | 14,307,779 | 1,462,660 |
| Events in quadrant D | 29,755,414 | 869,023 |
| Mode M9 | |||
|---|---|---|---|
| Quadrant | BADHDUFLAG | Total packets | Discarded packets |
| A | 0 | 13 | 0 |
| B | 0 | 13 | 0 |
| C | 0 | 13 | 0 |
| D | 0 | 13 | 0 |
| Mode SS | |||
|---|---|---|---|
| Quadrant | BADHDUFLAG | Total packets | Discarded packets |
| A | 0 | 364 | 0 |
| B | 0 | 364 | 0 |
| C | 0 | 364 | 0 |
| D | 0 | 364 | 0 |
| Mode M0 | |||
|---|---|---|---|
| Quadrant | BADHDUFLAG | Total packets | Discarded packets |
| A | 0 | 45393 | 3 |
| B | 0 | 50482 | 3 |
| C | 0 | 55142 | 3 |
| D | 0 | 100784 | 3 |
| Quadrant | Total seconds | Saturated seconds | Saturation percentage |
|---|---|---|---|
| A | 18022 | 720 | 3.995117% |
| B | 18023 | 1459 | 8.095212% |
| C | 18023 | 1954 | 10.841702% |
| D | 18023 | 8393 | 46.568274% |
Noise dominated data is calculated using 1-second bins in cleaned event files. If a bin has >2000 counts, and if more than 50% of those come from <1% of pixels, then it is considered to be noise-dominated and hence unusable.
| Quadrant | # 1 sec bins | Bins with >0 counts | Bins with >2000 counts | High rate bins dominated by noise | Noise dominated (total time) | Noise dominated (detector-on time) | Marked lightcurve |
|---|---|---|---|---|---|---|---|
| A | 19222 | 18025 | 473 | 473 | 2.46% | 2.62% | 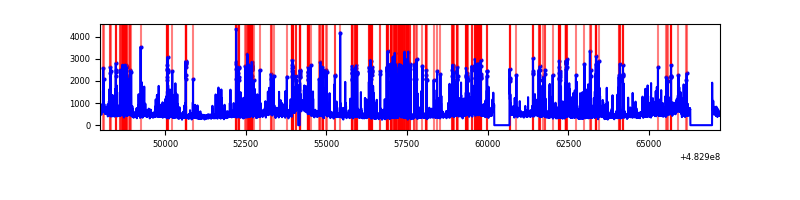 |
| B | 19223 | 18024 | 822 | 822 | 4.28% | 4.56% | 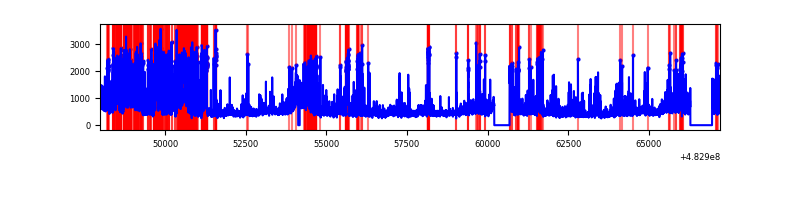 |
| C | 19223 | 18025 | 1763 | 1763 | 9.17% | 9.78% | 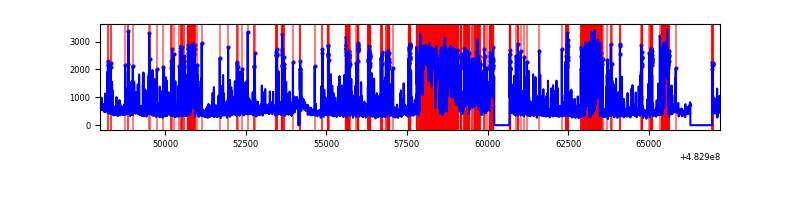 |
| D | 19223 | 18023 | 8050 | 8050 | 41.88% | 44.67% | 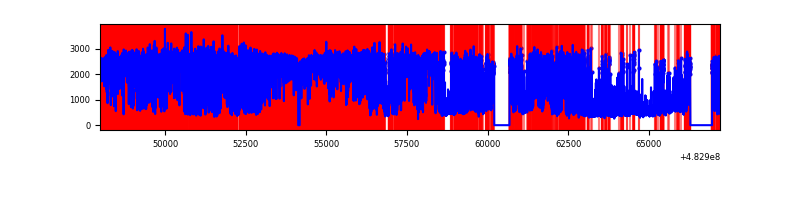 |
Top three noisy pixels from each quadrant. If the there are fewer than three noisy pixels in the level2.evt file, extra rows are filled as -1
| Pixel properties | Quadrant properties | ||||||
|---|---|---|---|---|---|---|---|
| Quadrant | DetID | PixID | Counts | Sigma | Mean | Median | Sigma |
| A | 0 | 111 | 1296946 | 2717.46 | 1940 | 1895 | 476.6 |
| A | 3 | 114 | 330600 | 689.74 | 1940 | 1895 | 476.6 |
| A | 4 | 3 | 274144 | 571.27 | 1940 | 1895 | 476.6 |
| B | 4 | 206 | 2096232 | 5162.01 | 1898 | 1832 | 405.7 |
| B | 4 | 174 | 512148 | 1257.76 | 1898 | 1832 | 405.7 |
| B | 8 | 128 | 375984 | 922.16 | 1898 | 1832 | 405.7 |
| C | 10 | 22 | 2603022 | 5152.56 | 1821 | 1805 | 504.8 |
| C | 13 | 3 | 1092338 | 2160.16 | 1821 | 1805 | 504.8 |
| C | 1 | 243 | 997555 | 1972.41 | 1821 | 1805 | 504.8 |
| D | 11 | 129 | 15934902 | 38972.7 | 1433 | 1382 | 408.8 |
| D | 2 | 249 | 3033875 | 7417.35 | 1433 | 1382 | 408.8 |
| D | 8 | 176 | 2247186 | 5493.14 | 1433 | 1382 | 408.8 |
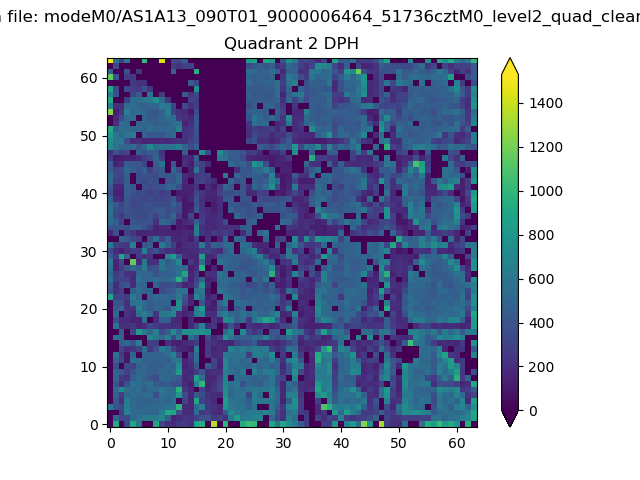
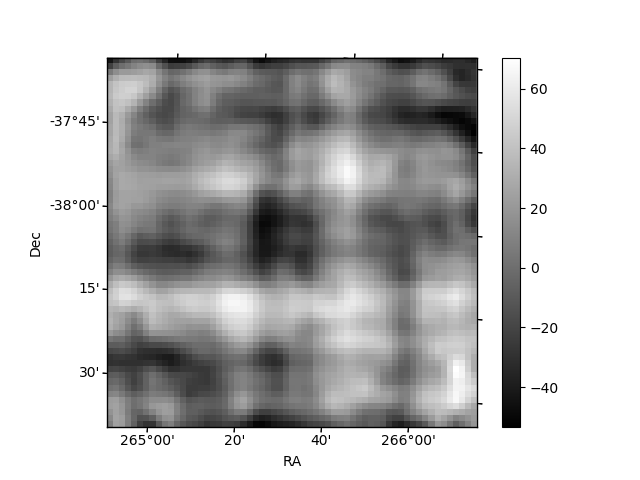
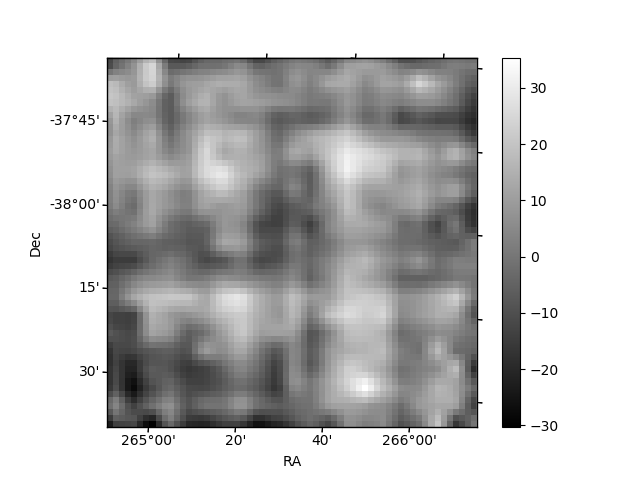
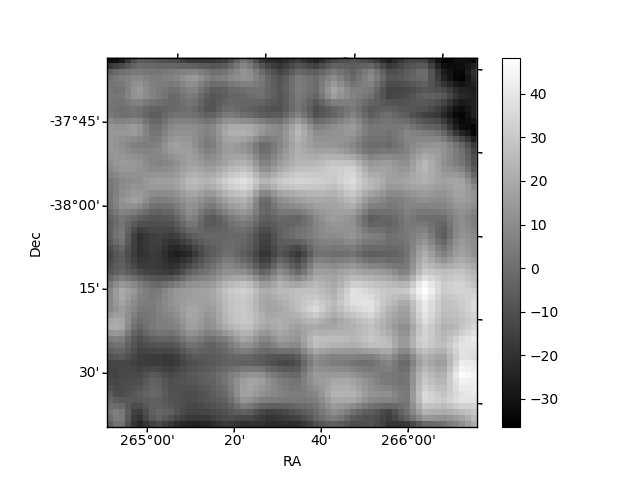
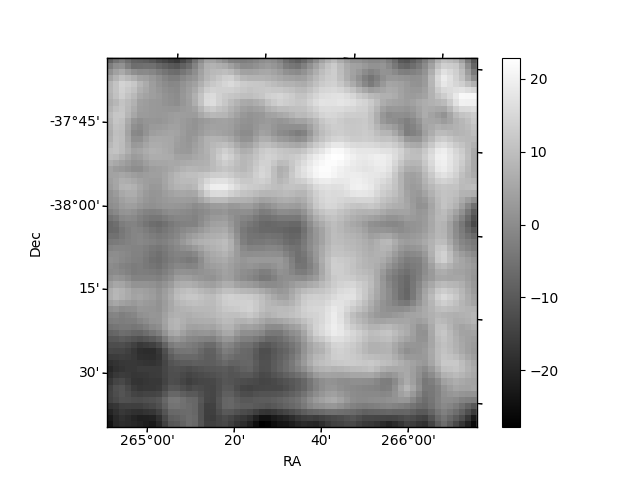
Histogram calculated using DETX and DETY for each event in the final _common_clean file
| Quadrant A | 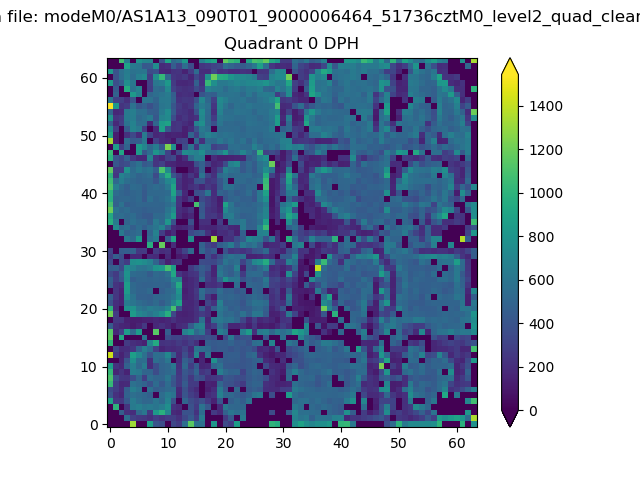 |
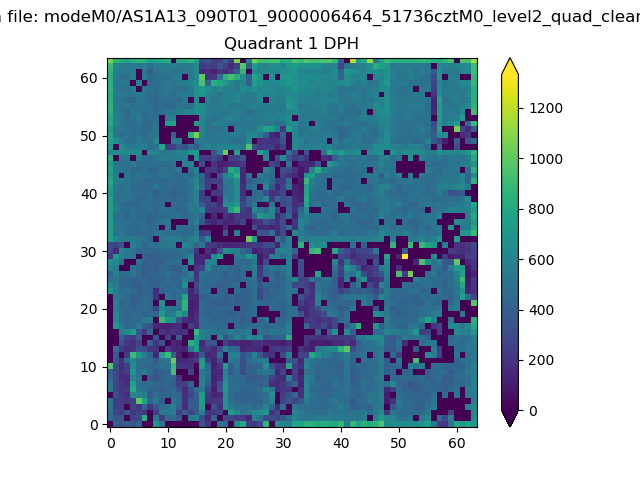 |
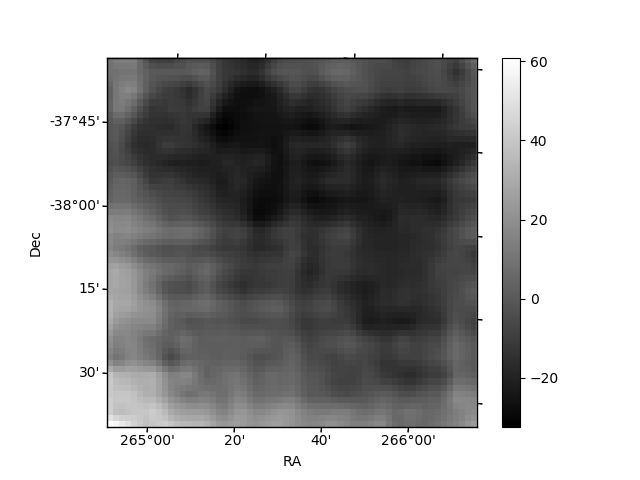
Quadrant B |
|---|---|---|---|
| Quadrant D | 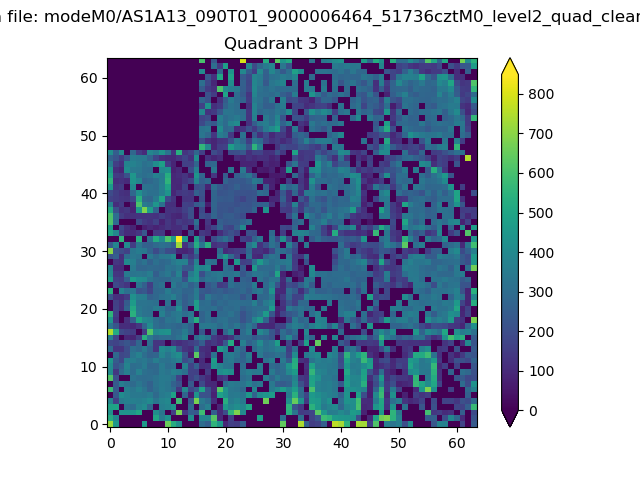 |
 |
Quadrant C |
| Plot type | Count rate plots | Images |
|---|---|---|
| Comparison with Poisson distribution Blue bars denote a histogram of data divided into 1 sec bins. Red curve is a Poisson curve with rate = median count rate of data. |
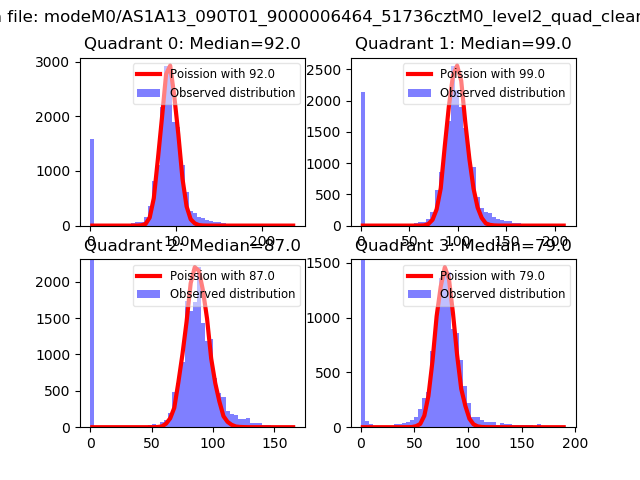 |
 |
| Quadrant-wise count rates Data is divided into 100 sec bins |
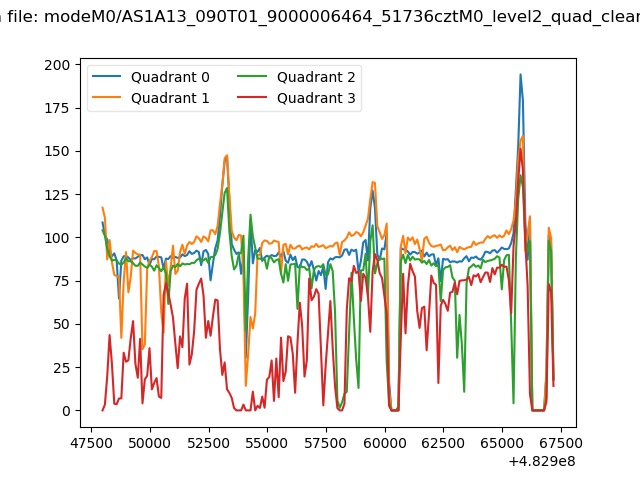 |
|
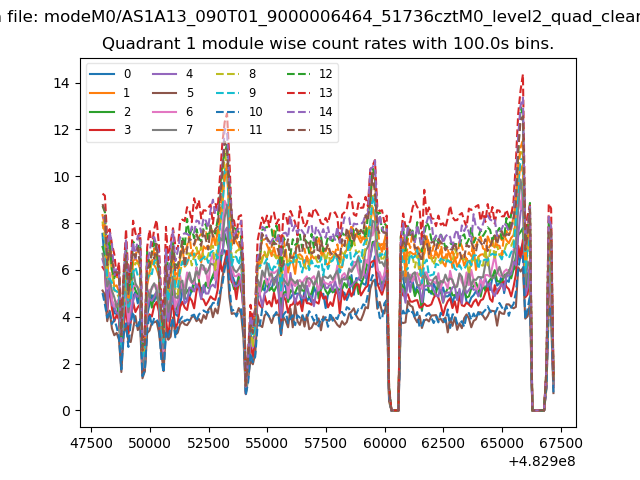
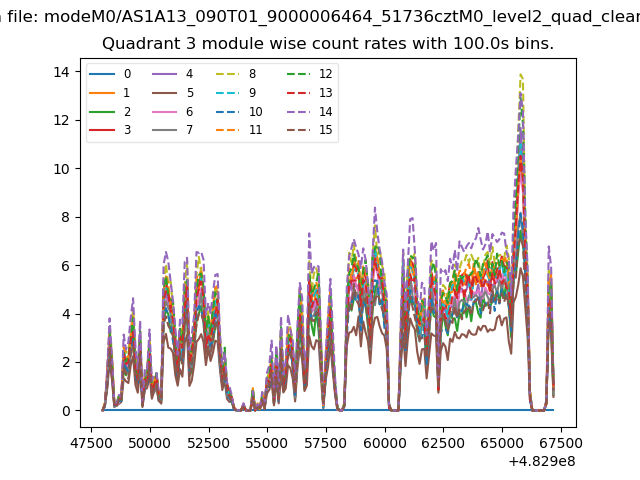
| Module-wise count rates for Quadrant A Data is divided into 100 sec bins |
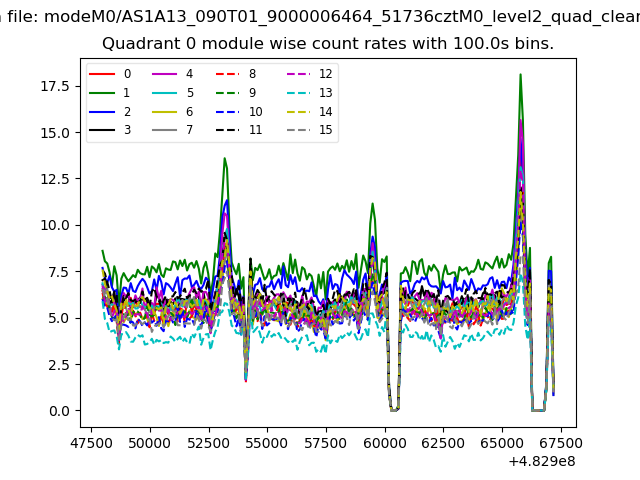 |
 |
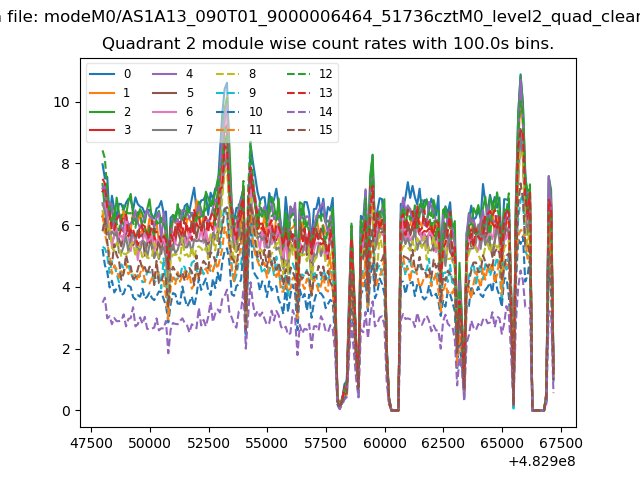
| Module-wise count rates for Quadrant B Data is divided into 100 sec bins |
 |
 |
| Module-wise count rates for Quadrant C Data is divided into 100 sec bins |
 |
 |
| Module-wise count rates for Quadrant D Data is divided into 100 sec bins |
 |
 |
| Parameter | Plot |
|---|---|
| CZT HV Monitor | 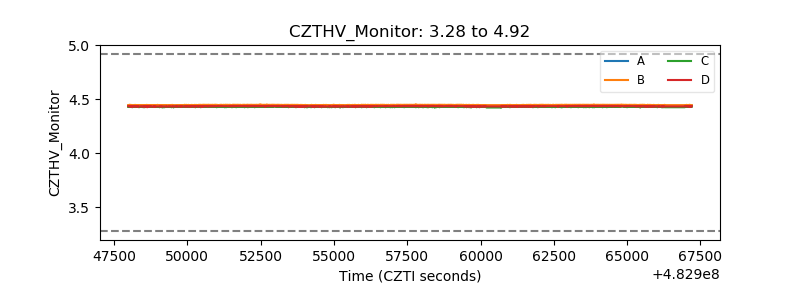 |
| D_VDD | 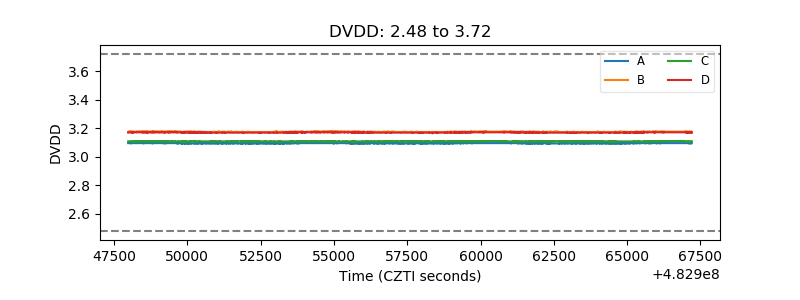 |
| Temperature 1 | 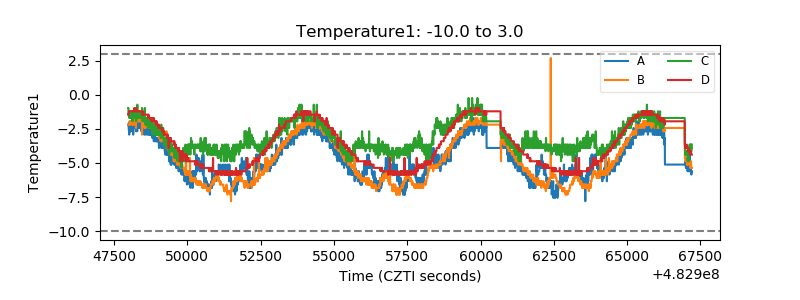 |
| Veto HV Monitor | 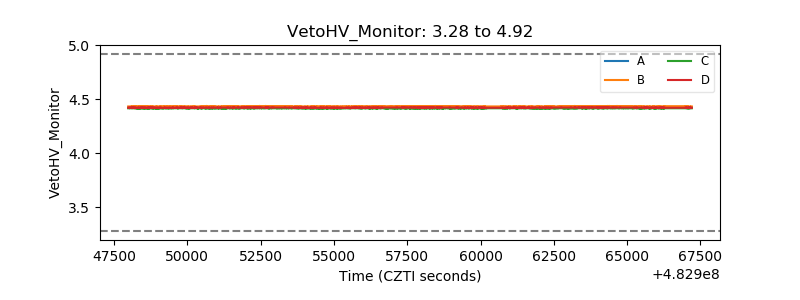 |
| Veto LLD | 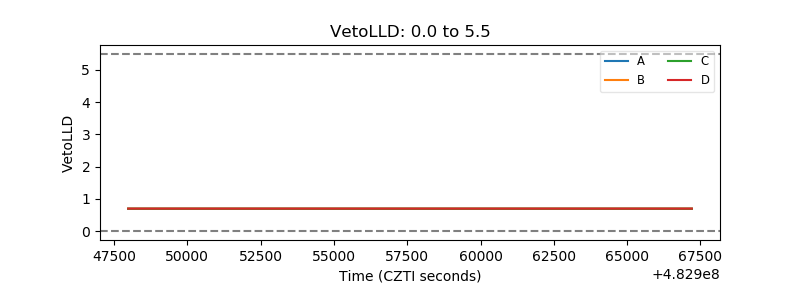 |
| Alpha Counter | 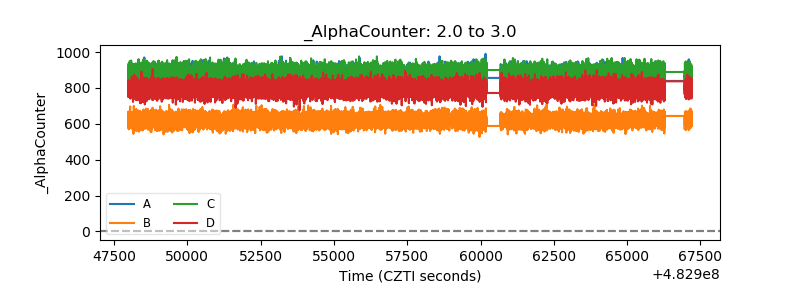 |
| _CPM_Rate | 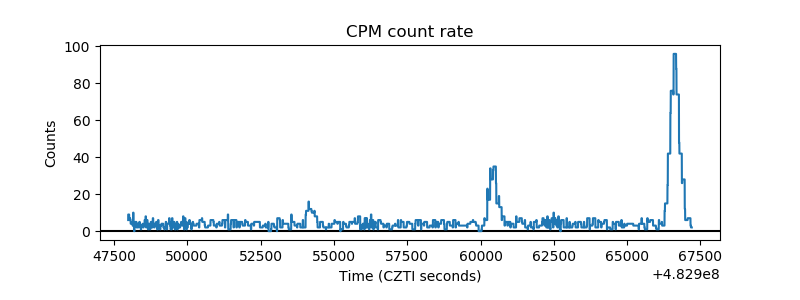 |
| CZT Counter | 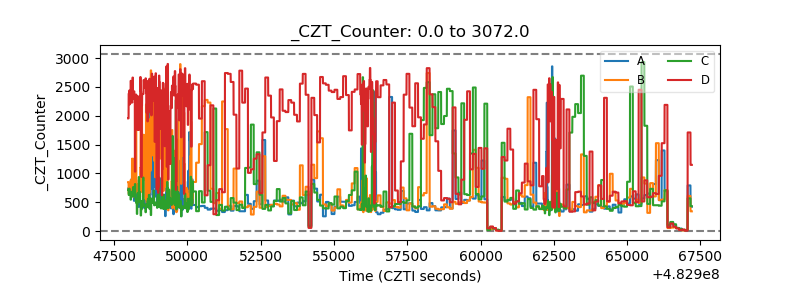 |
| +2.5 Volts monitor | 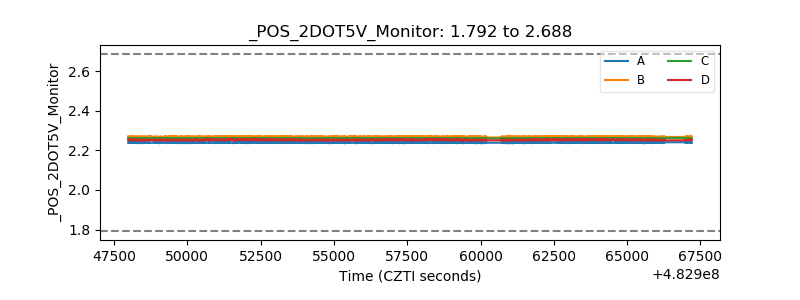 |
| +5 Volts monitor | 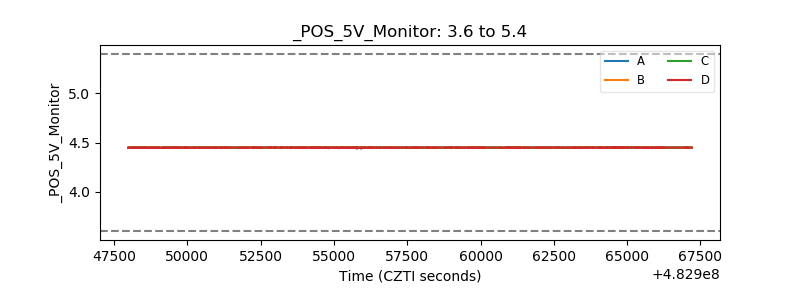 |
| _ROLL_ROT | 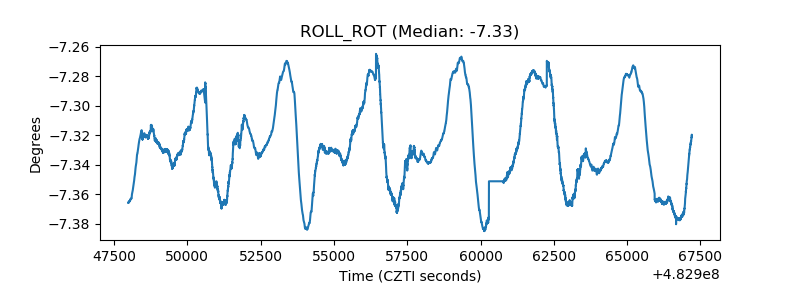 |
| _Roll_DEC | 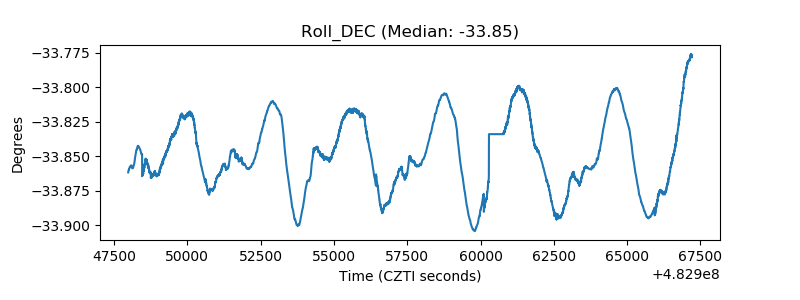 |
| _Roll_RA | 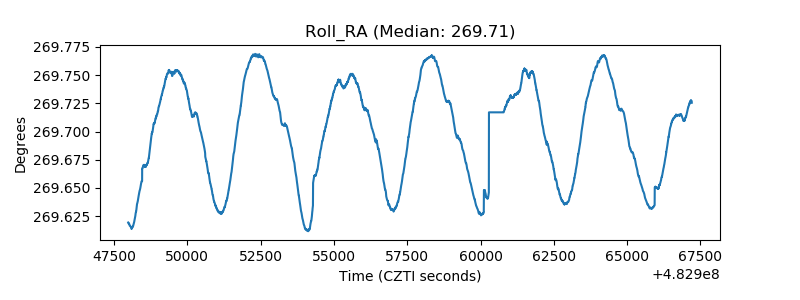 |
| Veto Counter | 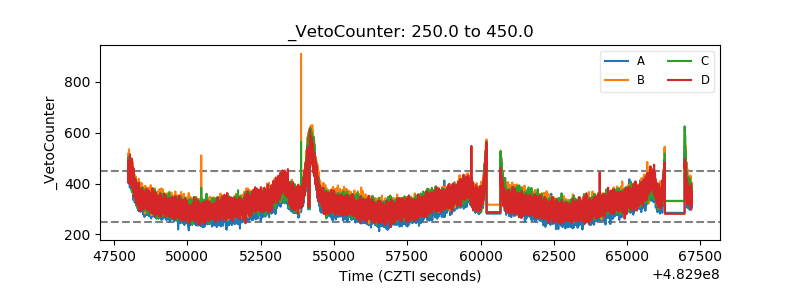 |