| Param | Original file | Final file |
|---|---|---|
| Filename | modeM0/AS1A13_090T01_9000006464_51737cztM0_level2.fits | modeM0/AS1A13_090T01_9000006464_51737cztM0_level2_quad_clean.evt |
| Size (bytes) | 730,635,840 | 96,661,440 |
| Size | 696.8 MB | 92.2 MB |
| Events in quadrant A | 5,679,385 | 638,754 |
| Events in quadrant B | 4,506,398 | 717,666 |
| Events in quadrant C | 5,712,526 | 636,475 |
| Events in quadrant D | 10,593,838 | 435,583 |
| Mode M9 | |||
|---|---|---|---|
| Quadrant | BADHDUFLAG | Total packets | Discarded packets |
| A | 0 | 16 | 0 |
| B | 0 | 16 | 0 |
| C | 0 | 16 | 0 |
| D | 0 | 16 | 0 |
| Mode SS | |||
|---|---|---|---|
| Quadrant | BADHDUFLAG | Total packets | Discarded packets |
| A | 0 | 146 | 0 |
| B | 0 | 146 | 0 |
| C | 0 | 146 | 0 |
| D | 0 | 146 | 0 |
| Mode M0 | |||
|---|---|---|---|
| Quadrant | BADHDUFLAG | Total packets | Discarded packets |
| A | 0 | 21871 | 2 |
| B | 0 | 18358 | 2 |
| C | 0 | 22072 | 5 |
| D | 0 | 36423 | 2 |
| Quadrant | Total seconds | Saturated seconds | Saturation percentage |
|---|---|---|---|
| A | 7153 | 632 | 8.835454% |
| B | 7154 | 324 | 4.528935% |
| C | 7153 | 276 | 3.858521% |
| D | 7153 | 2442 | 34.139522% |
Noise dominated data is calculated using 1-second bins in cleaned event files. If a bin has >2000 counts, and if more than 50% of those come from <1% of pixels, then it is considered to be noise-dominated and hence unusable.
| Quadrant | # 1 sec bins | Bins with >0 counts | Bins with >2000 counts | High rate bins dominated by noise | Noise dominated (total time) | Noise dominated (detector-on time) | Marked lightcurve |
|---|---|---|---|---|---|---|---|
| A | 8678 | 7155 | 511 | 511 | 5.89% | 7.14% | 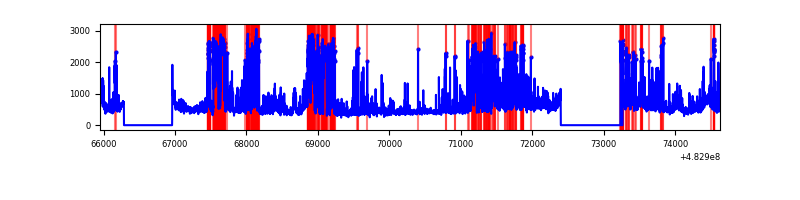 |
| B | 8679 | 7156 | 190 | 190 | 2.19% | 2.66% | 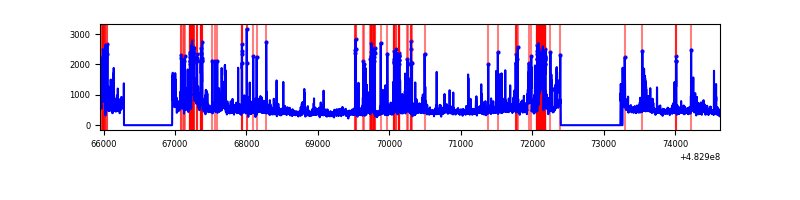 |
| C | 8678 | 7155 | 232 | 232 | 2.67% | 3.24% |  |
| D | 8678 | 7153 | 2343 | 2343 | 27.00% | 32.76% | 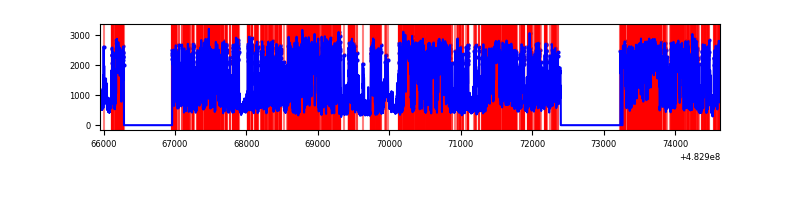 |
Top three noisy pixels from each quadrant. If the there are fewer than three noisy pixels in the level2.evt file, extra rows are filled as -1
| Pixel properties | Quadrant properties | ||||||
|---|---|---|---|---|---|---|---|
| Quadrant | DetID | PixID | Counts | Sigma | Mean | Median | Sigma |
| A | 13 | 248 | 1378124 | 7460.33 | 746 | 730 | 184.6 |
| A | 3 | 14 | 162839 | 878.02 | 746 | 730 | 184.6 |
| A | 8 | 47 | 143148 | 771.37 | 746 | 730 | 184.6 |
| B | 4 | 174 | 290124 | 1748.78 | 763 | 734 | 165.5 |
| B | 8 | 128 | 235007 | 1415.71 | 763 | 734 | 165.5 |
| B | 4 | 206 | 180644 | 1087.19 | 763 | 734 | 165.5 |
| C | 3 | 242 | 1736363 | 8374.24 | 747 | 742 | 207.3 |
| C | 12 | 249 | 229473 | 1103.61 | 747 | 742 | 207.3 |
| C | 13 | 3 | 200151 | 962.13 | 747 | 742 | 207.3 |
| D | 11 | 129 | 6359199 | 36073.06 | 624 | 600 | 176.3 |
| D | 8 | 176 | 1170124 | 6634.84 | 624 | 600 | 176.3 |
| D | 2 | 249 | 87385 | 492.34 | 624 | 600 | 176.3 |
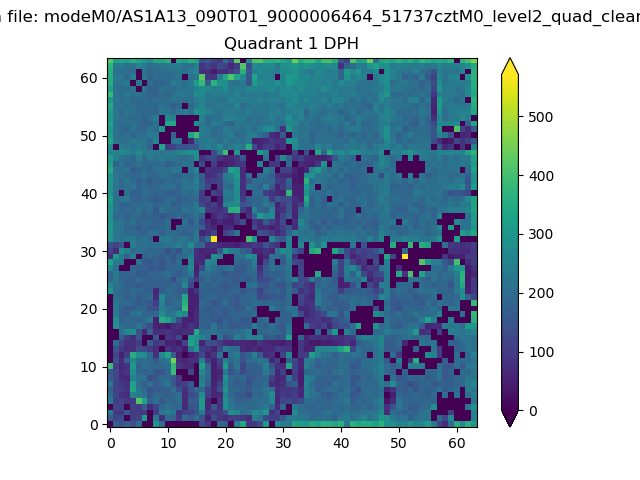
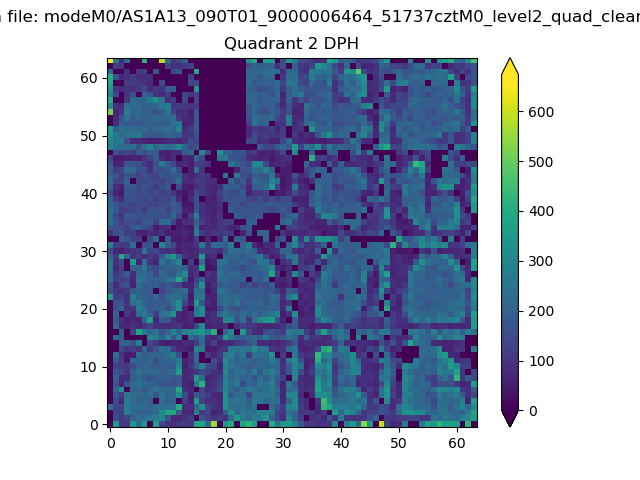
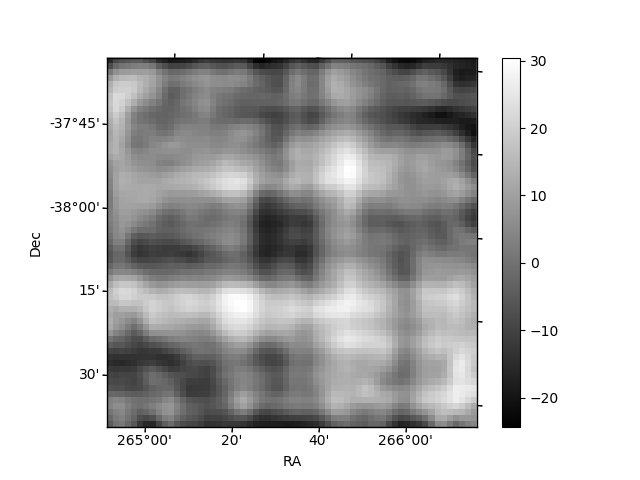
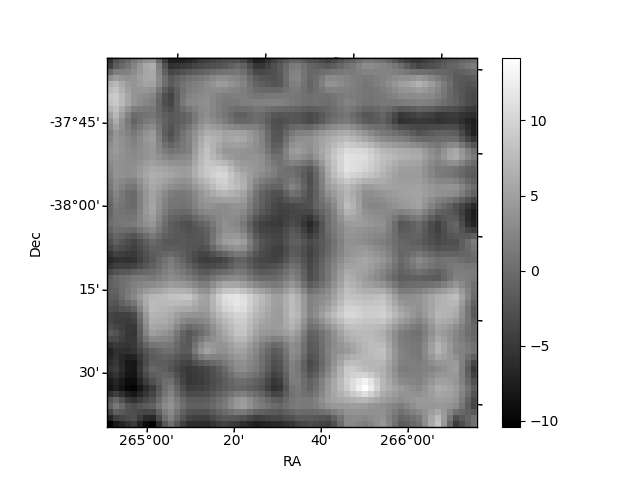
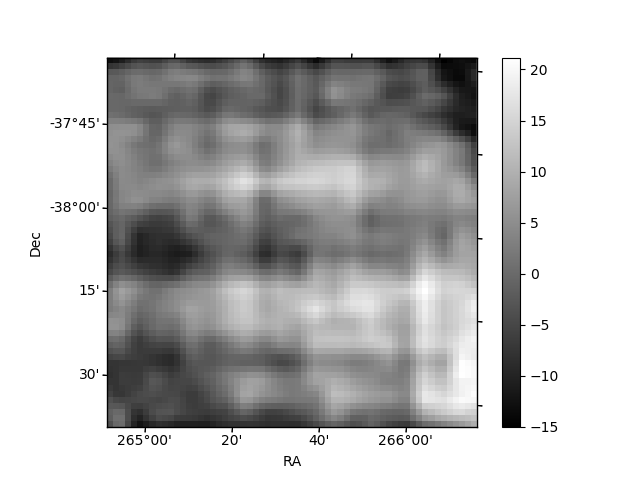
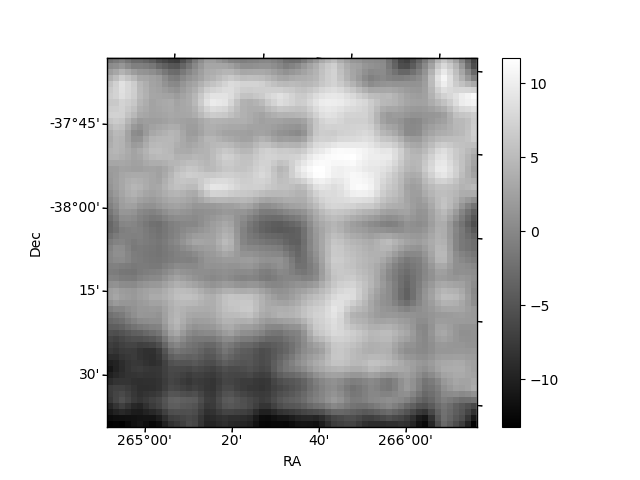
Histogram calculated using DETX and DETY for each event in the final _common_clean file
| Quadrant A | 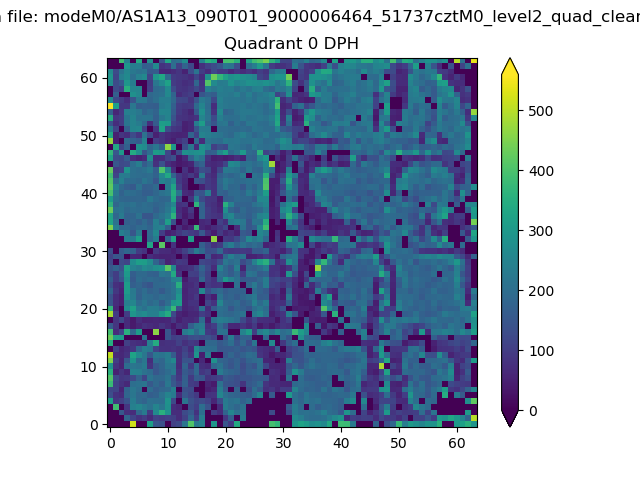 |
 |
Quadrant B |
|---|---|---|---|
| Quadrant D | 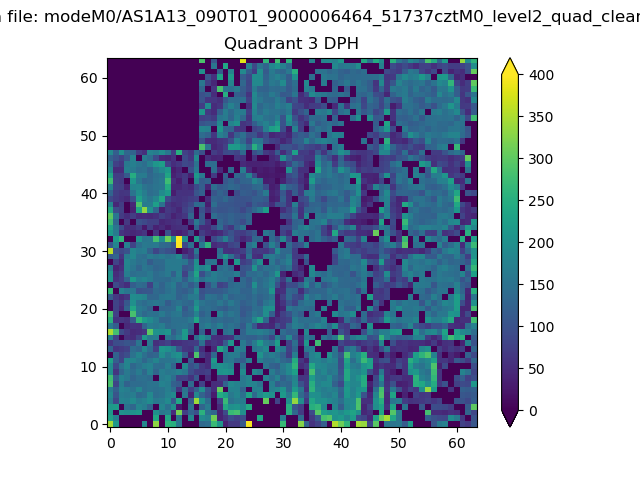 |
 |
Quadrant C |
| Plot type | Count rate plots | Images |
|---|---|---|
| Comparison with Poisson distribution Blue bars denote a histogram of data divided into 1 sec bins. Red curve is a Poisson curve with rate = median count rate of data. |
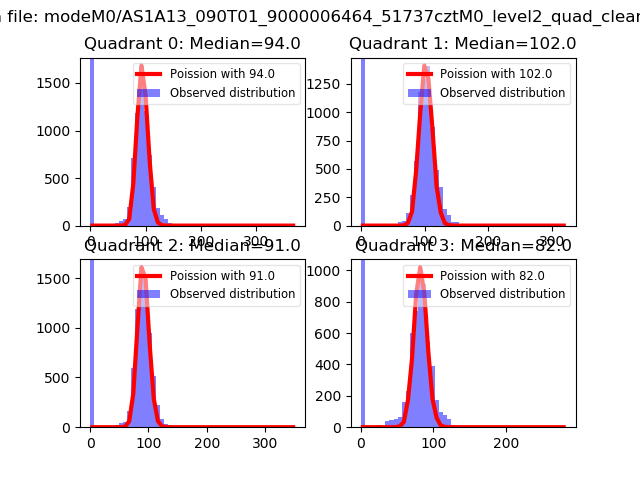 |
 |
| Quadrant-wise count rates Data is divided into 100 sec bins |
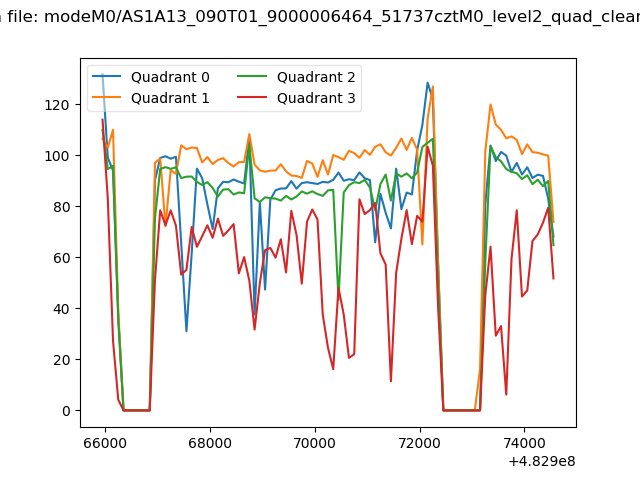 |
|
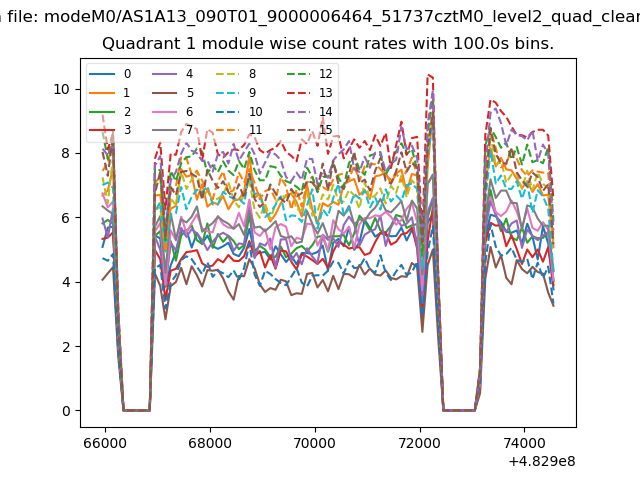
| Module-wise count rates for Quadrant A Data is divided into 100 sec bins |
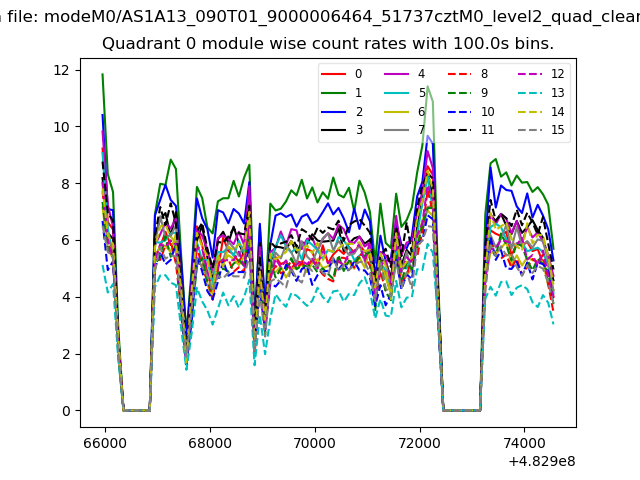 |
 |
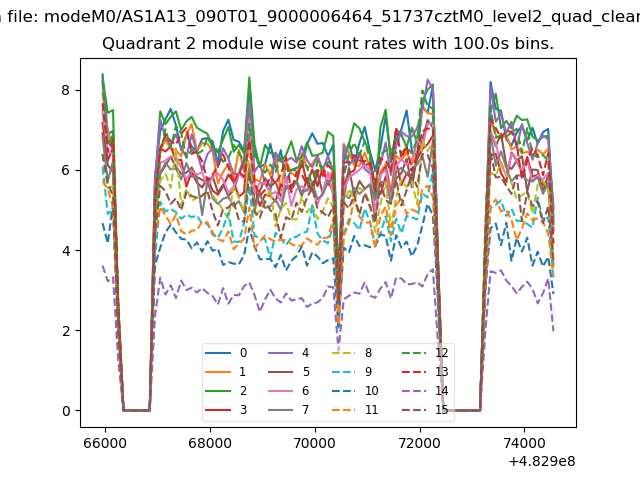
| Module-wise count rates for Quadrant B Data is divided into 100 sec bins |
 |
 |
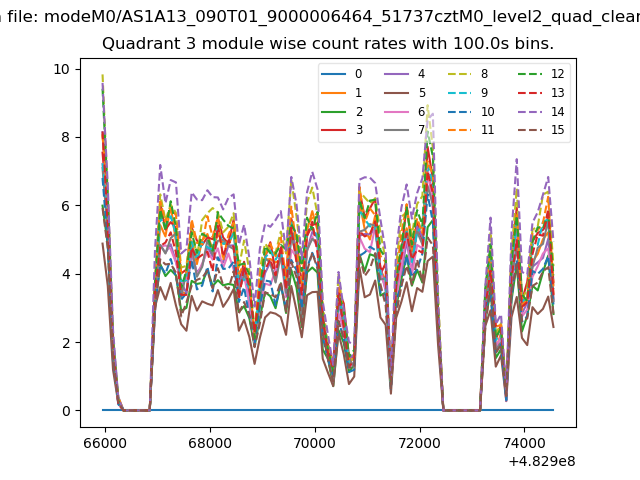
| Module-wise count rates for Quadrant C Data is divided into 100 sec bins |
 |
 |
| Module-wise count rates for Quadrant D Data is divided into 100 sec bins |
 |
 |
| Parameter | Plot |
|---|---|
| CZT HV Monitor | 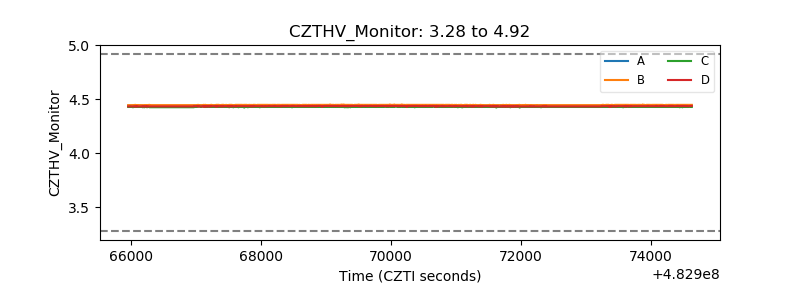 |
| D_VDD | 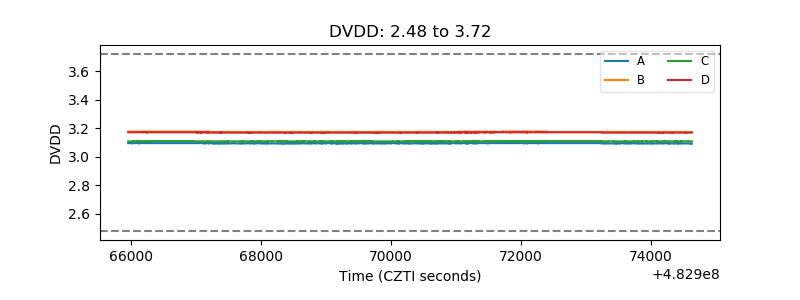 |
| Temperature 1 | 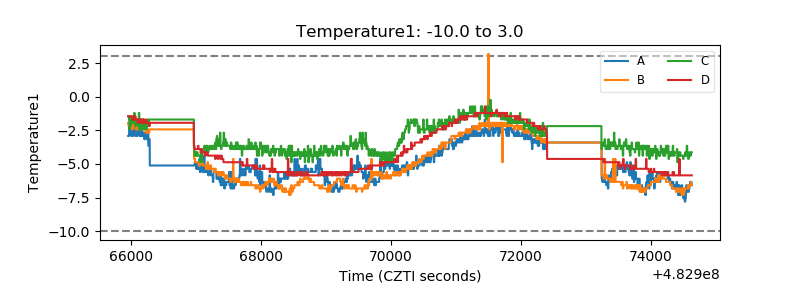 |
| Veto HV Monitor | 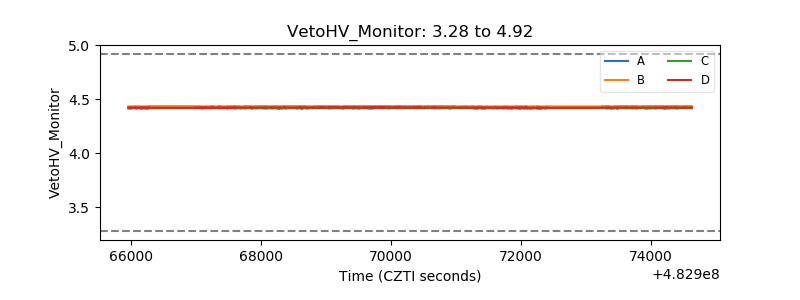 |
| Veto LLD | 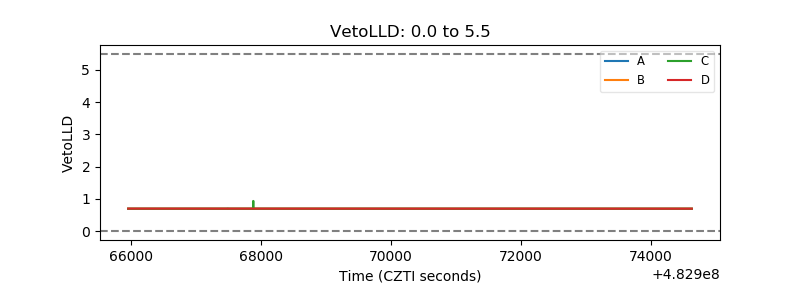 |
| Alpha Counter | 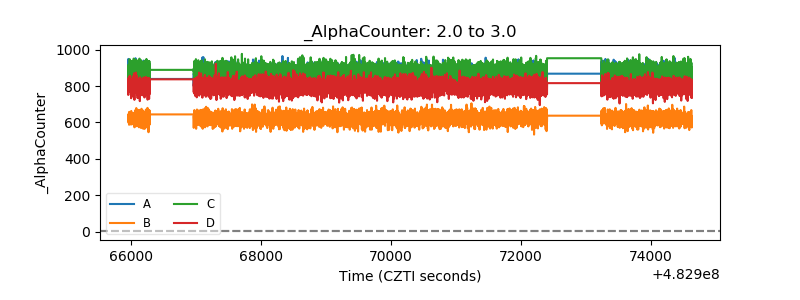 |
| _CPM_Rate | 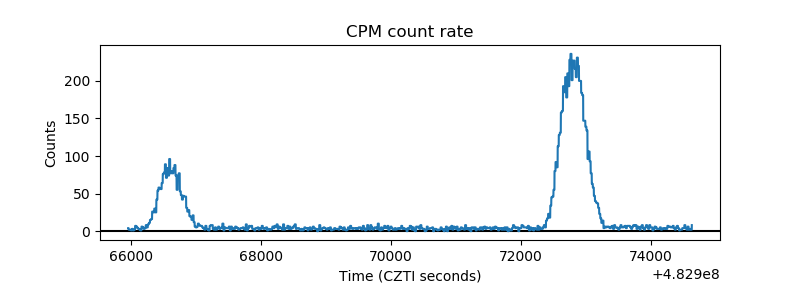 |
| CZT Counter | 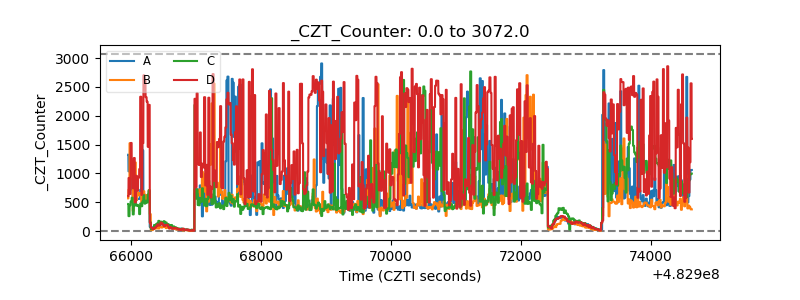 |
| +2.5 Volts monitor | 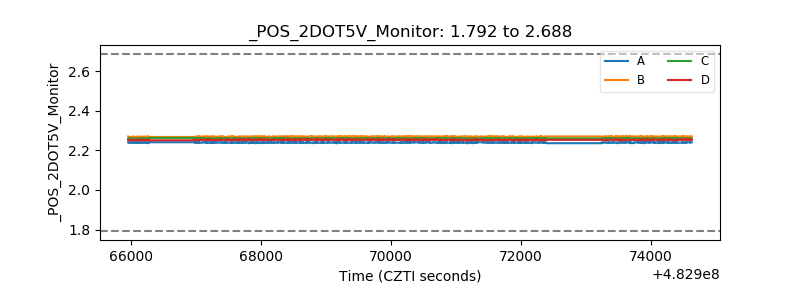 |
| +5 Volts monitor | 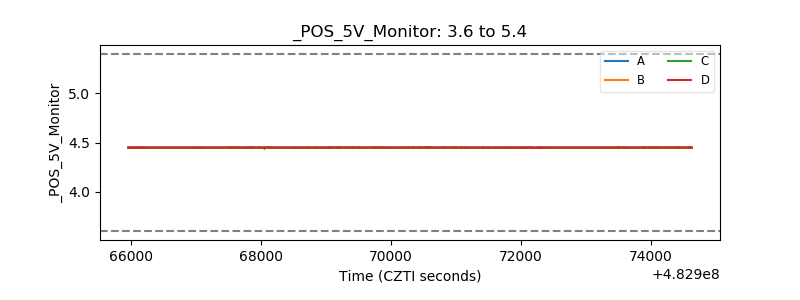 |
| _ROLL_ROT | 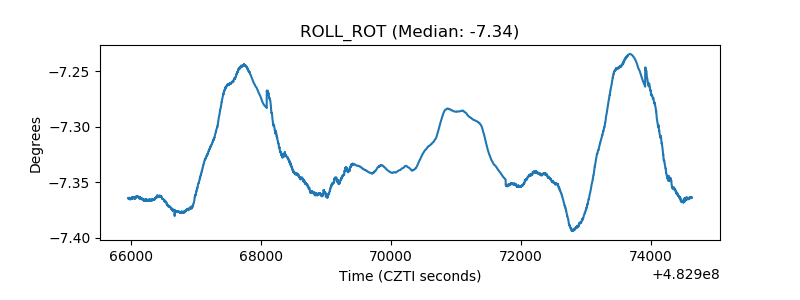 |
| _Roll_DEC | 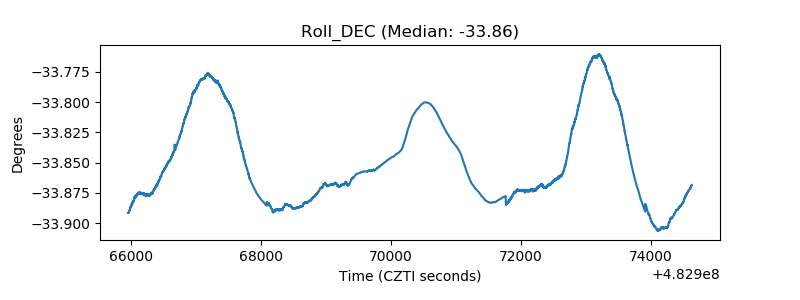 |
| _Roll_RA | 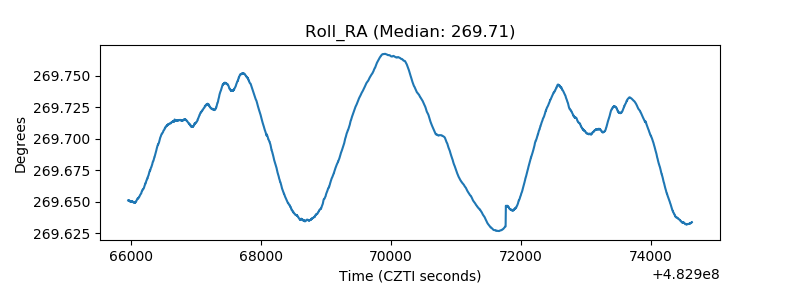 |
| Veto Counter | 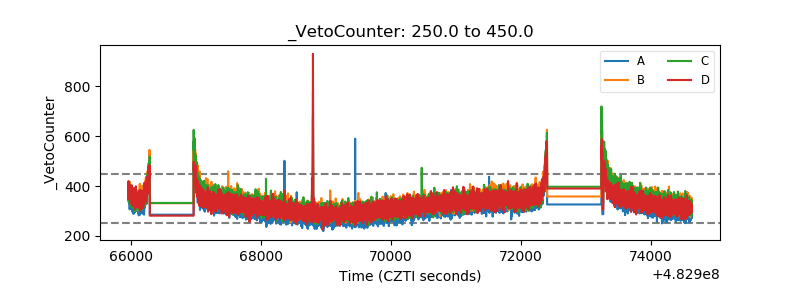 |