| Param | Original file | Final file |
|---|---|---|
| Filename | modeM0/AS1A13_090T01_9000006464_51739cztM0_level2.fits | modeM0/AS1A13_090T01_9000006464_51739cztM0_level2_quad_clean.evt |
| Size (bytes) | 730,232,640 | 103,008,960 |
| Size | 696.4 MB | 98.2 MB |
| Events in quadrant A | 5,848,518 | 690,658 |
| Events in quadrant B | 4,292,213 | 755,816 |
| Events in quadrant C | 6,596,318 | 659,313 |
| Events in quadrant D | 9,729,718 | 504,801 |
| Mode M9 | |||
|---|---|---|---|
| Quadrant | BADHDUFLAG | Total packets | Discarded packets |
| A | 0 | 19 | 0 |
| B | 0 | 19 | 0 |
| C | 0 | 19 | 0 |
| D | 0 | 19 | 0 |
| Mode SS | |||
|---|---|---|---|
| Quadrant | BADHDUFLAG | Total packets | Discarded packets |
| A | 0 | 150 | 0 |
| B | 0 | 150 | 0 |
| C | 0 | 150 | 0 |
| D | 0 | 150 | 0 |
| Mode M0 | |||
|---|---|---|---|
| Quadrant | BADHDUFLAG | Total packets | Discarded packets |
| A | 0 | 22399 | 2 |
| B | 0 | 17682 | 2 |
| C | 0 | 24680 | 2 |
| D | 0 | 33989 | 3 |
| Quadrant | Total seconds | Saturated seconds | Saturation percentage |
|---|---|---|---|
| A | 7301 | 211 | 2.890015% |
| B | 7302 | 191 | 2.615722% |
| C | 7302 | 277 | 3.793481% |
| D | 7301 | 1790 | 24.517189% |
Noise dominated data is calculated using 1-second bins in cleaned event files. If a bin has >2000 counts, and if more than 50% of those come from <1% of pixels, then it is considered to be noise-dominated and hence unusable.
| Quadrant | # 1 sec bins | Bins with >0 counts | Bins with >2000 counts | High rate bins dominated by noise | Noise dominated (total time) | Noise dominated (detector-on time) | Marked lightcurve |
|---|---|---|---|---|---|---|---|
| A | 9136 | 7302 | 138 | 138 | 1.51% | 1.89% | 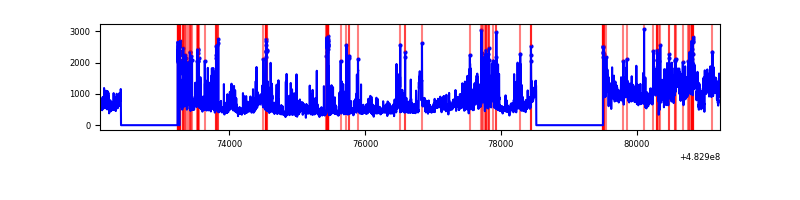 |
| B | 9137 | 7304 | 109 | 109 | 1.19% | 1.49% | 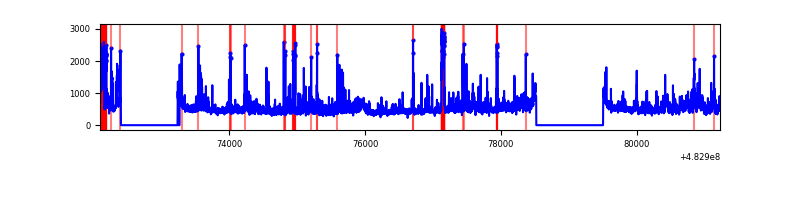 |
| C | 9137 | 7303 | 245 | 245 | 2.68% | 3.35% | 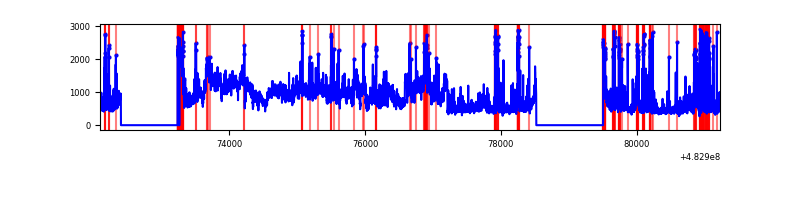 |
| D | 9136 | 7301 | 1839 | 1839 | 20.13% | 25.19% | 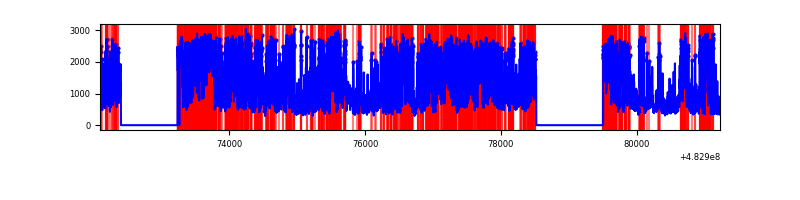 |
Top three noisy pixels from each quadrant. If the there are fewer than three noisy pixels in the level2.evt file, extra rows are filled as -1
| Pixel properties | Quadrant properties | ||||||
|---|---|---|---|---|---|---|---|
| Quadrant | DetID | PixID | Counts | Sigma | Mean | Median | Sigma |
| A | 3 | 14 | 1461181 | 7612.07 | 780 | 764 | 191.9 |
| A | 13 | 248 | 341534 | 1776.18 | 780 | 764 | 191.9 |
| A | 12 | 3 | 142595 | 739.26 | 780 | 764 | 191.9 |
| B | 10 | 254 | 312539 | 1850.29 | 781 | 753 | 168.5 |
| B | 4 | 174 | 174042 | 1028.38 | 781 | 753 | 168.5 |
| B | 4 | 206 | 125140 | 738.17 | 781 | 753 | 168.5 |
| C | 3 | 242 | 2395574 | 11451.1 | 762 | 756 | 209.1 |
| C | 9 | 38 | 250417 | 1193.78 | 762 | 756 | 209.1 |
| C | 13 | 3 | 223465 | 1064.91 | 762 | 756 | 209.1 |
| D | 11 | 129 | 5075098 | 26303.24 | 680 | 655 | 192.9 |
| D | 8 | 176 | 1462650 | 7578.21 | 680 | 655 | 192.9 |
| D | 2 | 120 | 115327 | 594.4 | 680 | 655 | 192.9 |
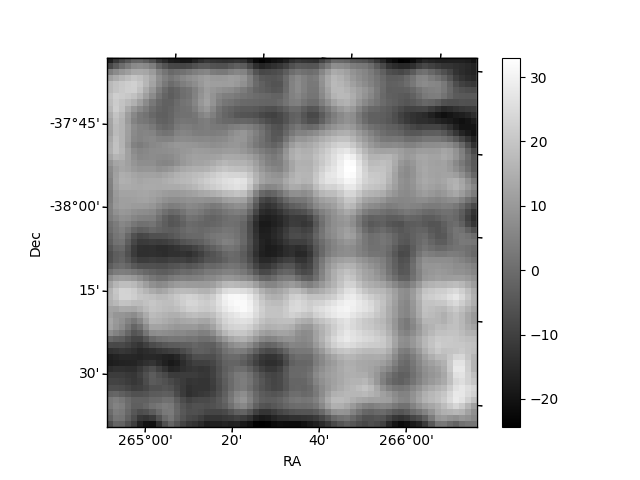
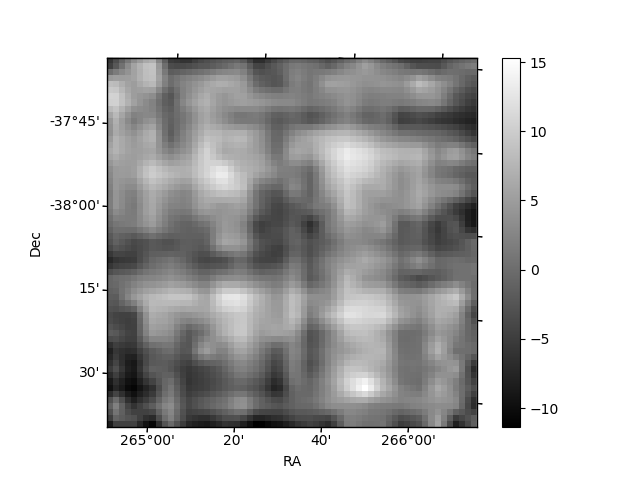
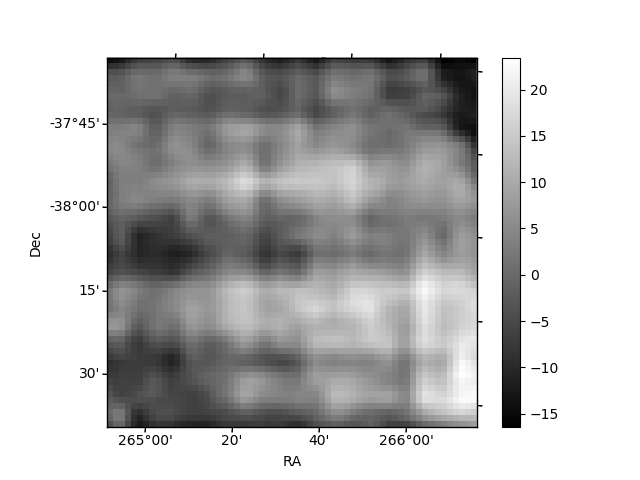
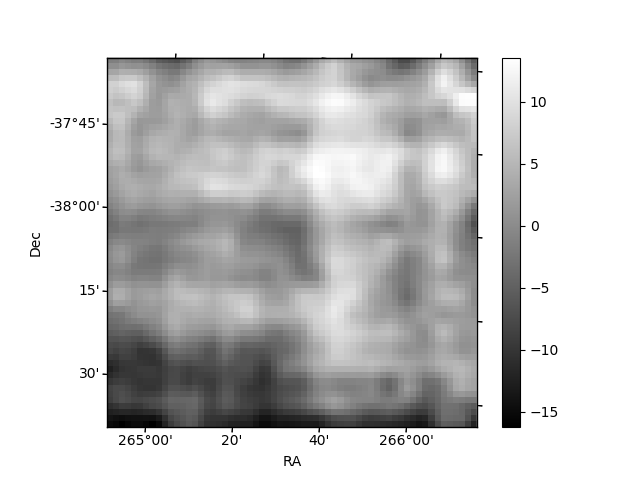
Histogram calculated using DETX and DETY for each event in the final _common_clean file
| Quadrant A | 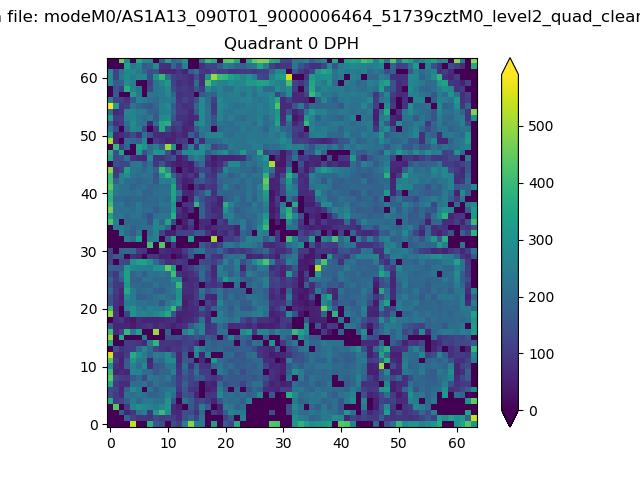 |
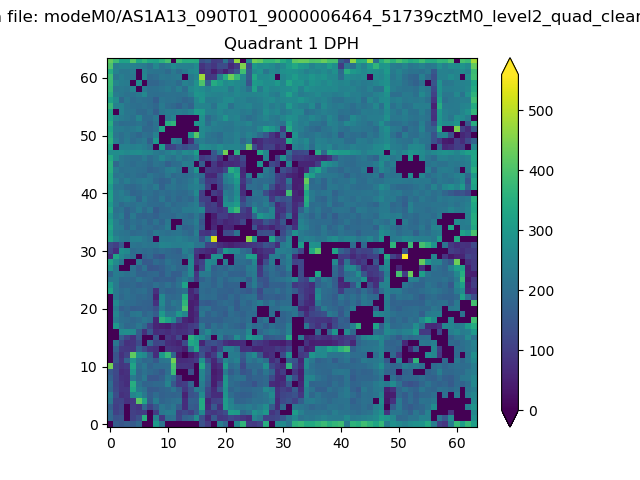 |
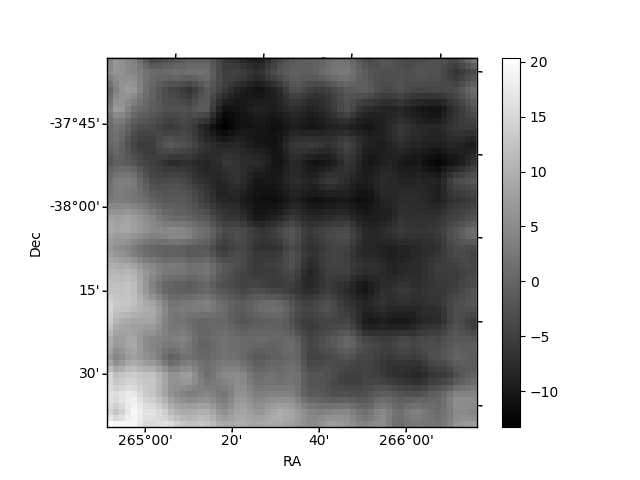
Quadrant B |
|---|---|---|---|
| Quadrant D | 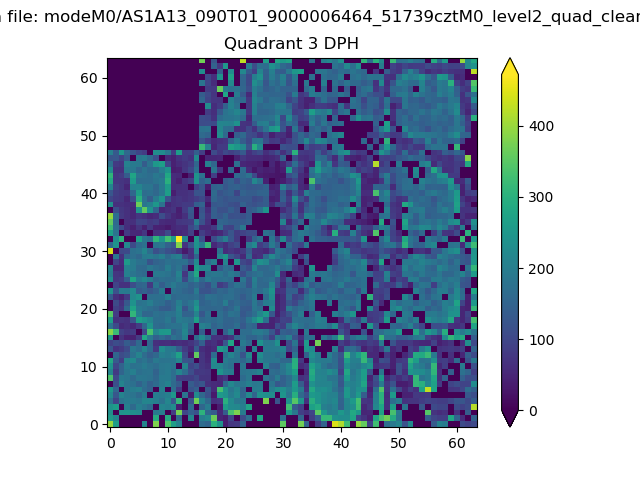 |
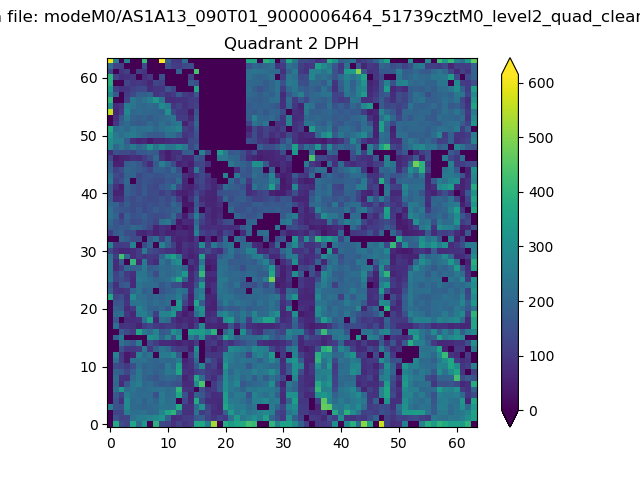 |
Quadrant C |
| Plot type | Count rate plots | Images |
|---|---|---|
| Comparison with Poisson distribution Blue bars denote a histogram of data divided into 1 sec bins. Red curve is a Poisson curve with rate = median count rate of data. |
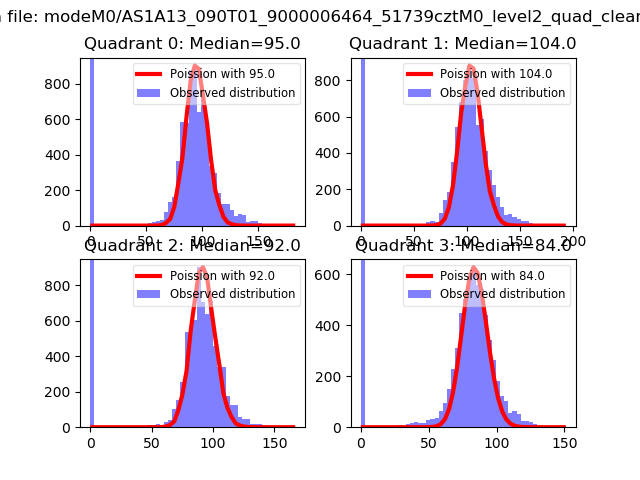 |
 |
| Quadrant-wise count rates Data is divided into 100 sec bins |
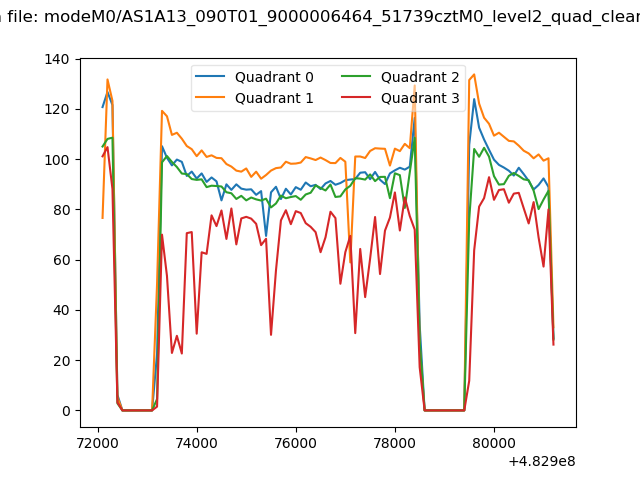 |
|
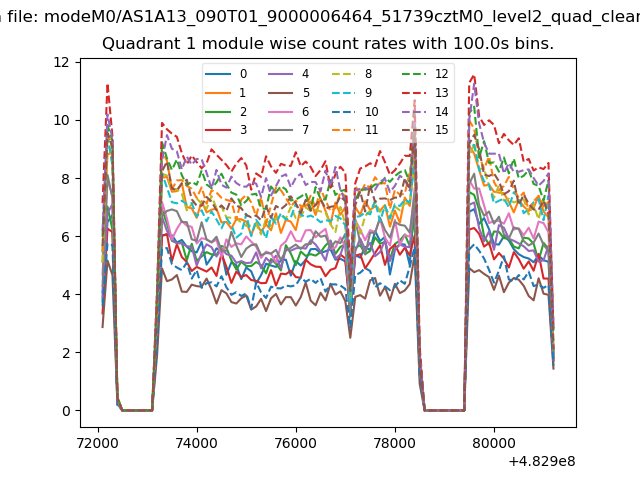
| Module-wise count rates for Quadrant A Data is divided into 100 sec bins |
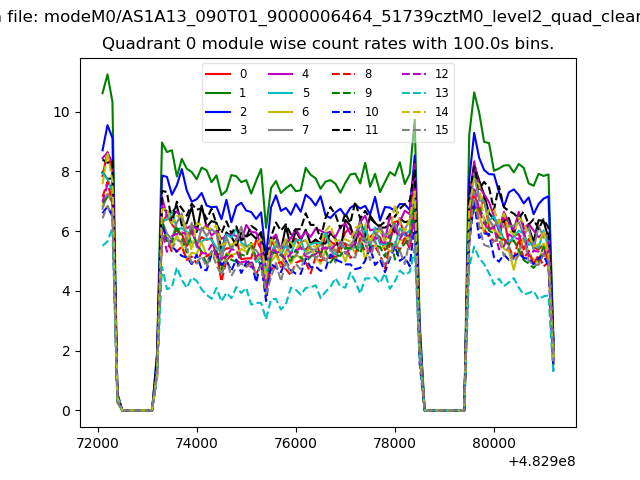 |
 |
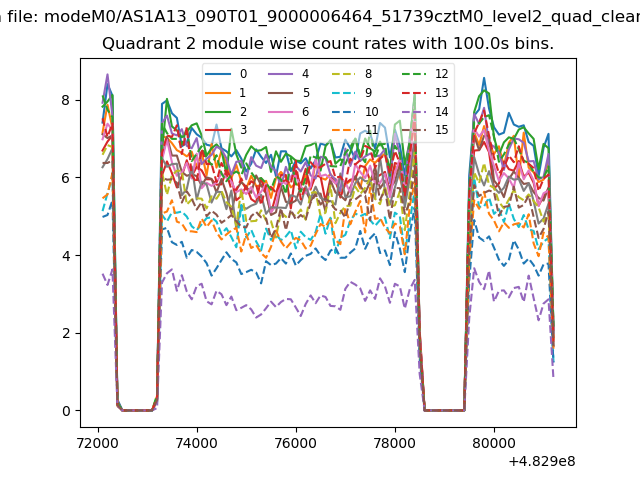
| Module-wise count rates for Quadrant B Data is divided into 100 sec bins |
 |
 |
| Module-wise count rates for Quadrant C Data is divided into 100 sec bins |
 |
 |
| Module-wise count rates for Quadrant D Data is divided into 100 sec bins |
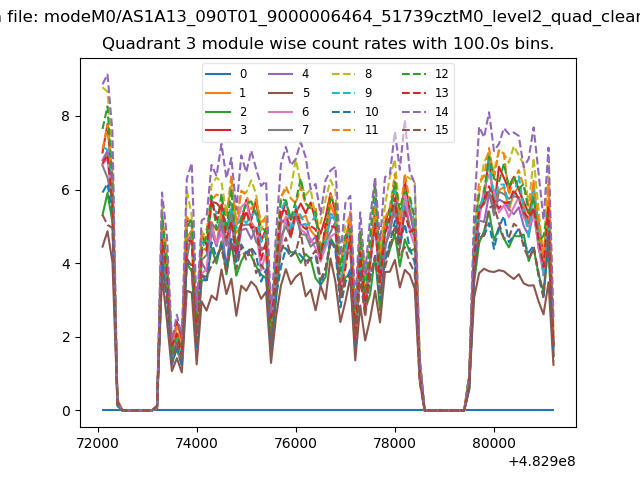 |
 |
| Parameter | Plot |
|---|---|
| CZT HV Monitor | 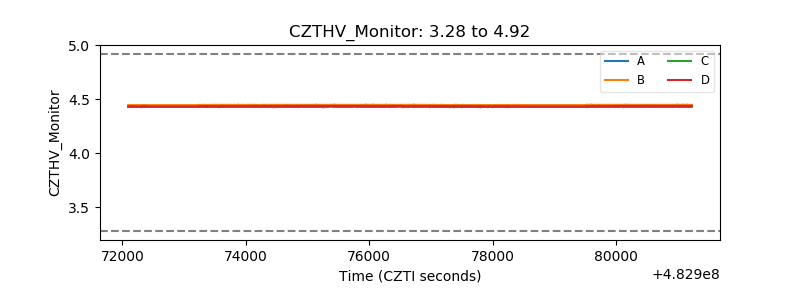 |
| D_VDD | 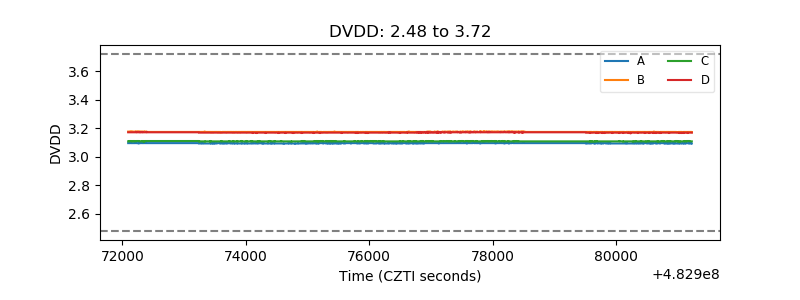 |
| Temperature 1 | 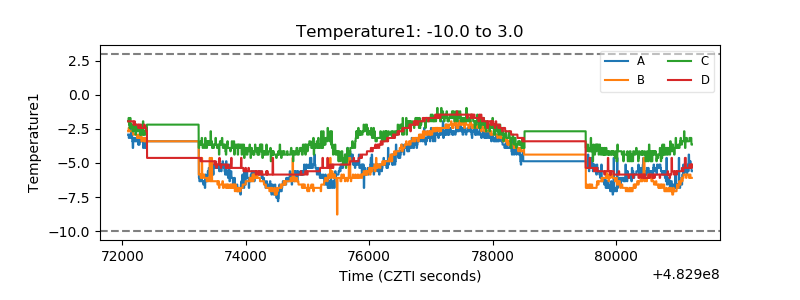 |
| Veto HV Monitor | 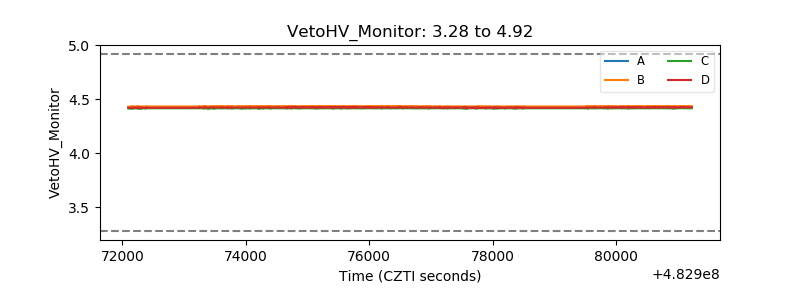 |
| Veto LLD | 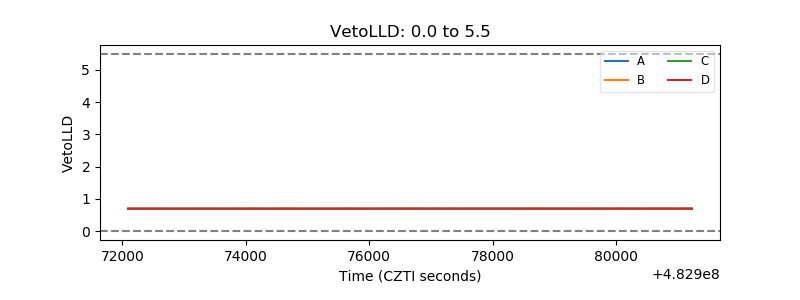 |
| Alpha Counter | 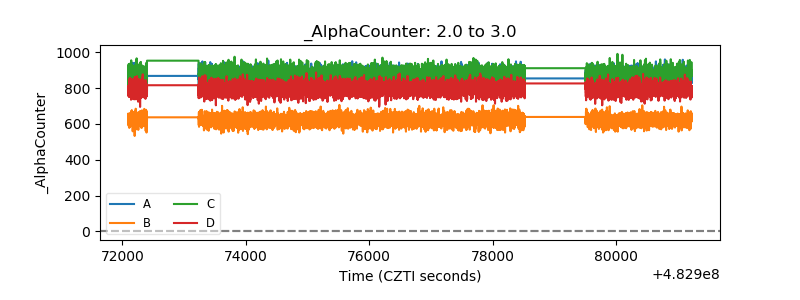 |
| _CPM_Rate | 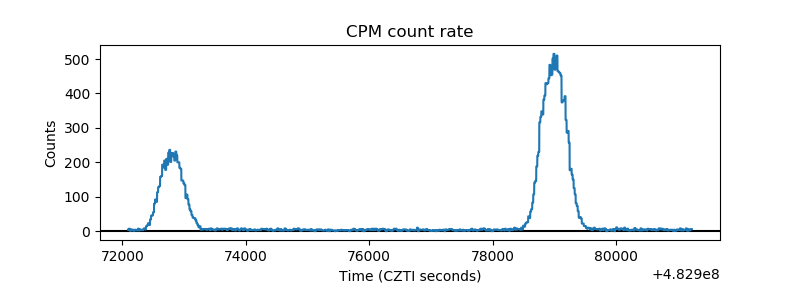 |
| CZT Counter | 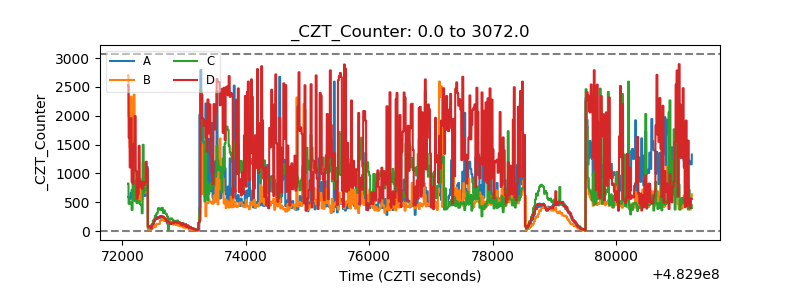 |
| +2.5 Volts monitor | 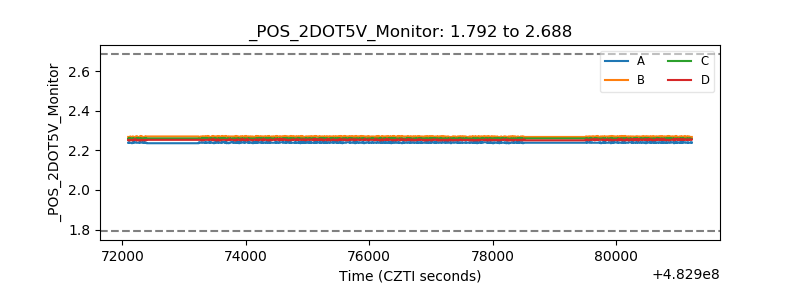 |
| +5 Volts monitor | 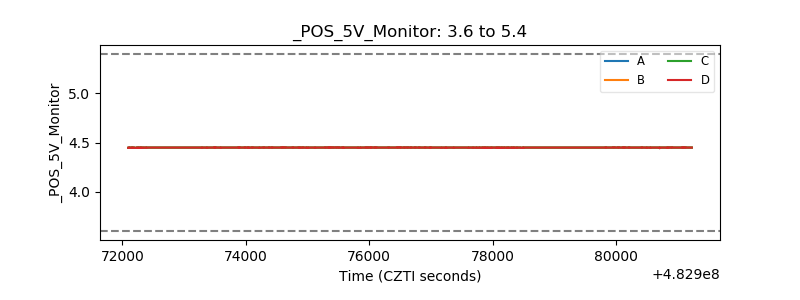 |
| _ROLL_ROT | 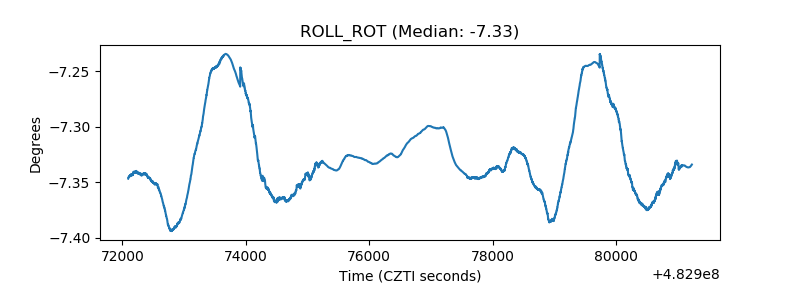 |
| _Roll_DEC | 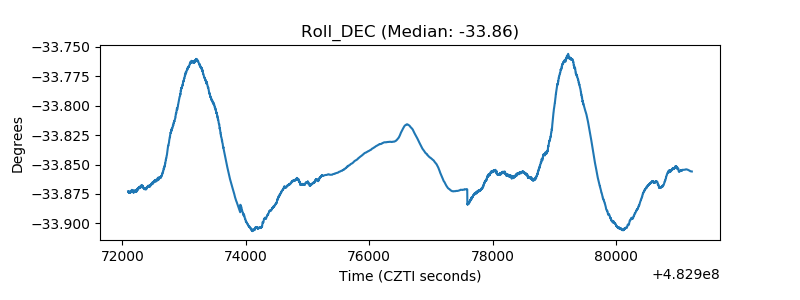 |
| _Roll_RA | 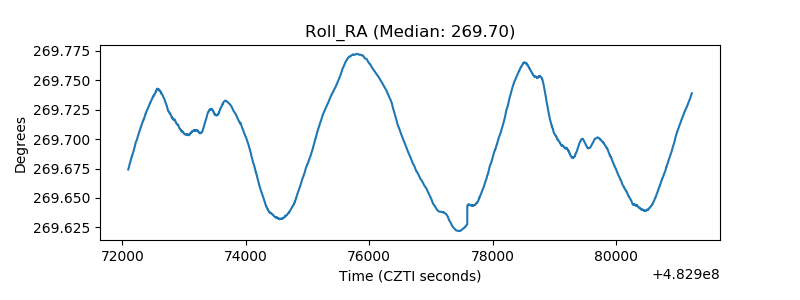 |
| Veto Counter |  |