| Param | Original file | Final file |
|---|---|---|
| Filename | modeM0/AS1A13_090T01_9000006464_51740cztM0_level2.fits | modeM0/AS1A13_090T01_9000006464_51740cztM0_level2_quad_clean.evt |
| Size (bytes) | 795,173,760 | 84,222,720 |
| Size | 758.3 MB | 80.3 MB |
| Events in quadrant A | 6,625,735 | 607,611 |
| Events in quadrant B | 4,819,138 | 642,519 |
| Events in quadrant C | 8,673,540 | 392,674 |
| Events in quadrant D | 8,808,327 | 449,124 |
| Mode M9 | |||
|---|---|---|---|
| Quadrant | BADHDUFLAG | Total packets | Discarded packets |
| A | 0 | 11 | 0 |
| B | 0 | 11 | 0 |
| C | 0 | 11 | 0 |
| D | 0 | 11 | 0 |
| Mode SS | |||
|---|---|---|---|
| Quadrant | BADHDUFLAG | Total packets | Discarded packets |
| A | 0 | 132 | 0 |
| B | 0 | 132 | 0 |
| C | 0 | 132 | 0 |
| D | 0 | 132 | 0 |
| Mode M0 | |||
|---|---|---|---|
| Quadrant | BADHDUFLAG | Total packets | Discarded packets |
| A | 0 | 24206 | 1 |
| B | 0 | 18797 | 1 |
| C | 0 | 30254 | 1 |
| D | 0 | 30735 | 1 |
| Quadrant | Total seconds | Saturated seconds | Saturation percentage |
|---|---|---|---|
| A | 6568 | 415 | 6.318514% |
| B | 6569 | 527 | 8.022530% |
| C | 6569 | 2478 | 37.722637% |
| D | 6569 | 1736 | 26.427158% |
Noise dominated data is calculated using 1-second bins in cleaned event files. If a bin has >2000 counts, and if more than 50% of those come from <1% of pixels, then it is considered to be noise-dominated and hence unusable.
| Quadrant | # 1 sec bins | Bins with >0 counts | Bins with >2000 counts | High rate bins dominated by noise | Noise dominated (total time) | Noise dominated (detector-on time) | Marked lightcurve |
|---|---|---|---|---|---|---|---|
| A | 7618 | 6568 | 346 | 346 | 4.54% | 5.27% | 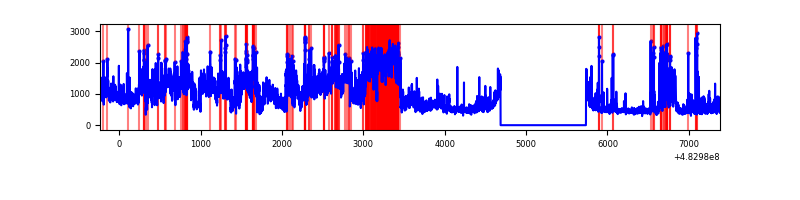 |
| B | 7619 | 6569 | 327 | 327 | 4.29% | 4.98% | 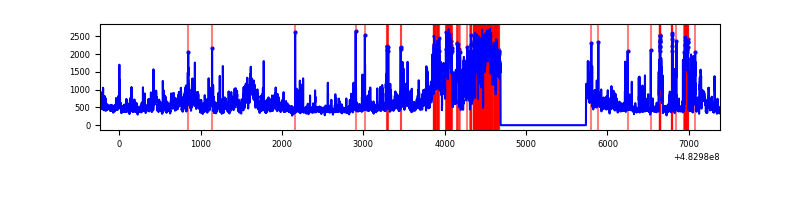 |
| C | 7619 | 6569 | 2308 | 2308 | 30.29% | 35.13% | 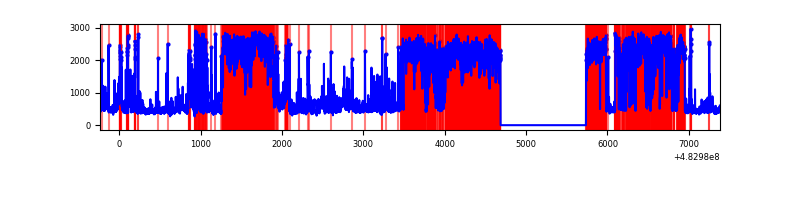 |
| D | 7619 | 6569 | 1747 | 1747 | 22.93% | 26.59% | 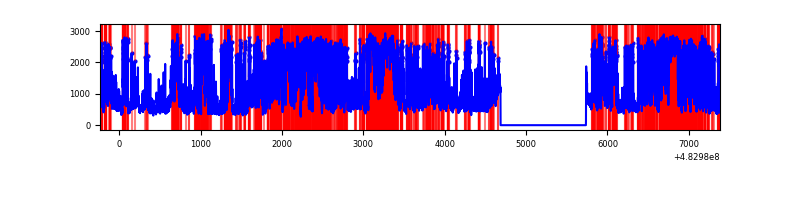 |
Top three noisy pixels from each quadrant. If the there are fewer than three noisy pixels in the level2.evt file, extra rows are filled as -1
| Pixel properties | Quadrant properties | ||||||
|---|---|---|---|---|---|---|---|
| Quadrant | DetID | PixID | Counts | Sigma | Mean | Median | Sigma |
| A | 3 | 14 | 2542669 | 14750.37 | 698 | 680 | 172.3 |
| A | 4 | 175 | 380172 | 2202.07 | 698 | 680 | 172.3 |
| A | 12 | 3 | 334434 | 1936.67 | 698 | 680 | 172.3 |
| B | 10 | 44 | 1013299 | 6884.33 | 684 | 659 | 147.1 |
| B | 4 | 206 | 310348 | 2105.39 | 684 | 659 | 147.1 |
| B | 10 | 254 | 253172 | 1716.68 | 684 | 659 | 147.1 |
| C | 9 | 38 | 5438630 | 36760.48 | 538 | 534 | 147.9 |
| C | 15 | 178 | 137853 | 928.25 | 538 | 534 | 147.9 |
| C | 13 | 3 | 137727 | 927.4 | 538 | 534 | 147.9 |
| D | 11 | 129 | 5294217 | 30636.27 | 616 | 595 | 172.8 |
| D | 8 | 176 | 824109 | 4766.0 | 616 | 595 | 172.8 |
| D | 2 | 120 | 72694 | 417.27 | 616 | 595 | 172.8 |
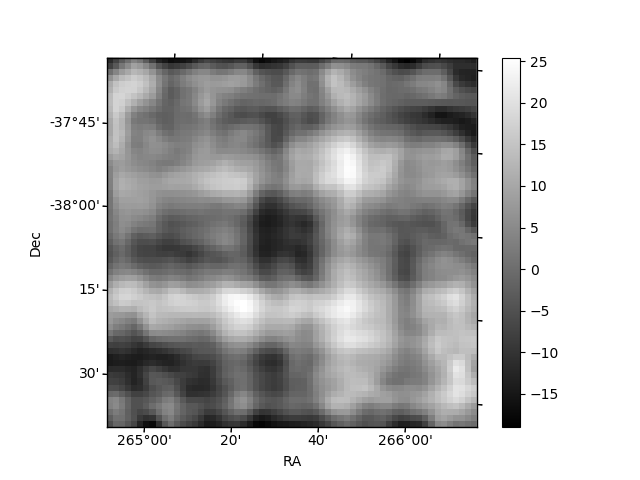
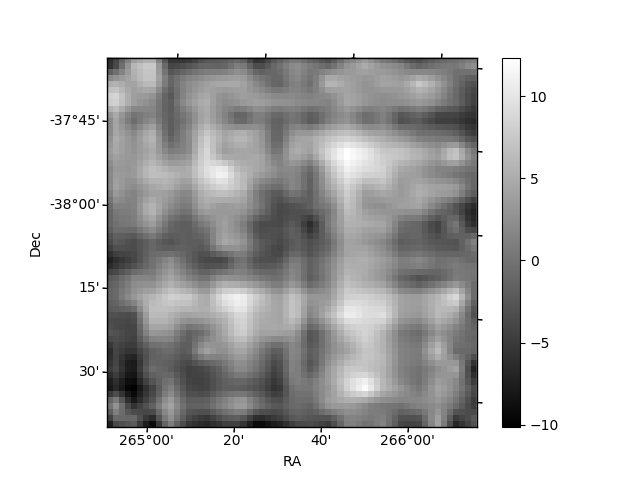
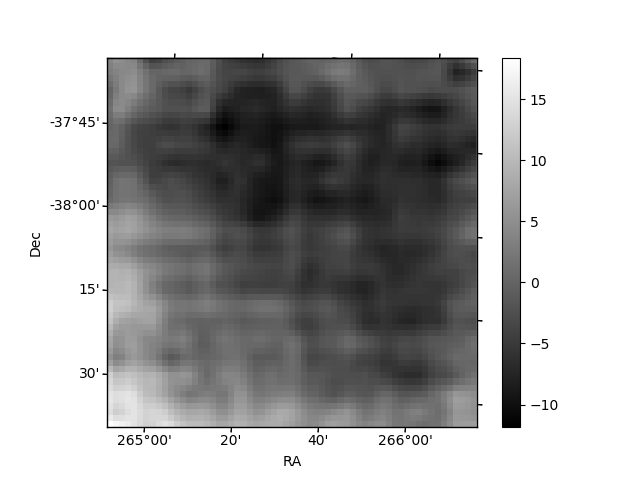
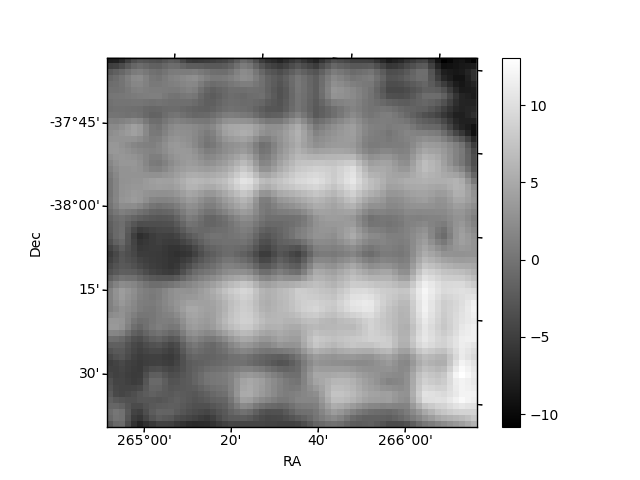
Histogram calculated using DETX and DETY for each event in the final _common_clean file
| Quadrant A | 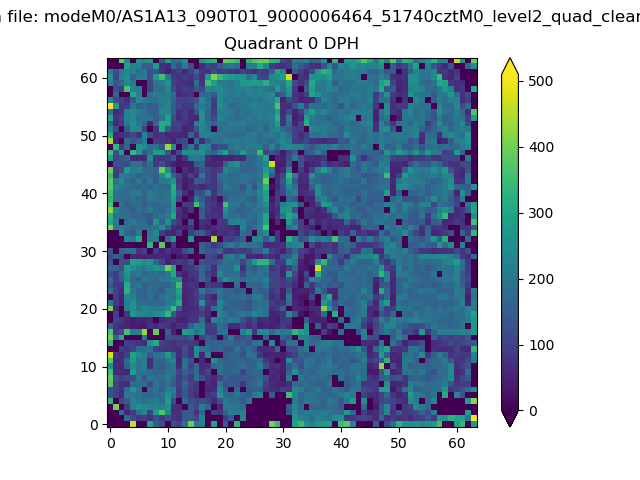 |
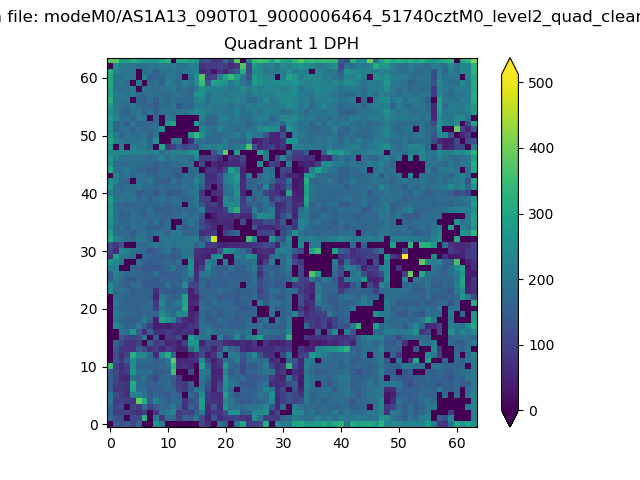 |
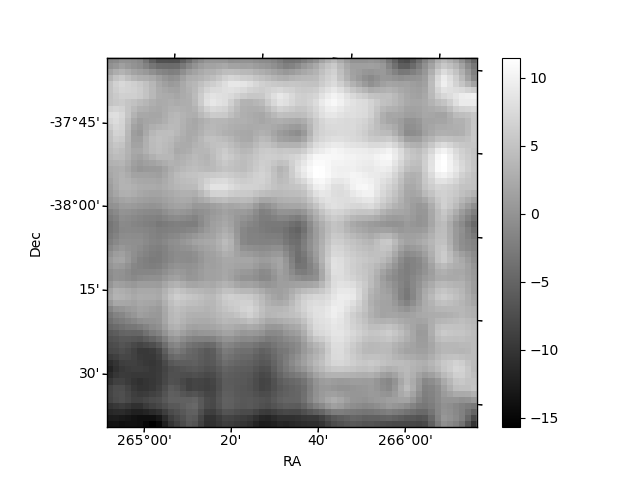
Quadrant B |
|---|---|---|---|
| Quadrant D | 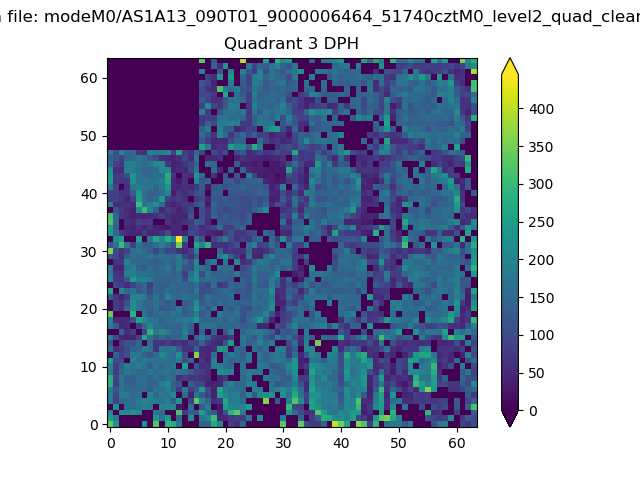 |
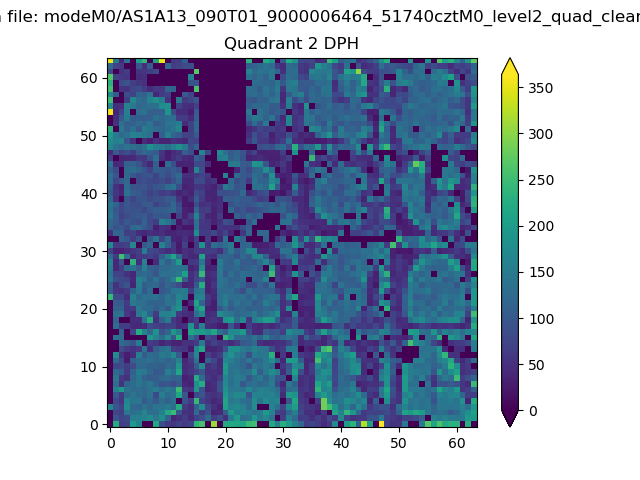 |
Quadrant C |
| Plot type | Count rate plots | Images |
|---|---|---|
| Comparison with Poisson distribution Blue bars denote a histogram of data divided into 1 sec bins. Red curve is a Poisson curve with rate = median count rate of data. |
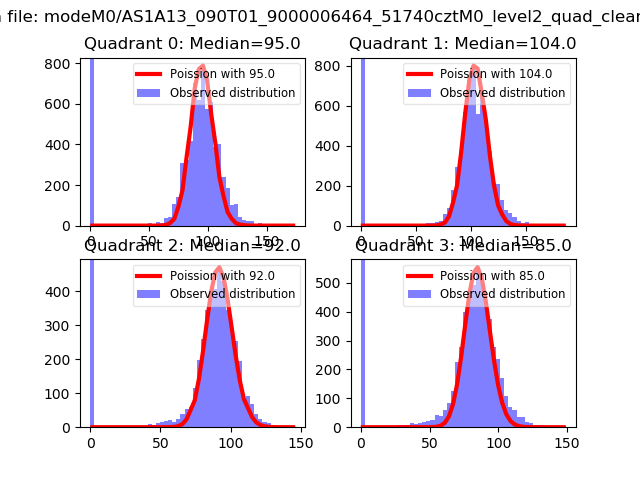 |
 |
| Quadrant-wise count rates Data is divided into 100 sec bins |
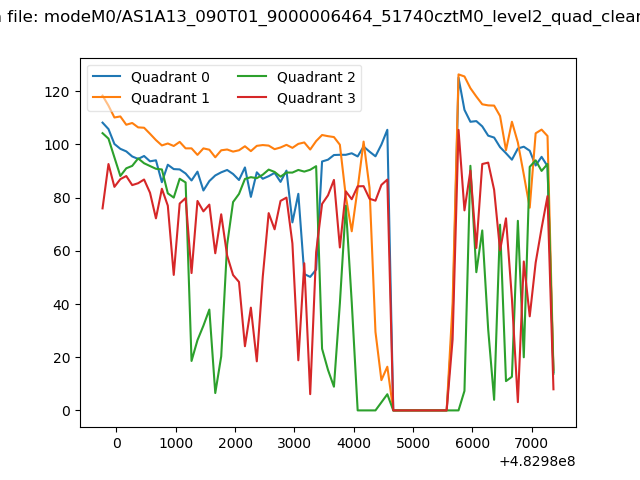 |
|
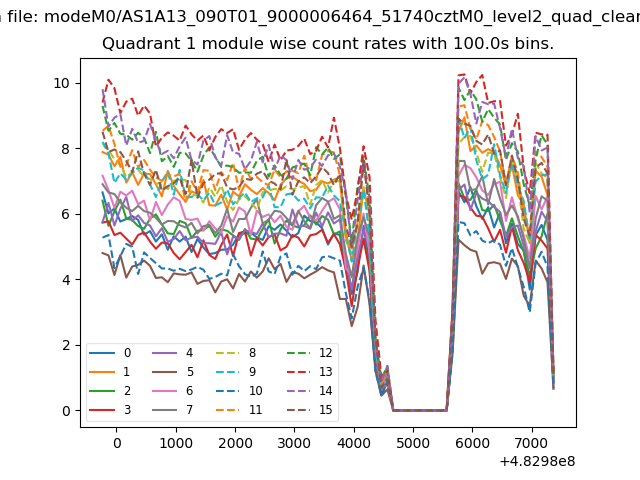
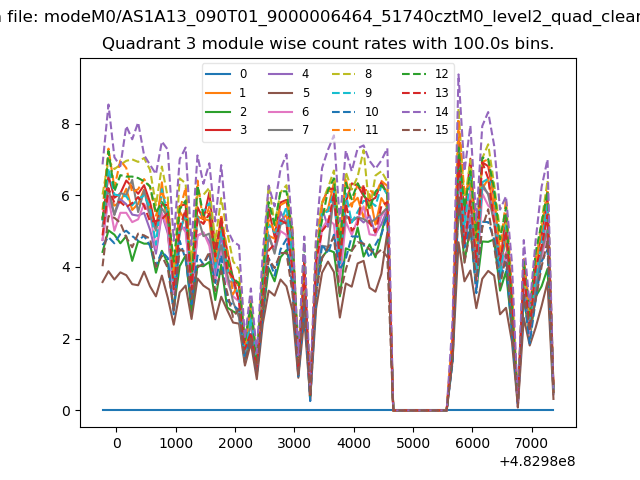
| Module-wise count rates for Quadrant A Data is divided into 100 sec bins |
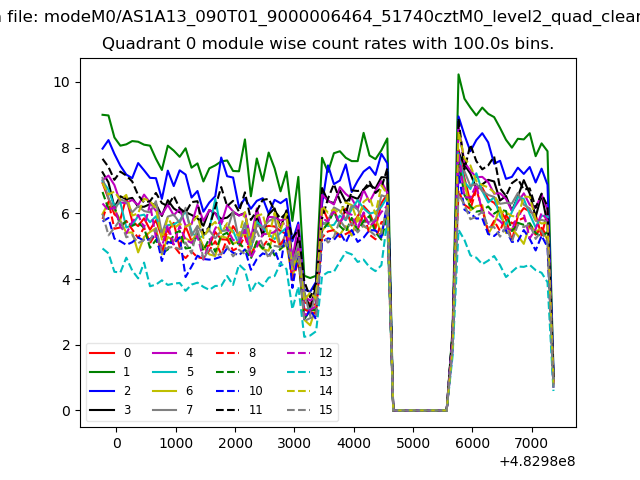 |
 |
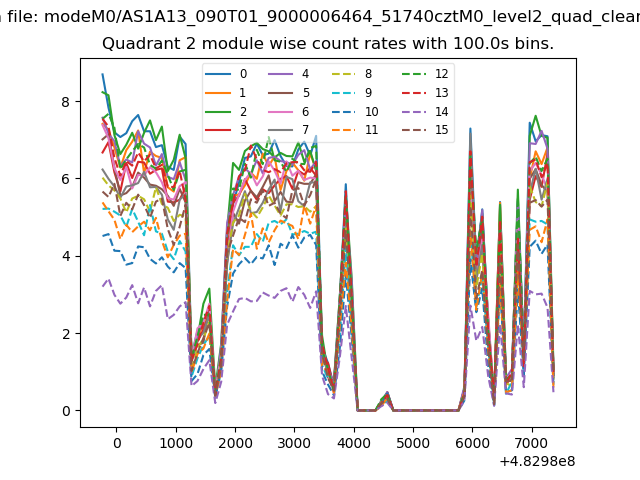
| Module-wise count rates for Quadrant B Data is divided into 100 sec bins |
 |
 |
| Module-wise count rates for Quadrant C Data is divided into 100 sec bins |
 |
 |
| Module-wise count rates for Quadrant D Data is divided into 100 sec bins |
 |
 |
| Parameter | Plot |
|---|---|
| CZT HV Monitor | 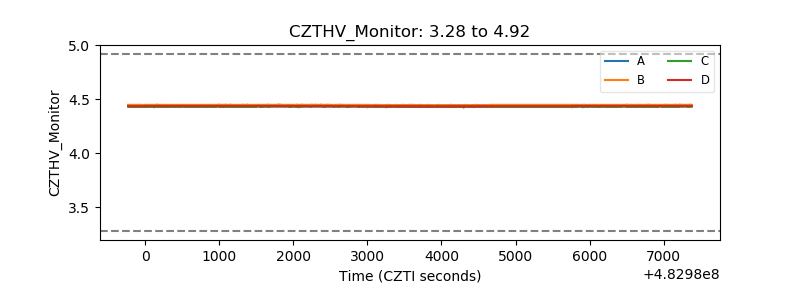 |
| D_VDD | 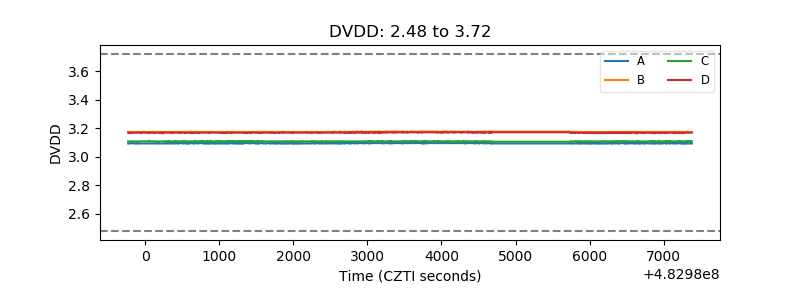 |
| Temperature 1 | 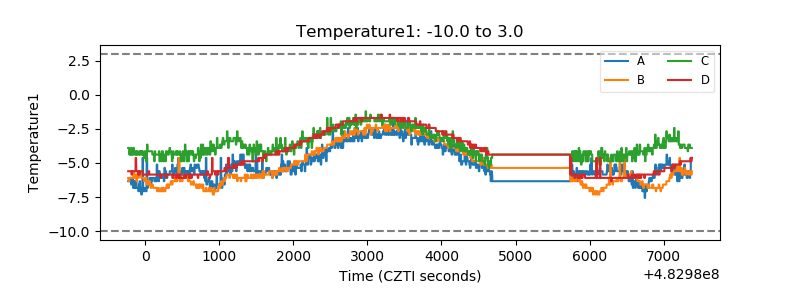 |
| Veto HV Monitor | 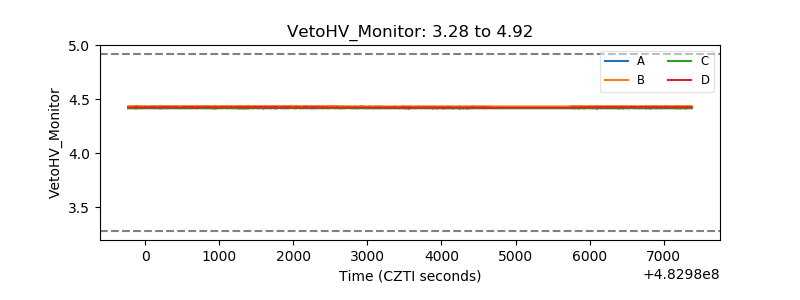 |
| Veto LLD | 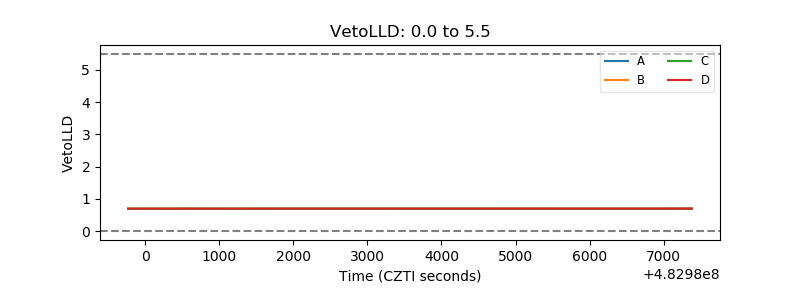 |
| Alpha Counter | 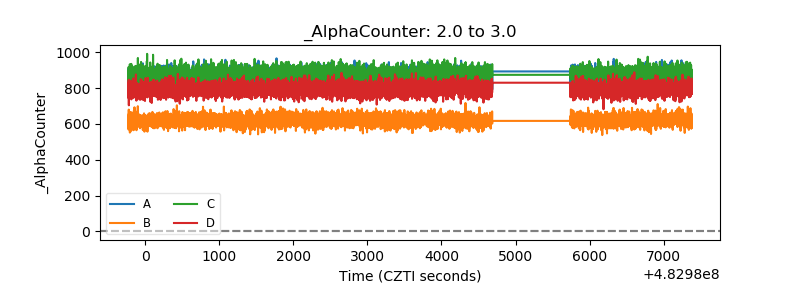 |
| _CPM_Rate | 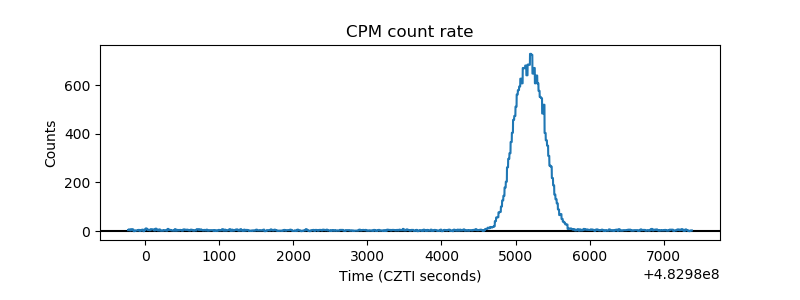 |
| CZT Counter | 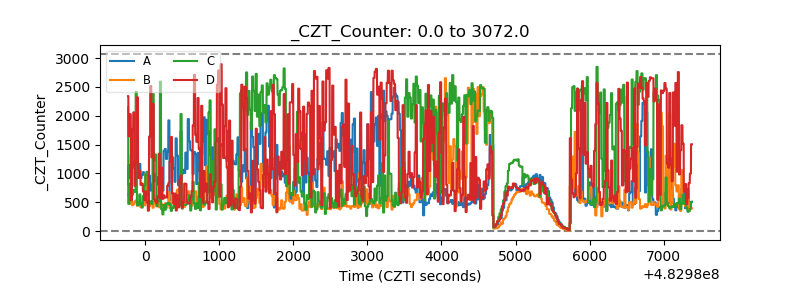 |
| +2.5 Volts monitor | 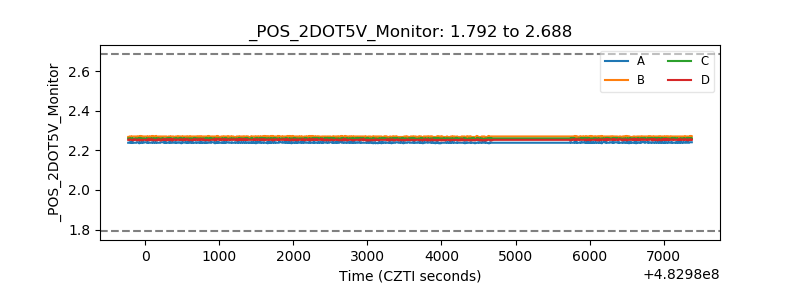 |
| +5 Volts monitor | 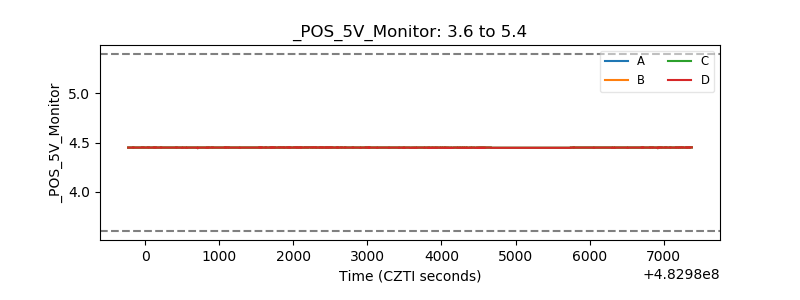 |
| _ROLL_ROT | 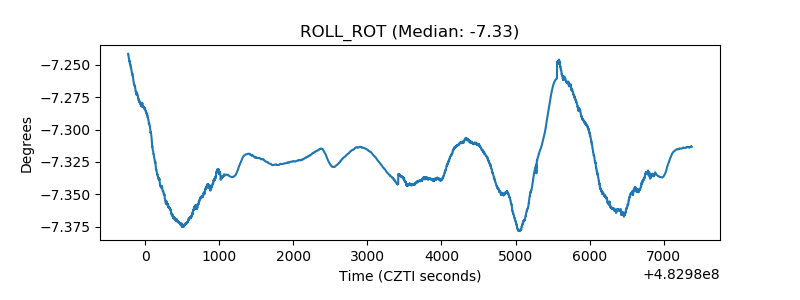 |
| _Roll_DEC | 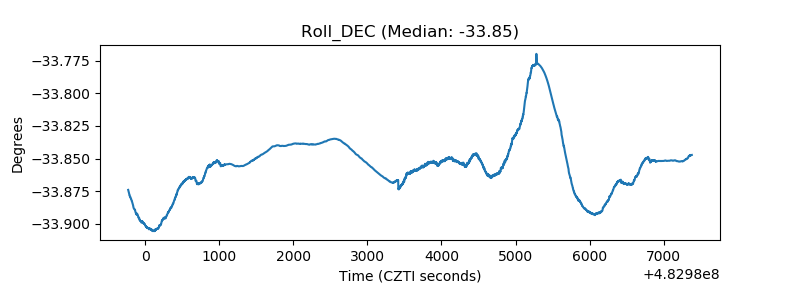 |
| _Roll_RA | 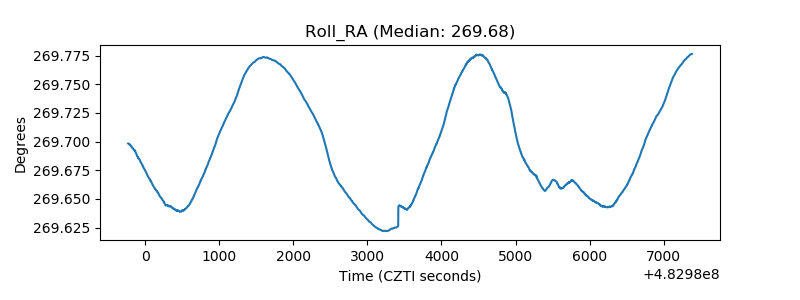 |
| Veto Counter | 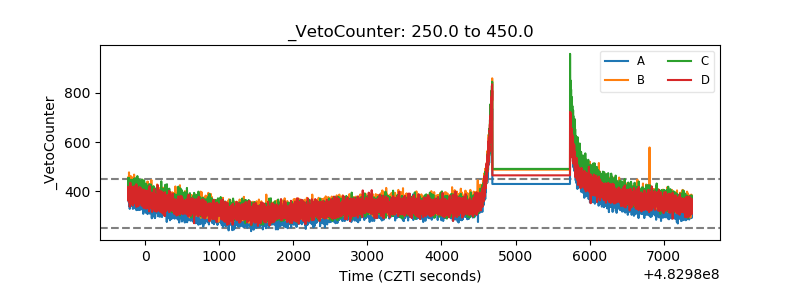 |