| Param | Original file | Final file |
|---|---|---|
| Filename | modeM0/AS1A13_090T01_9000006464_51741cztM0_level2.fits | modeM0/AS1A13_090T01_9000006464_51741cztM0_level2_quad_clean.evt |
| Size (bytes) | 502,444,800 | 82,008,000 |
| Size | 479.2 MB | 78.2 MB |
| Events in quadrant A | 3,894,265 | 552,150 |
| Events in quadrant B | 3,995,055 | 590,883 |
| Events in quadrant C | 4,099,803 | 510,618 |
| Events in quadrant D | 6,168,092 | 431,044 |
| Mode M9 | |||
|---|---|---|---|
| Quadrant | BADHDUFLAG | Total packets | Discarded packets |
| A | 0 | 11 | 0 |
| B | 0 | 11 | 0 |
| C | 0 | 11 | 0 |
| D | 0 | 11 | 0 |
| Mode SS | |||
|---|---|---|---|
| Quadrant | BADHDUFLAG | Total packets | Discarded packets |
| A | 0 | 118 | 0 |
| B | 0 | 118 | 0 |
| C | 0 | 118 | 0 |
| D | 0 | 118 | 0 |
| Mode M0 | |||
|---|---|---|---|
| Quadrant | BADHDUFLAG | Total packets | Discarded packets |
| A | 0 | 15427 | 1 |
| B | 0 | 15716 | 1 |
| C | 0 | 15958 | 1 |
| D | 0 | 22210 | 1 |
| Quadrant | Total seconds | Saturated seconds | Saturation percentage |
|---|---|---|---|
| A | 5691 | 163 | 2.864171% |
| B | 5691 | 256 | 4.498331% |
| C | 5692 | 456 | 8.011244% |
| D | 5692 | 1057 | 18.569923% |
Noise dominated data is calculated using 1-second bins in cleaned event files. If a bin has >2000 counts, and if more than 50% of those come from <1% of pixels, then it is considered to be noise-dominated and hence unusable.
| Quadrant | # 1 sec bins | Bins with >0 counts | Bins with >2000 counts | High rate bins dominated by noise | Noise dominated (total time) | Noise dominated (detector-on time) | Marked lightcurve |
|---|---|---|---|---|---|---|---|
| A | 6820 | 5690 | 119 | 119 | 1.74% | 2.09% | 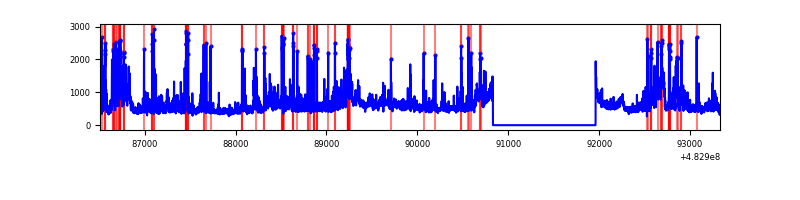 |
| B | 6820 | 5690 | 158 | 158 | 2.32% | 2.78% | 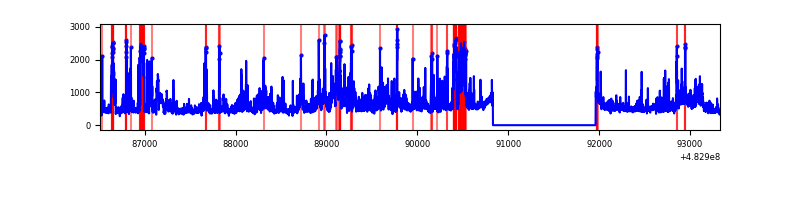 |
| C | 6821 | 5691 | 388 | 388 | 5.69% | 6.82% |  |
| D | 6821 | 5691 | 1018 | 1018 | 14.92% | 17.89% | 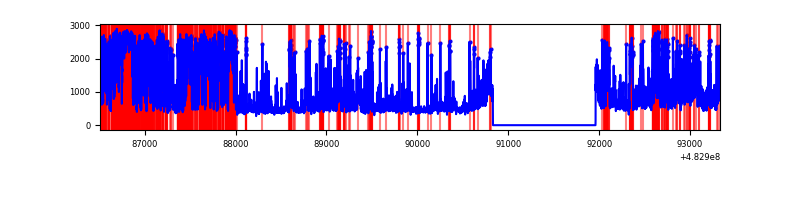 |
Top three noisy pixels from each quadrant. If the there are fewer than three noisy pixels in the level2.evt file, extra rows are filled as -1
| Pixel properties | Quadrant properties | ||||||
|---|---|---|---|---|---|---|---|
| Quadrant | DetID | PixID | Counts | Sigma | Mean | Median | Sigma |
| A | 4 | 175 | 535652 | 3476.51 | 624 | 607 | 153.9 |
| A | 11 | 3 | 255187 | 1654.16 | 624 | 607 | 153.9 |
| A | 4 | 3 | 143653 | 929.46 | 624 | 607 | 153.9 |
| B | 10 | 44 | 444310 | 3351.63 | 614 | 592 | 132.4 |
| B | 4 | 206 | 222310 | 1674.75 | 614 | 592 | 132.4 |
| B | 10 | 247 | 156041 | 1174.18 | 614 | 592 | 132.4 |
| C | 9 | 38 | 751850 | 4506.86 | 601 | 597 | 166.7 |
| C | 13 | 3 | 283924 | 1699.71 | 601 | 597 | 166.7 |
| C | 15 | 144 | 138387 | 826.62 | 601 | 597 | 166.7 |
| D | 11 | 129 | 3338436 | 21031.47 | 565 | 546 | 158.7 |
| D | 8 | 176 | 350459 | 2204.74 | 565 | 546 | 158.7 |
| D | 2 | 120 | 76396 | 477.92 | 565 | 546 | 158.7 |
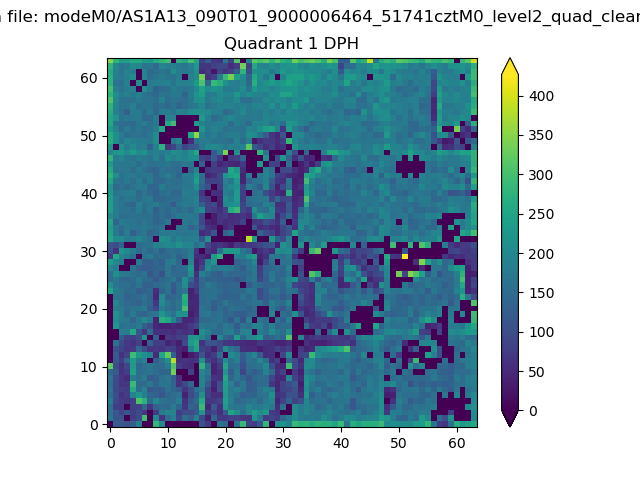
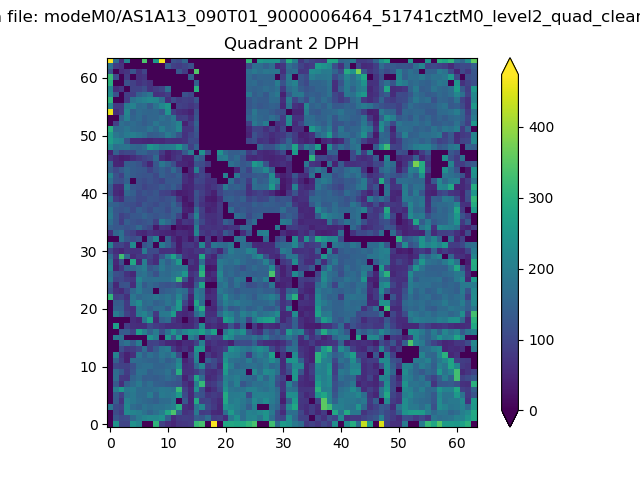
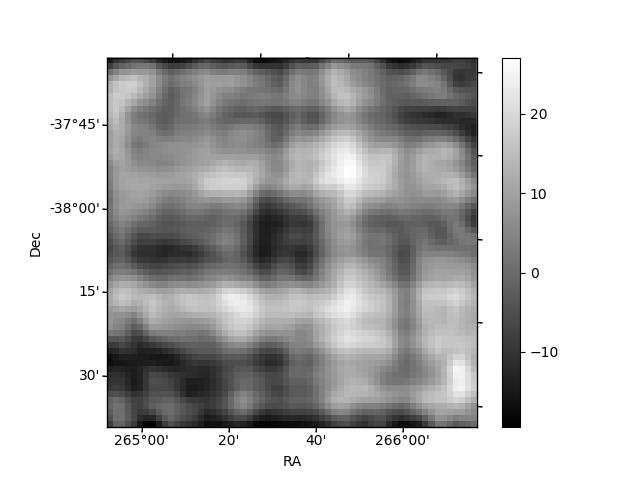
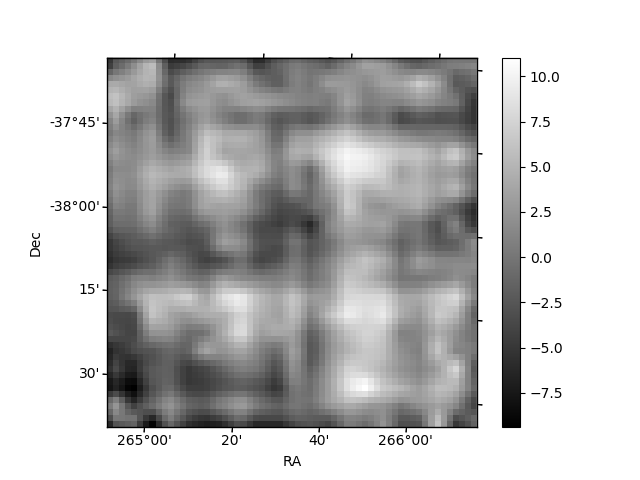
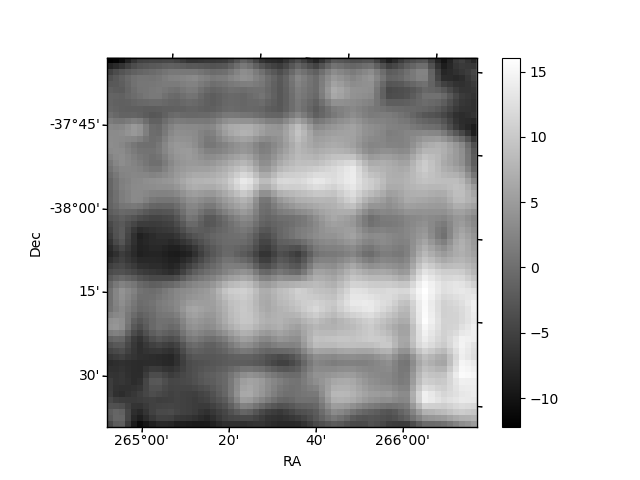
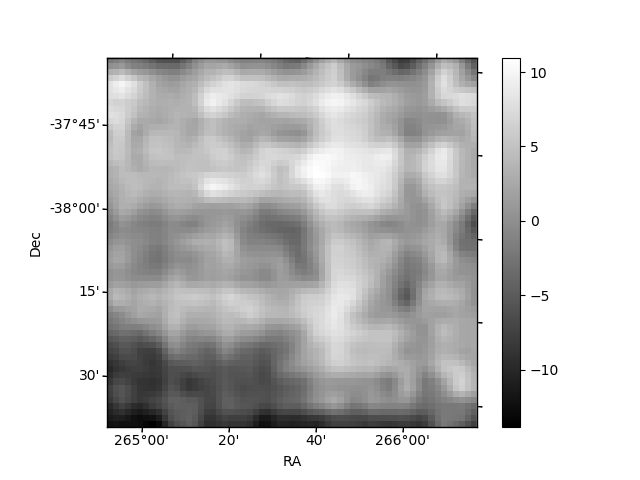
Histogram calculated using DETX and DETY for each event in the final _common_clean file
| Quadrant A | 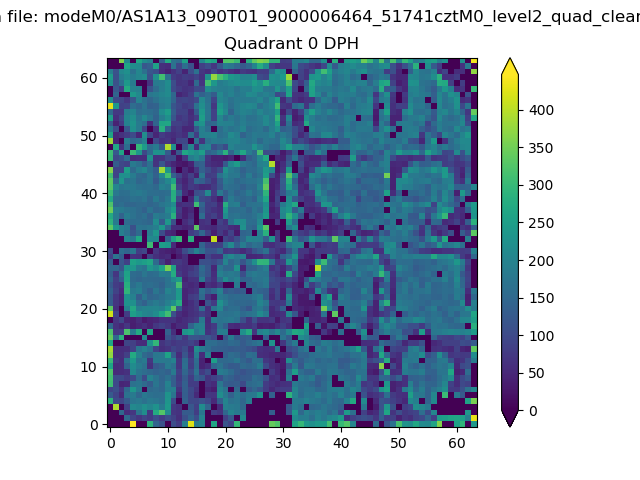 |
 |
Quadrant B |
|---|---|---|---|
| Quadrant D | 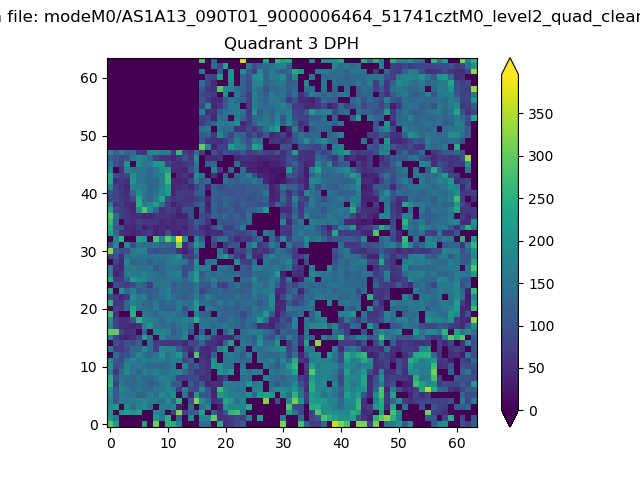 |
 |
Quadrant C |
| Plot type | Count rate plots | Images |
|---|---|---|
| Comparison with Poisson distribution Blue bars denote a histogram of data divided into 1 sec bins. Red curve is a Poisson curve with rate = median count rate of data. |
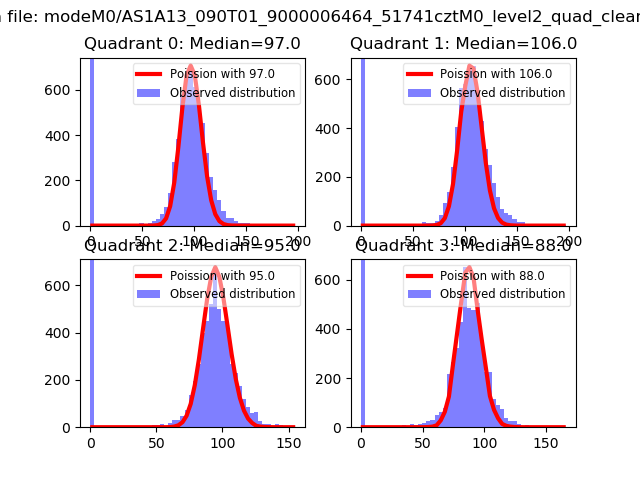 |
 |
| Quadrant-wise count rates Data is divided into 100 sec bins |
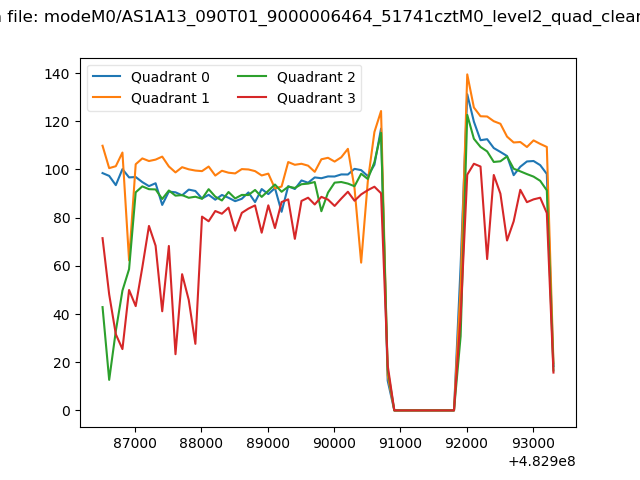 |
|
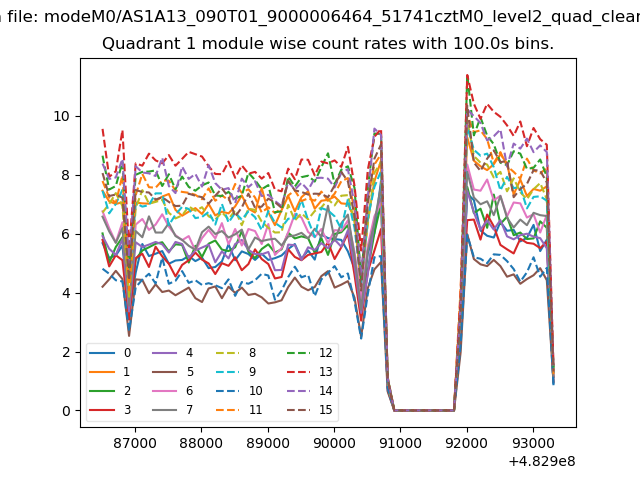
| Module-wise count rates for Quadrant A Data is divided into 100 sec bins |
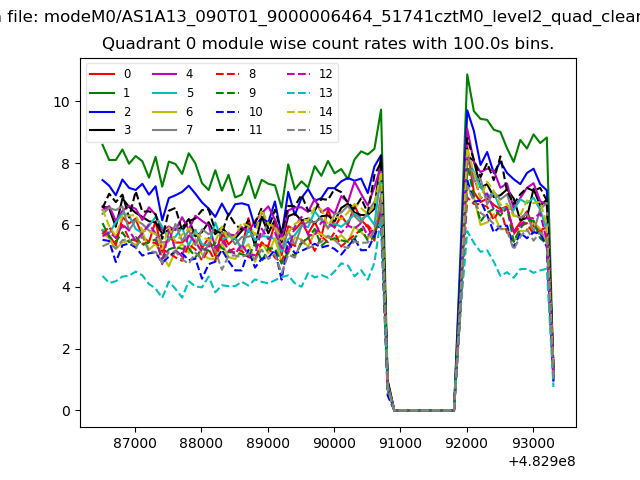 |
 |
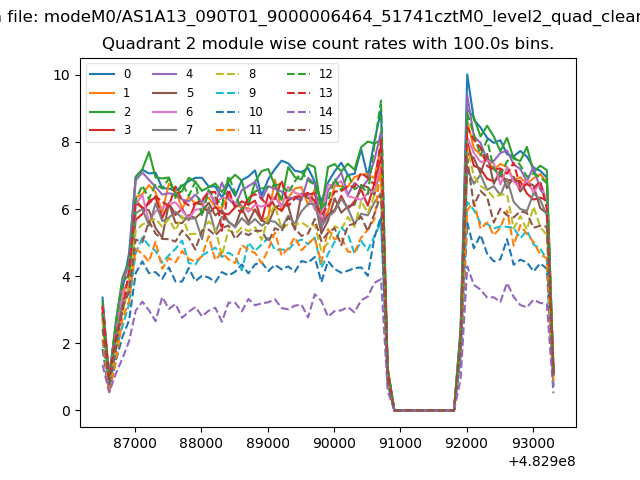
| Module-wise count rates for Quadrant B Data is divided into 100 sec bins |
 |
 |
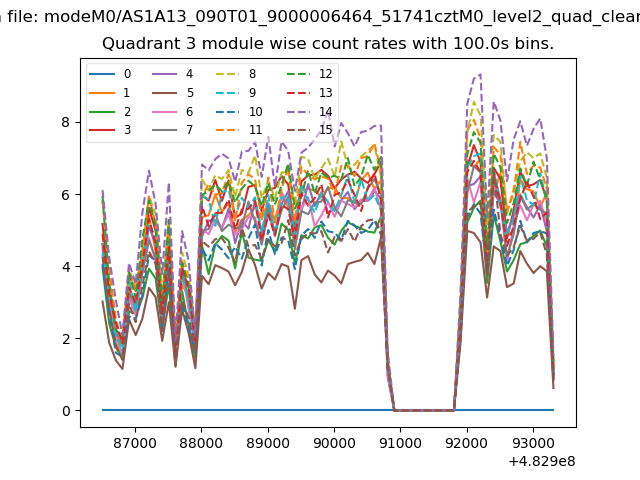
| Module-wise count rates for Quadrant C Data is divided into 100 sec bins |
 |
 |
| Module-wise count rates for Quadrant D Data is divided into 100 sec bins |
 |
 |
| Parameter | Plot |
|---|---|
| CZT HV Monitor | 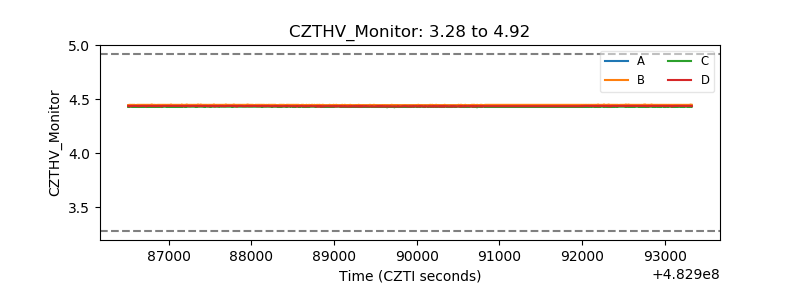 |
| D_VDD | 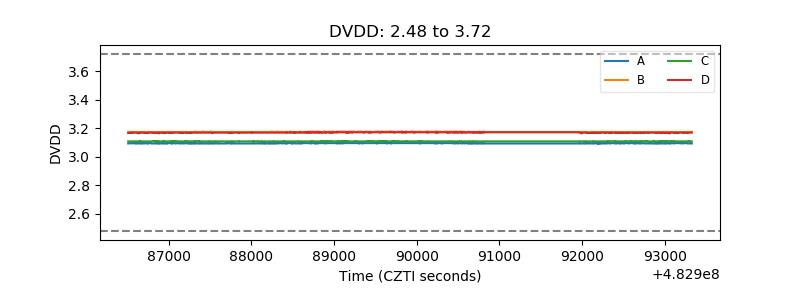 |
| Temperature 1 | 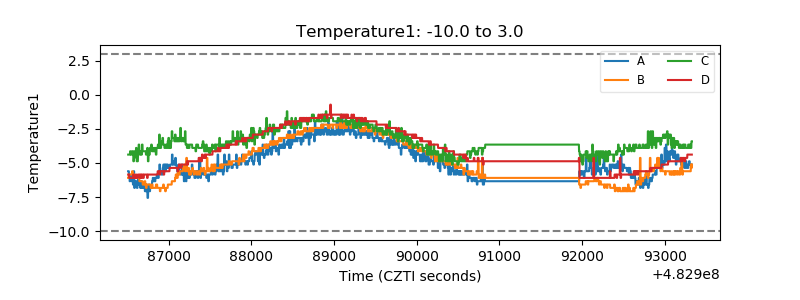 |
| Veto HV Monitor | 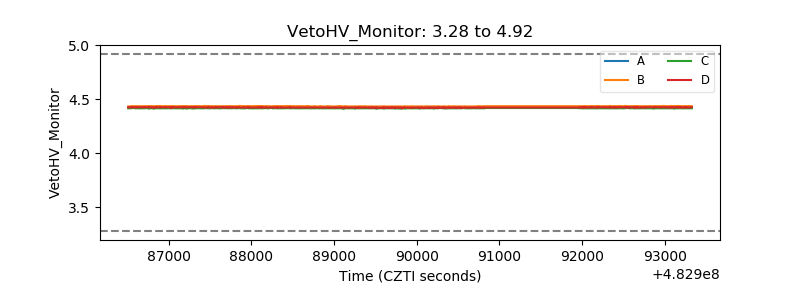 |
| Veto LLD | 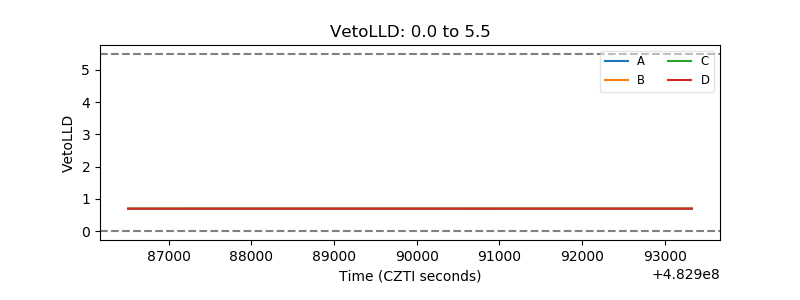 |
| Alpha Counter | 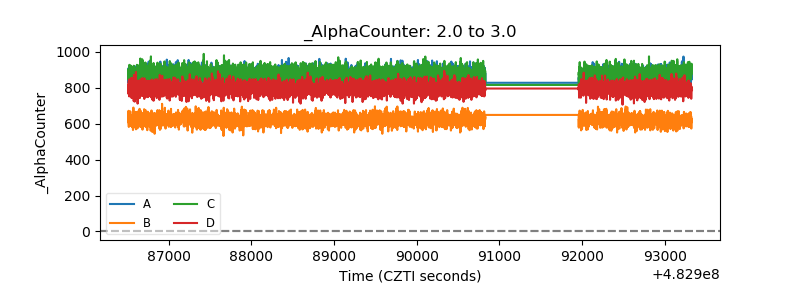 |
| _CPM_Rate | 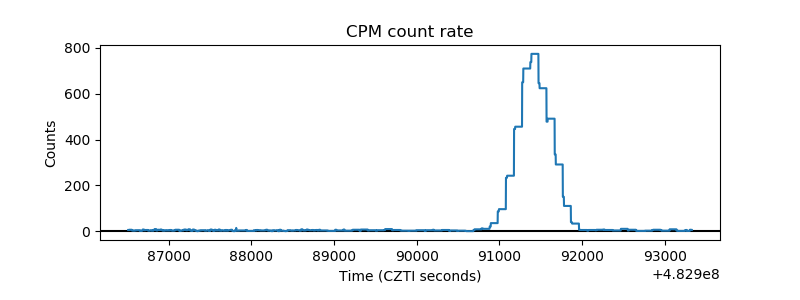 |
| CZT Counter | 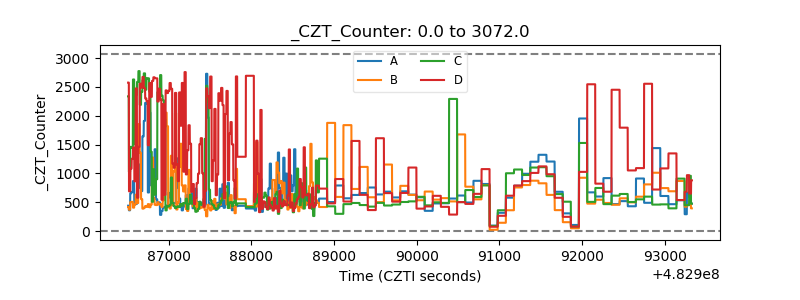 |
| +2.5 Volts monitor | 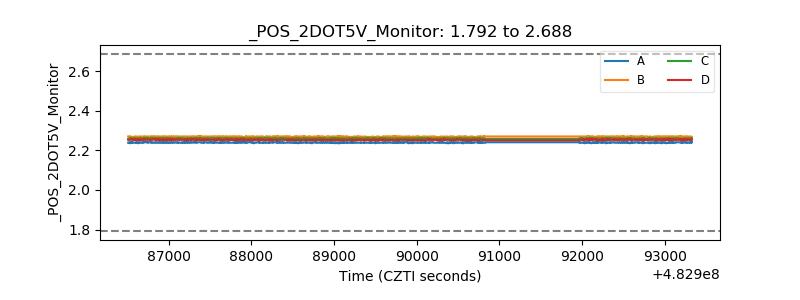 |
| +5 Volts monitor | 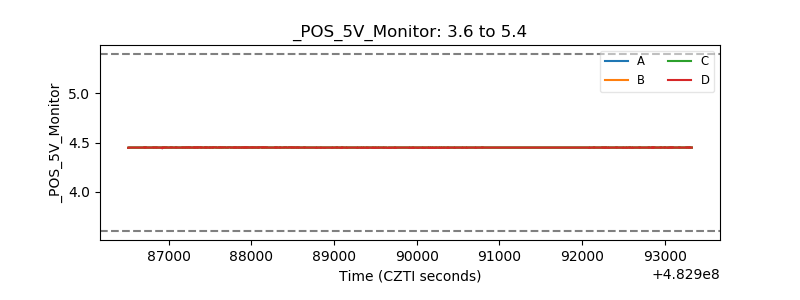 |
| _ROLL_ROT | 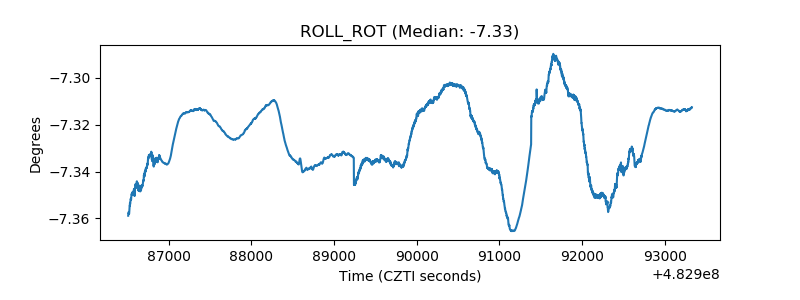 |
| _Roll_DEC | 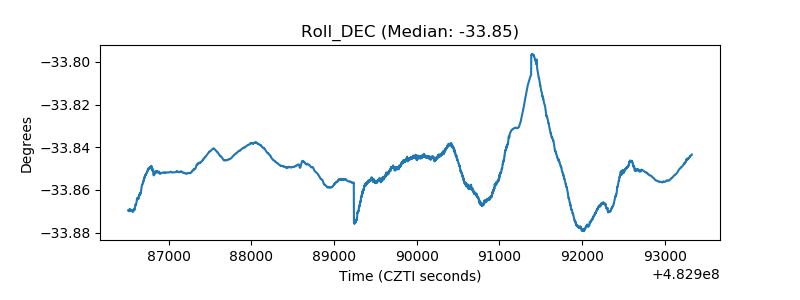 |
| _Roll_RA | 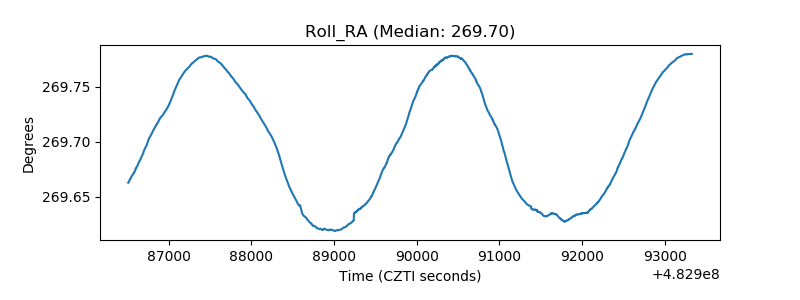 |
| Veto Counter | 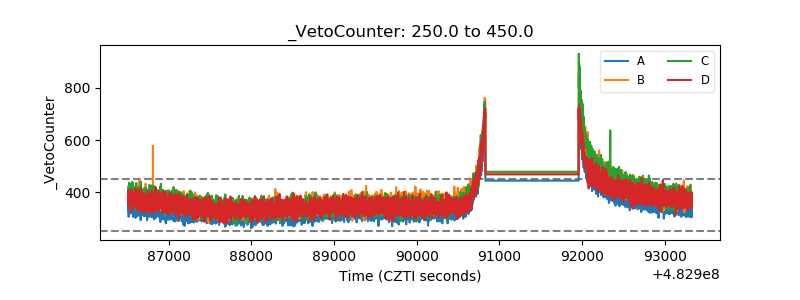 |