| Param | Original file | Final file |
|---|---|---|
| Filename | modeM0/AS1A13_090T01_9000006464_51742cztM0_level2.fits | modeM0/AS1A13_090T01_9000006464_51742cztM0_level2_quad_clean.evt |
| Size (bytes) | 529,427,520 | 96,563,520 |
| Size | 504.9 MB | 92.1 MB |
| Events in quadrant A | 4,267,808 | 639,315 |
| Events in quadrant B | 3,786,658 | 698,067 |
| Events in quadrant C | 4,321,688 | 615,121 |
| Events in quadrant D | 6,722,043 | 522,273 |
| Mode M9 | |||
|---|---|---|---|
| Quadrant | BADHDUFLAG | Total packets | Discarded packets |
| A | 0 | 19 | 0 |
| B | 0 | 20 | 0 |
| C | 0 | 20 | 0 |
| D | 0 | 20 | 0 |
| Mode SS | |||
|---|---|---|---|
| Quadrant | BADHDUFLAG | Total packets | Discarded packets |
| A | 0 | 130 | 0 |
| B | 0 | 130 | 0 |
| C | 0 | 130 | 0 |
| D | 0 | 130 | 0 |
| Mode M0 | |||
|---|---|---|---|
| Quadrant | BADHDUFLAG | Total packets | Discarded packets |
| A | 0 | 17020 | 2 |
| B | 0 | 15591 | 5 |
| C | 0 | 17211 | 2 |
| D | 0 | 24420 | 2 |
| Quadrant | Total seconds | Saturated seconds | Saturation percentage |
|---|---|---|---|
| A | 6440 | 139 | 2.158385% |
| B | 6439 | 147 | 2.282963% |
| C | 6439 | 261 | 4.053424% |
| D | 6439 | 921 | 14.303463% |
Noise dominated data is calculated using 1-second bins in cleaned event files. If a bin has >2000 counts, and if more than 50% of those come from <1% of pixels, then it is considered to be noise-dominated and hence unusable.
| Quadrant | # 1 sec bins | Bins with >0 counts | Bins with >2000 counts | High rate bins dominated by noise | Noise dominated (total time) | Noise dominated (detector-on time) | Marked lightcurve |
|---|---|---|---|---|---|---|---|
| A | 7599 | 6440 | 82 | 82 | 1.08% | 1.27% | 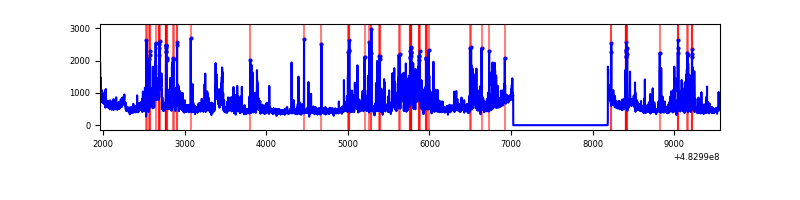 |
| B | 7598 | 6439 | 63 | 63 | 0.83% | 0.98% | 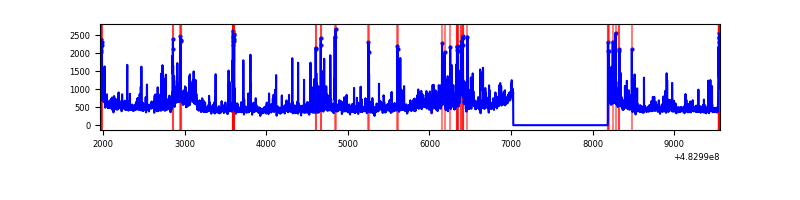 |
| C | 7598 | 6439 | 187 | 187 | 2.46% | 2.90% |  |
| D | 7598 | 6439 | 859 | 859 | 11.31% | 13.34% | 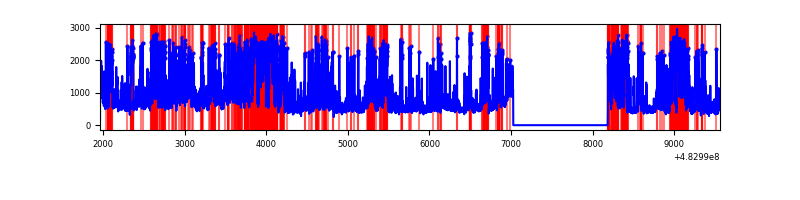 |
Top three noisy pixels from each quadrant. If the there are fewer than three noisy pixels in the level2.evt file, extra rows are filled as -1
| Pixel properties | Quadrant properties | ||||||
|---|---|---|---|---|---|---|---|
| Quadrant | DetID | PixID | Counts | Sigma | Mean | Median | Sigma |
| A | 4 | 175 | 374077 | 2082.79 | 723 | 706 | 179.3 |
| A | 11 | 3 | 297217 | 1654.04 | 723 | 706 | 179.3 |
| A | 4 | 3 | 158014 | 877.52 | 723 | 706 | 179.3 |
| B | 8 | 128 | 157662 | 1028.08 | 714 | 692 | 152.7 |
| B | 10 | 254 | 153305 | 999.54 | 714 | 692 | 152.7 |
| B | 4 | 174 | 98941 | 643.48 | 714 | 692 | 152.7 |
| C | 13 | 3 | 369929 | 1892.97 | 703 | 698 | 195.1 |
| C | 10 | 171 | 223952 | 1144.57 | 703 | 698 | 195.1 |
| C | 14 | 245 | 184009 | 939.79 | 703 | 698 | 195.1 |
| D | 11 | 129 | 3081571 | 16479.11 | 667 | 642 | 187.0 |
| D | 8 | 176 | 642944 | 3435.51 | 667 | 642 | 187.0 |
| D | 11 | 176 | 77478 | 410.98 | 667 | 642 | 187.0 |
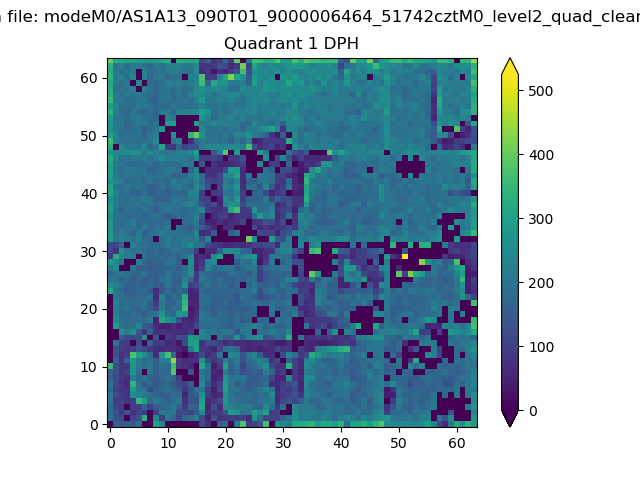
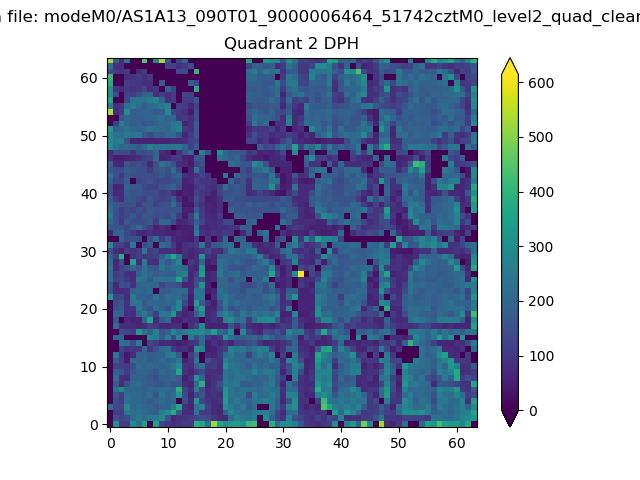
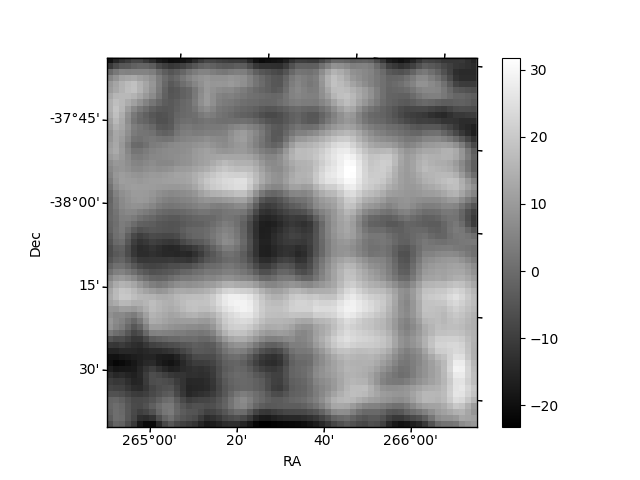
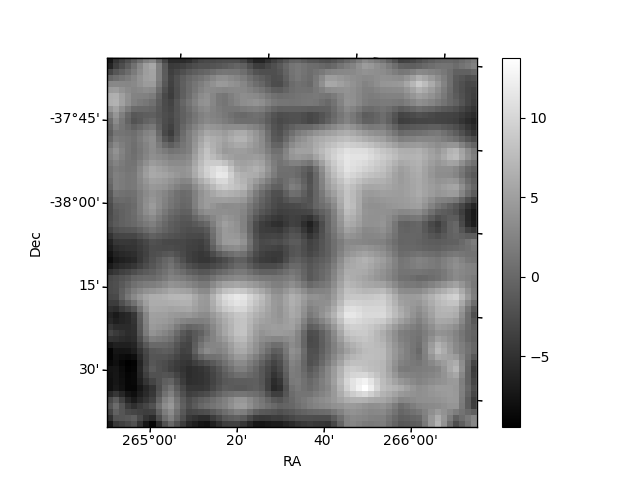
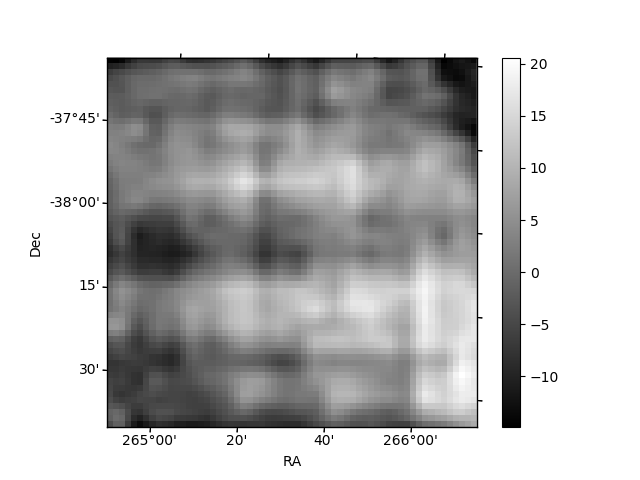
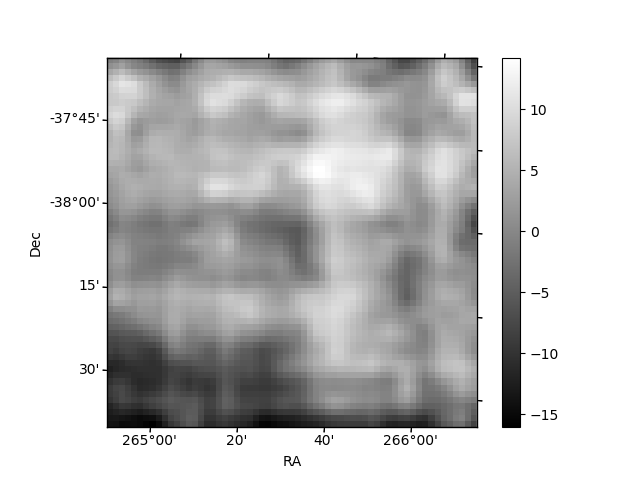
Histogram calculated using DETX and DETY for each event in the final _common_clean file
| Quadrant A | 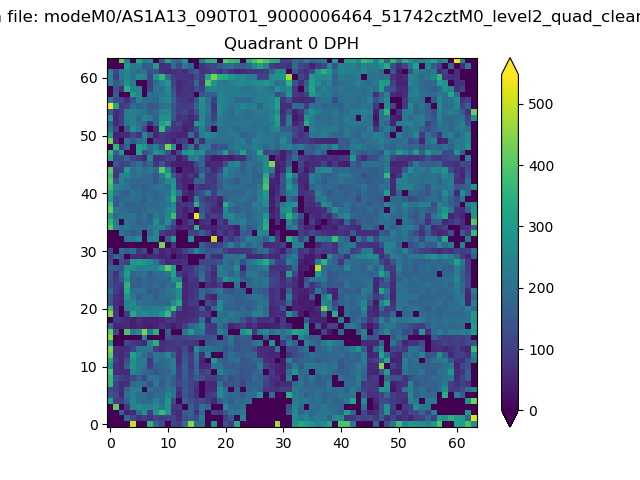 |
 |
Quadrant B |
|---|---|---|---|
| Quadrant D | 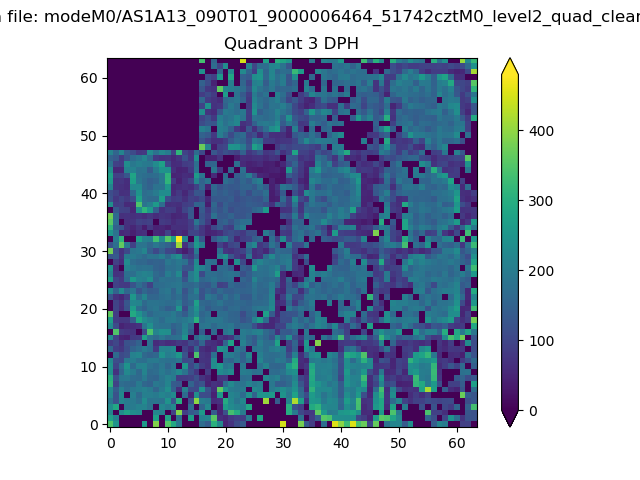 |
 |
Quadrant C |
| Plot type | Count rate plots | Images |
|---|---|---|
| Comparison with Poisson distribution Blue bars denote a histogram of data divided into 1 sec bins. Red curve is a Poisson curve with rate = median count rate of data. |
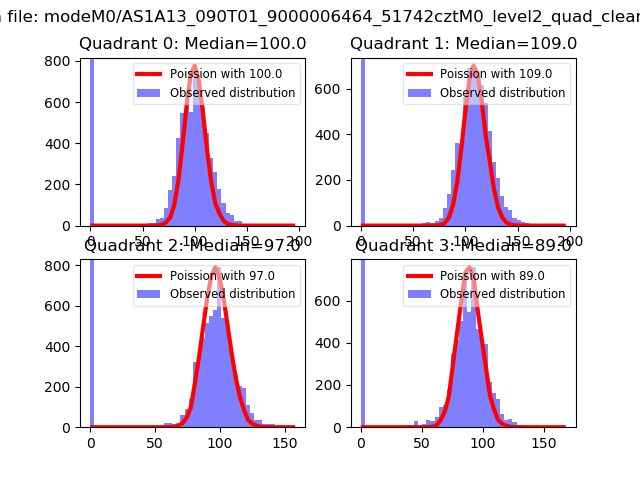 |
 |
| Quadrant-wise count rates Data is divided into 100 sec bins |
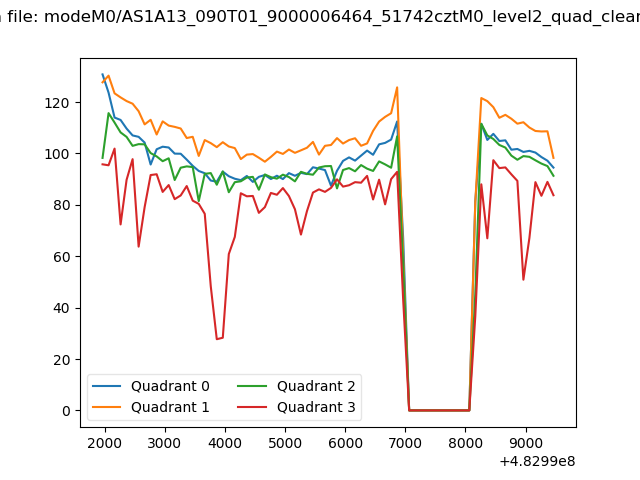 |
|
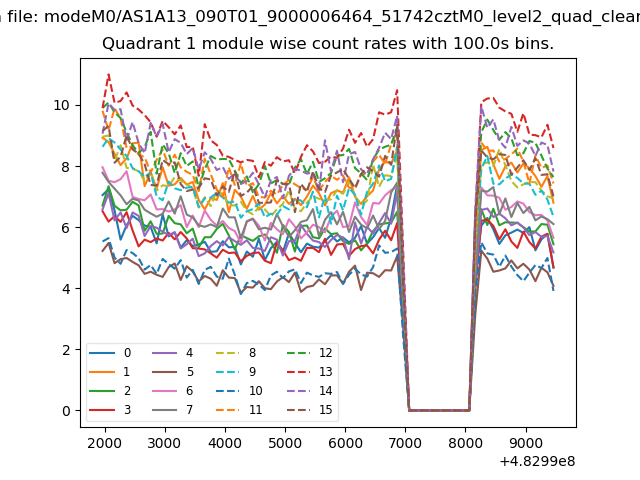
| Module-wise count rates for Quadrant A Data is divided into 100 sec bins |
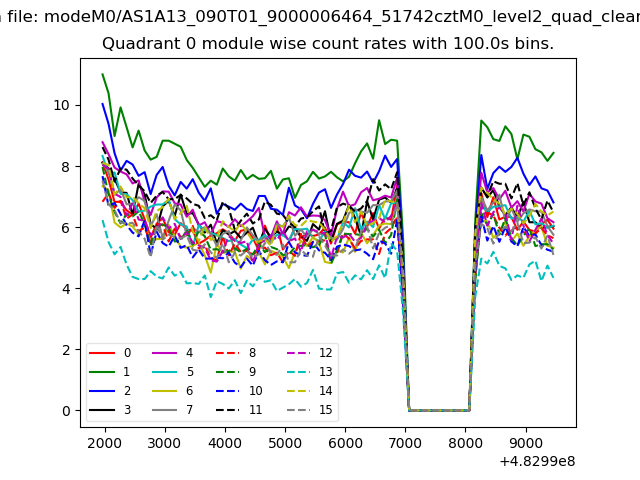 |
 |
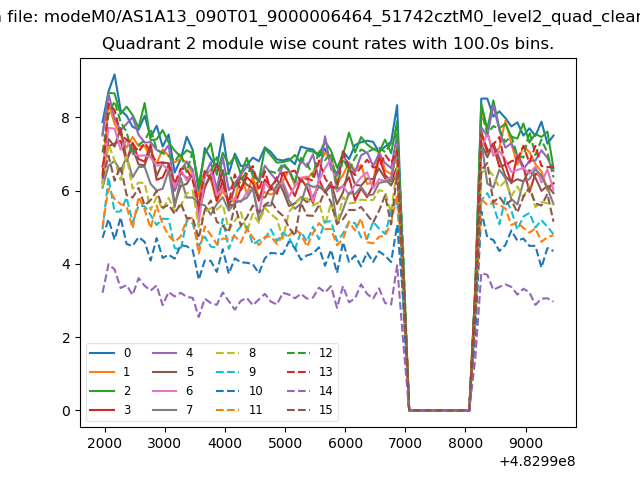
| Module-wise count rates for Quadrant B Data is divided into 100 sec bins |
 |
 |
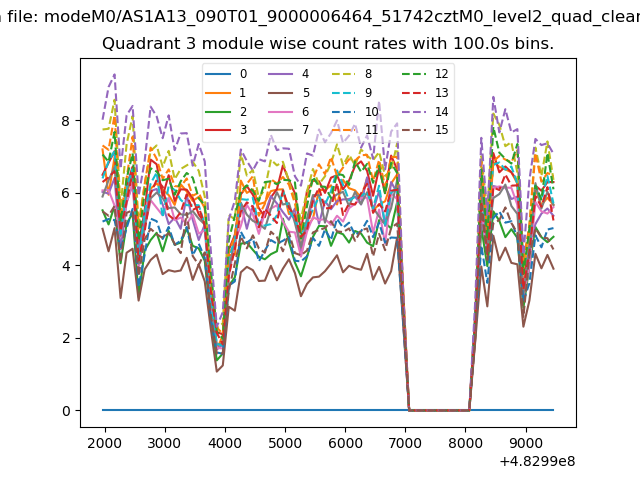
| Module-wise count rates for Quadrant C Data is divided into 100 sec bins |
 |
 |
| Module-wise count rates for Quadrant D Data is divided into 100 sec bins |
 |
 |
| Parameter | Plot |
|---|---|
| CZT HV Monitor | 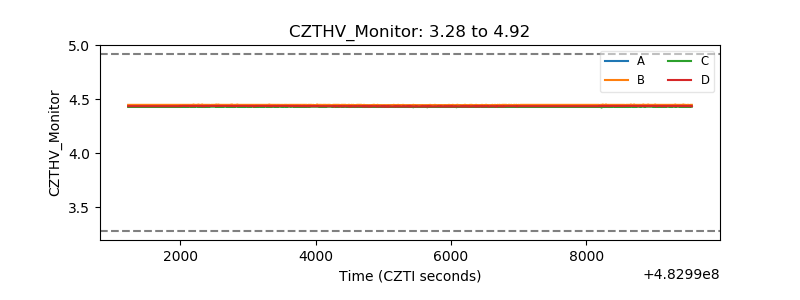 |
| D_VDD | 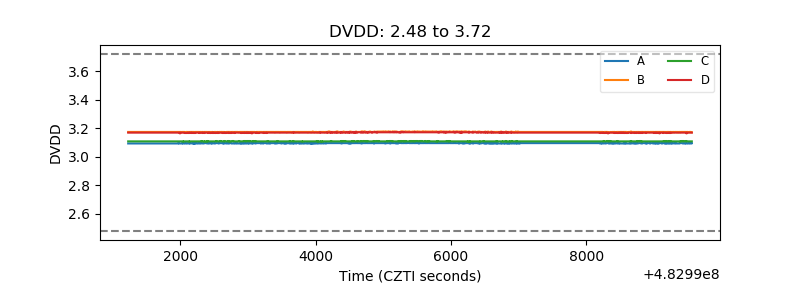 |
| Temperature 1 | 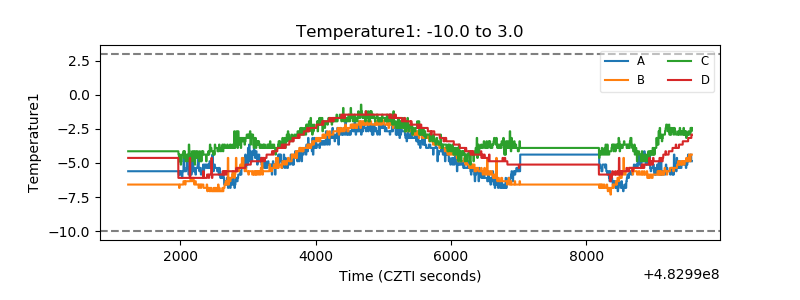 |
| Veto HV Monitor | 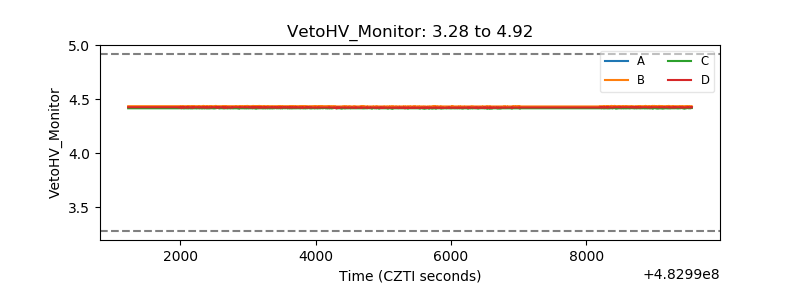 |
| Veto LLD | 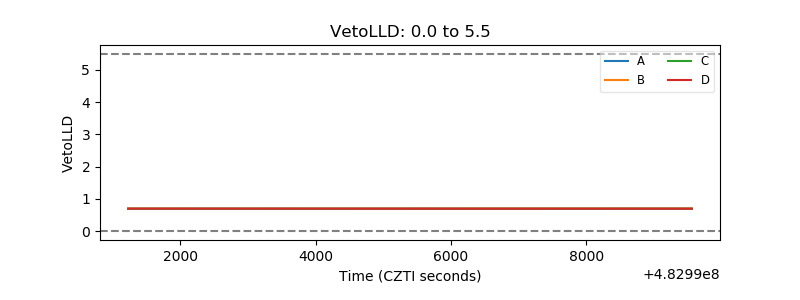 |
| Alpha Counter | 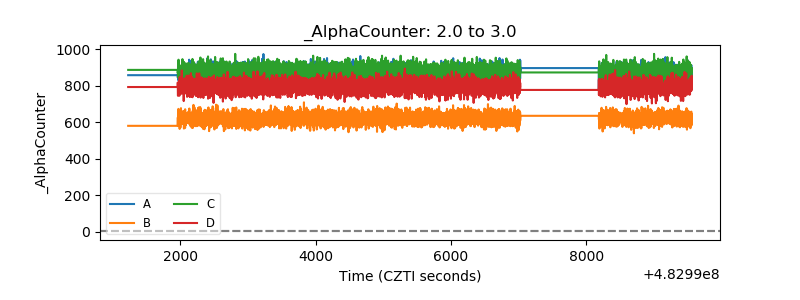 |
| _CPM_Rate | 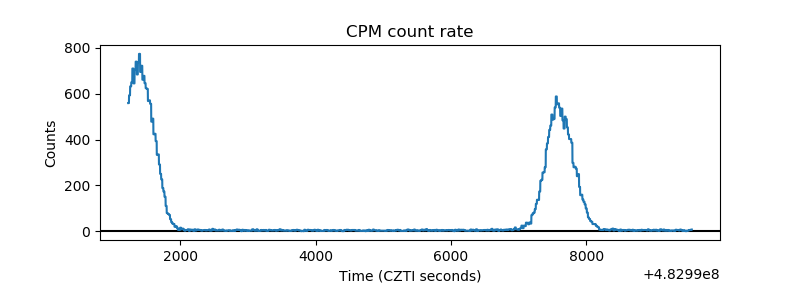 |
| CZT Counter |  |
| +2.5 Volts monitor | 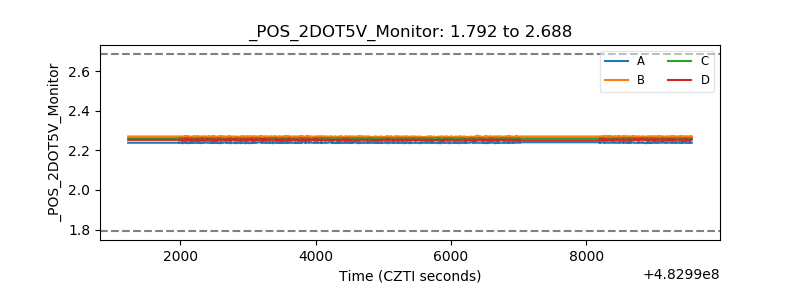 |
| +5 Volts monitor | 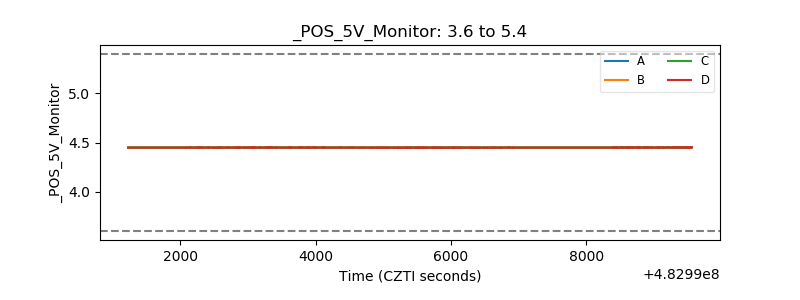 |
| _ROLL_ROT | 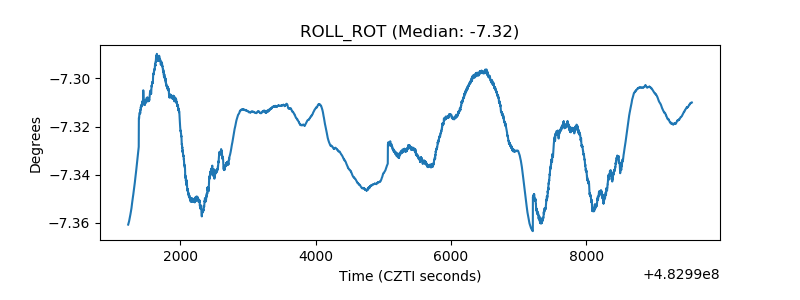 |
| _Roll_DEC | 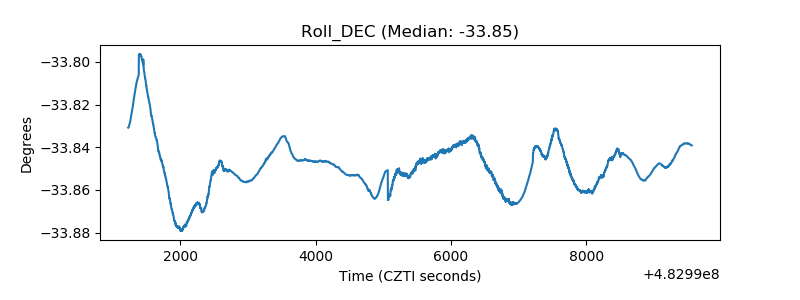 |
| _Roll_RA | 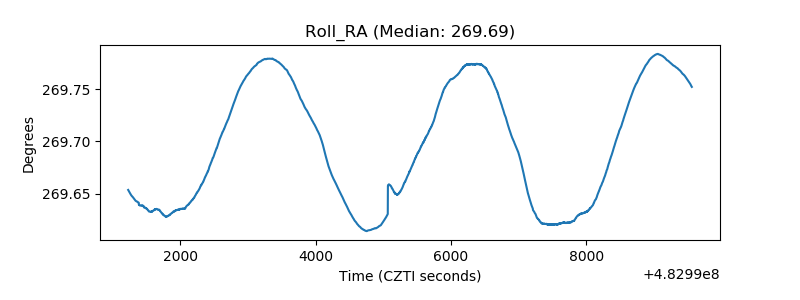 |
| Veto Counter | 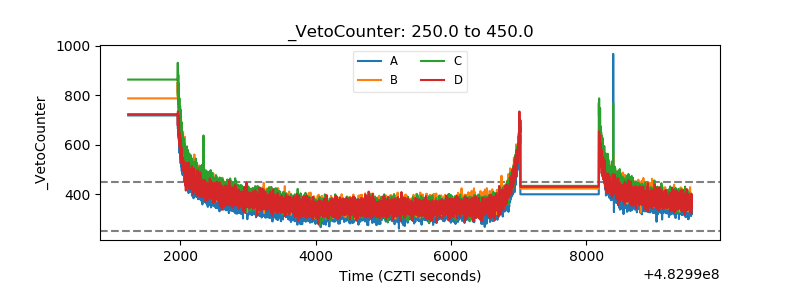 |