| Param | Original file | Final file |
|---|---|---|
| Filename | modeM0/AS1A13_090T01_9000006464_51743cztM0_level2.fits | modeM0/AS1A13_090T01_9000006464_51743cztM0_level2_quad_clean.evt |
| Size (bytes) | 587,229,120 | 93,461,760 |
| Size | 560.0 MB | 89.1 MB |
| Events in quadrant A | 5,119,460 | 612,587 |
| Events in quadrant B | 3,957,279 | 674,793 |
| Events in quadrant C | 5,780,057 | 582,716 |
| Events in quadrant D | 6,377,803 | 507,053 |
| Mode M9 | |||
|---|---|---|---|
| Quadrant | BADHDUFLAG | Total packets | Discarded packets |
| A | 0 | 14 | 0 |
| B | 0 | 15 | 0 |
| C | 0 | 15 | 0 |
| D | 0 | 15 | 0 |
| Mode SS | |||
|---|---|---|---|
| Quadrant | BADHDUFLAG | Total packets | Discarded packets |
| A | 0 | 132 | 0 |
| B | 0 | 132 | 0 |
| C | 0 | 132 | 0 |
| D | 0 | 132 | 0 |
| Mode M0 | |||
|---|---|---|---|
| Quadrant | BADHDUFLAG | Total packets | Discarded packets |
| A | 0 | 19667 | 2 |
| B | 0 | 16199 | 3 |
| C | 0 | 21631 | 2 |
| D | 0 | 23438 | 2 |
| Quadrant | Total seconds | Saturated seconds | Saturation percentage |
|---|---|---|---|
| A | 6491 | 373 | 5.746418% |
| B | 6490 | 287 | 4.422188% |
| C | 6490 | 541 | 8.335901% |
| D | 6490 | 986 | 15.192604% |
Noise dominated data is calculated using 1-second bins in cleaned event files. If a bin has >2000 counts, and if more than 50% of those come from <1% of pixels, then it is considered to be noise-dominated and hence unusable.
| Quadrant | # 1 sec bins | Bins with >0 counts | Bins with >2000 counts | High rate bins dominated by noise | Noise dominated (total time) | Noise dominated (detector-on time) | Marked lightcurve |
|---|---|---|---|---|---|---|---|
| A | 7506 | 6492 | 225 | 225 | 3.00% | 3.47% | 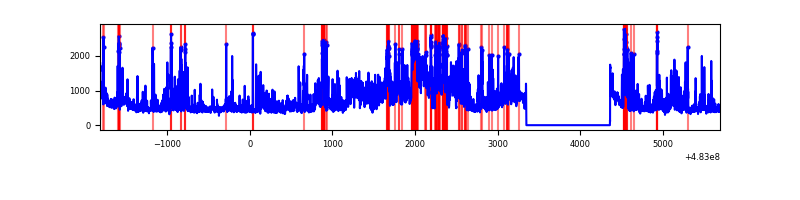 |
| B | 7505 | 6491 | 106 | 106 | 1.41% | 1.63% | 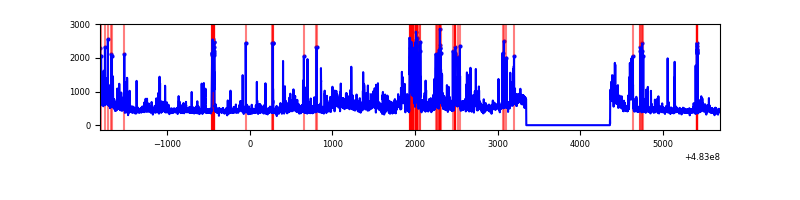 |
| C | 7505 | 6491 | 398 | 398 | 5.30% | 6.13% | 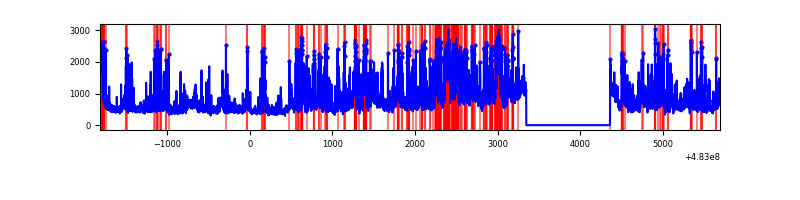 |
| D | 7505 | 6491 | 832 | 832 | 11.09% | 12.82% | 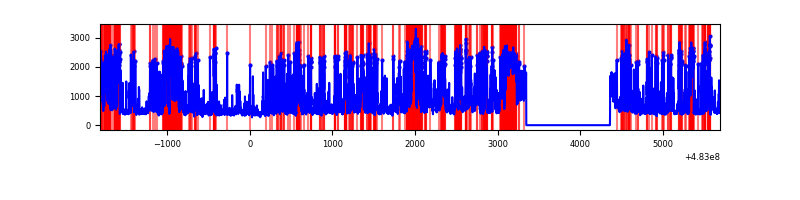 |
Top three noisy pixels from each quadrant. If the there are fewer than three noisy pixels in the level2.evt file, extra rows are filled as -1
| Pixel properties | Quadrant properties | ||||||
|---|---|---|---|---|---|---|---|
| Quadrant | DetID | PixID | Counts | Sigma | Mean | Median | Sigma |
| A | 4 | 175 | 754436 | 4200.94 | 727 | 708 | 179.4 |
| A | 12 | 3 | 486204 | 2705.93 | 727 | 708 | 179.4 |
| A | 11 | 3 | 266139 | 1479.39 | 727 | 708 | 179.4 |
| B | 1 | 223 | 176538 | 1138.94 | 719 | 696 | 154.4 |
| B | 5 | 32 | 132762 | 855.4 | 719 | 696 | 154.4 |
| B | 4 | 174 | 101664 | 653.98 | 719 | 696 | 154.4 |
| C | 10 | 171 | 1120322 | 5826.84 | 699 | 694 | 192.2 |
| C | 13 | 3 | 418590 | 2174.84 | 699 | 694 | 192.2 |
| C | 15 | 230 | 394578 | 2049.87 | 699 | 694 | 192.2 |
| D | 11 | 129 | 3233483 | 17343.22 | 672 | 649 | 186.4 |
| D | 11 | 176 | 74909 | 398.38 | 672 | 649 | 186.4 |
| D | 2 | 249 | 71297 | 379.01 | 672 | 649 | 186.4 |
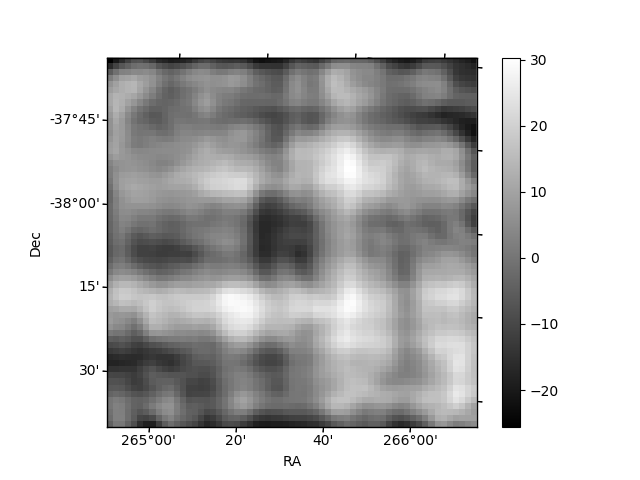
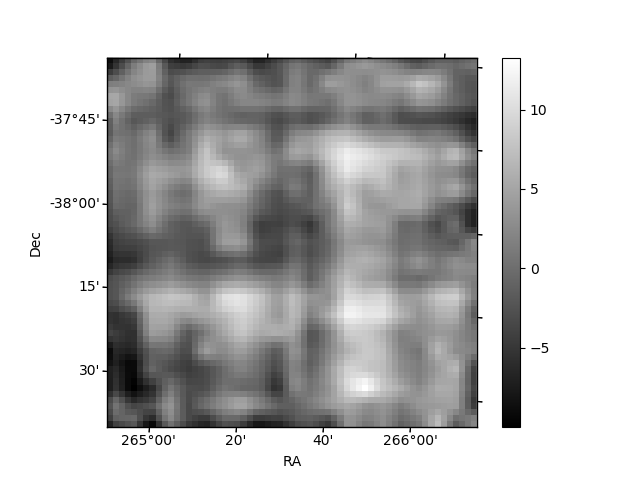
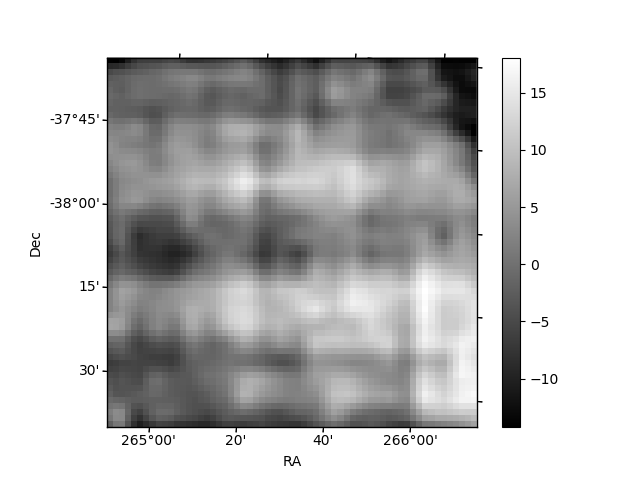
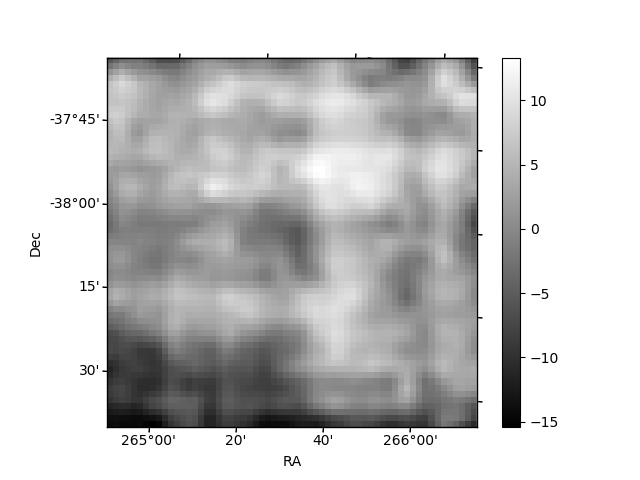
Histogram calculated using DETX and DETY for each event in the final _common_clean file
| Quadrant A | 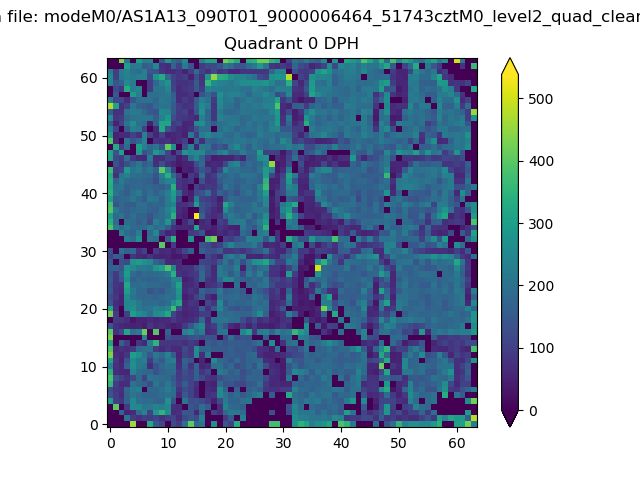 |
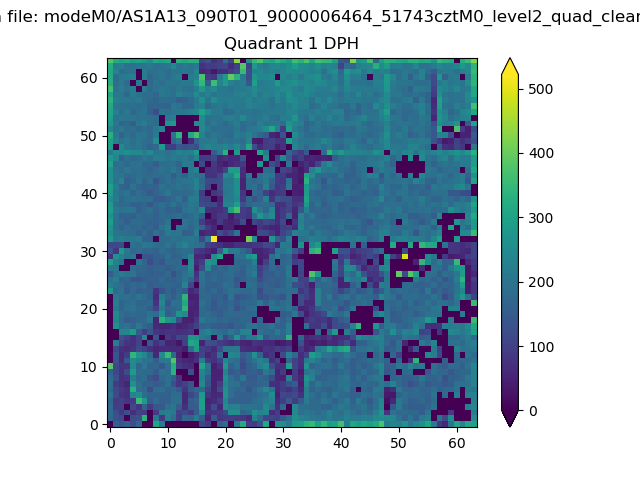 |
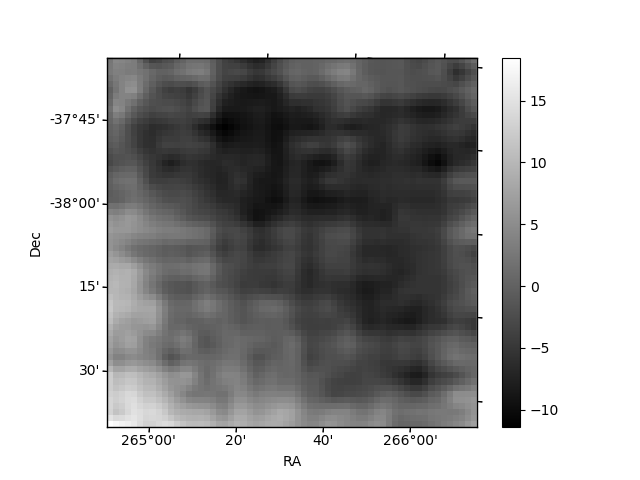
Quadrant B |
|---|---|---|---|
| Quadrant D | 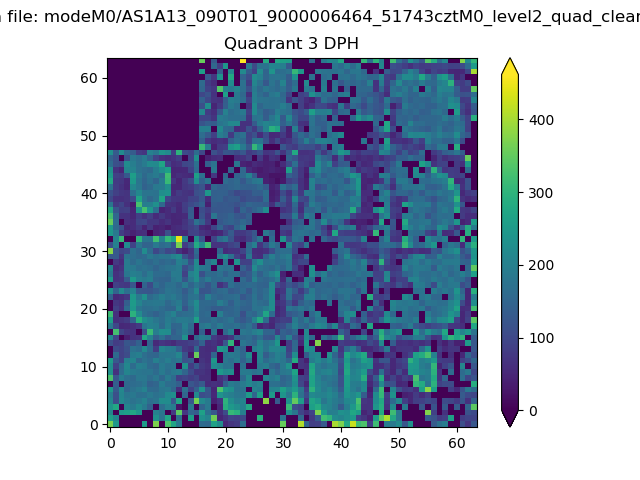 |
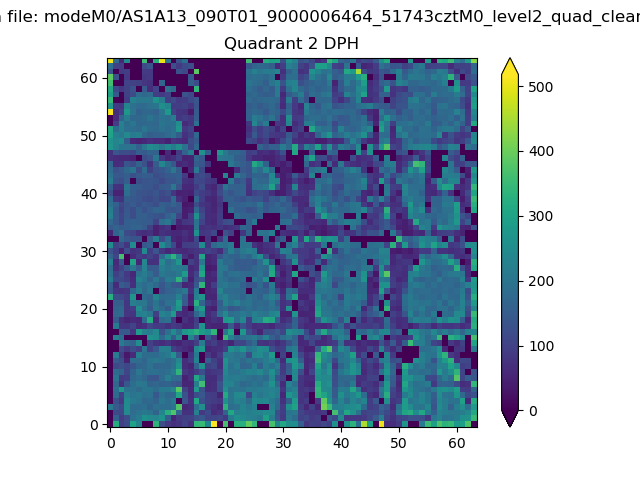 |
Quadrant C |
| Plot type | Count rate plots | Images |
|---|---|---|
| Comparison with Poisson distribution Blue bars denote a histogram of data divided into 1 sec bins. Red curve is a Poisson curve with rate = median count rate of data. |
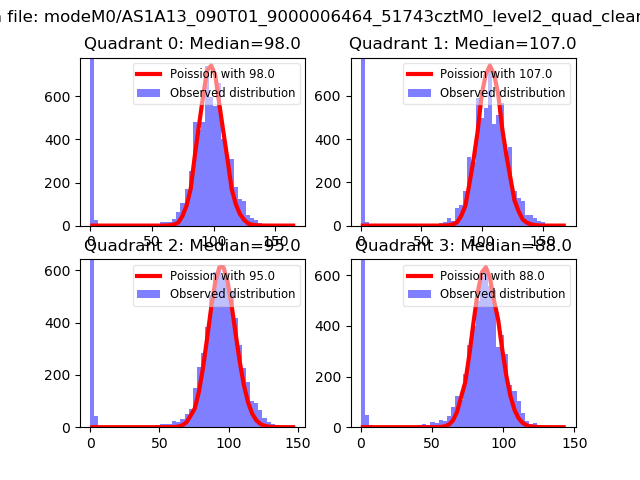 |
 |
| Quadrant-wise count rates Data is divided into 100 sec bins |
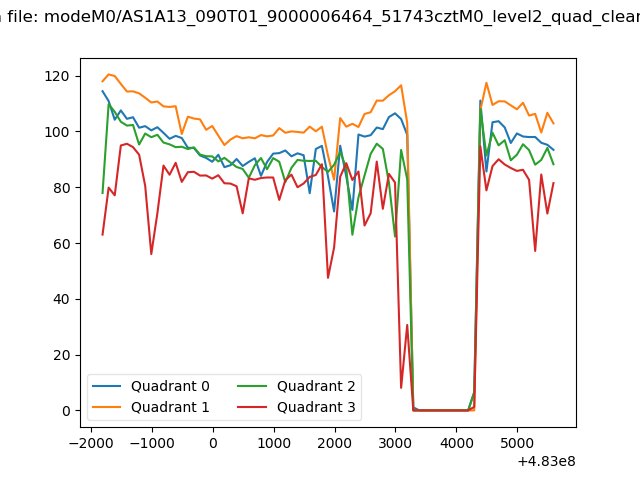 |
|
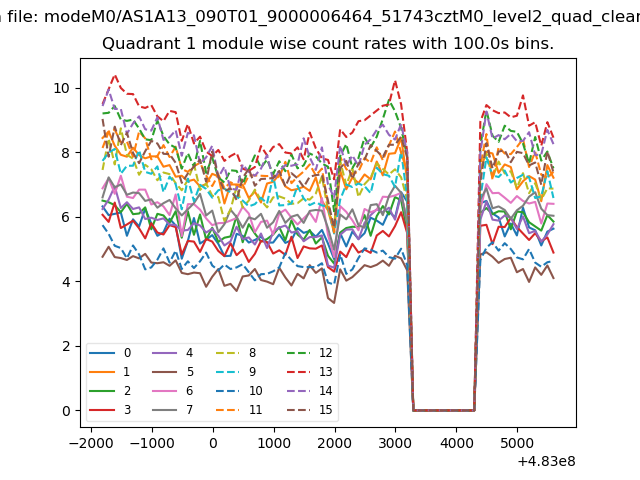
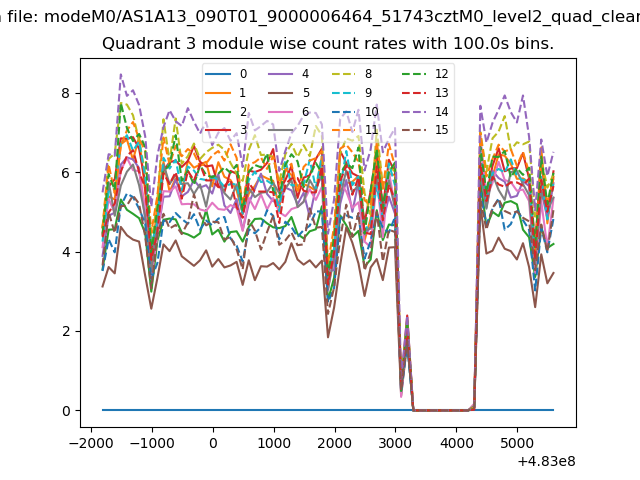
| Module-wise count rates for Quadrant A Data is divided into 100 sec bins |
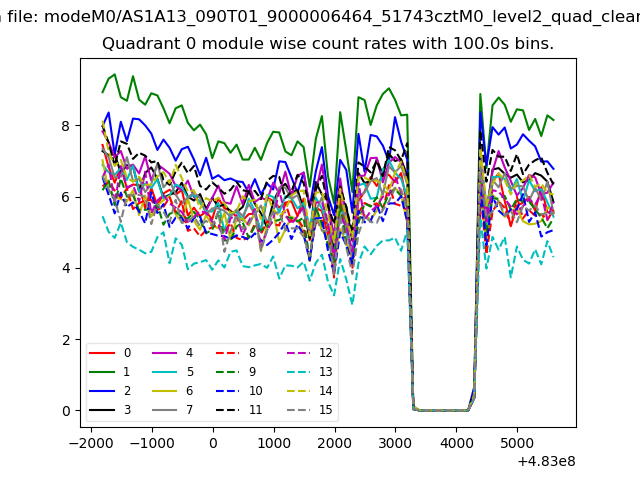 |
 |
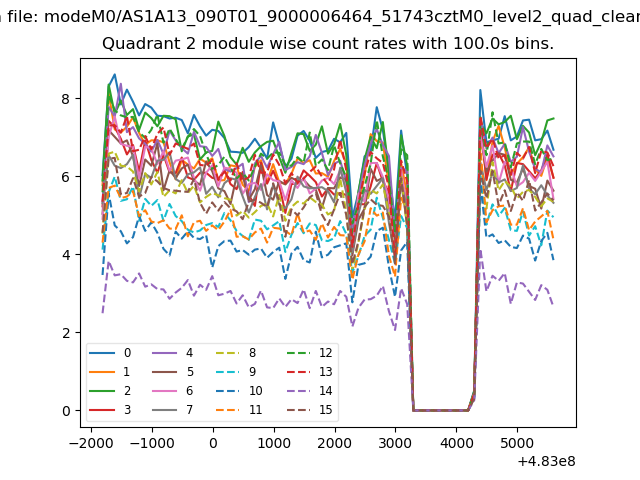
| Module-wise count rates for Quadrant B Data is divided into 100 sec bins |
 |
 |
| Module-wise count rates for Quadrant C Data is divided into 100 sec bins |
 |
 |
| Module-wise count rates for Quadrant D Data is divided into 100 sec bins |
 |
 |
| Parameter | Plot |
|---|---|
| CZT HV Monitor | 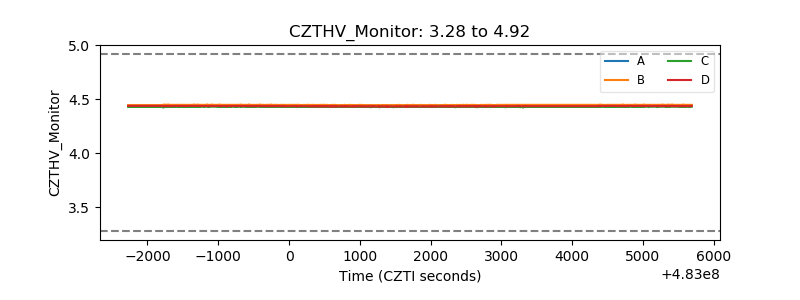 |
| D_VDD | 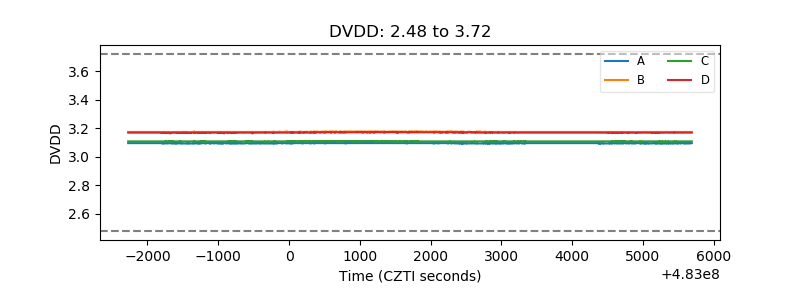 |
| Temperature 1 | 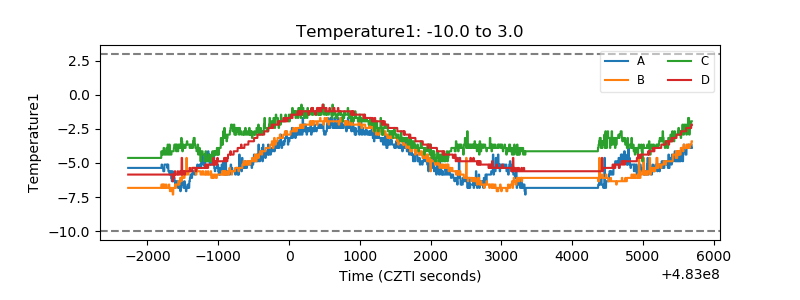 |
| Veto HV Monitor | 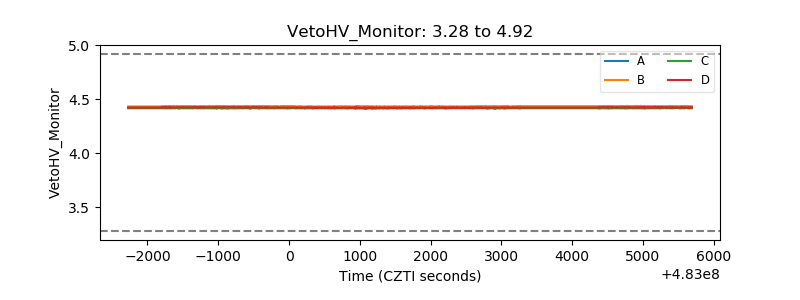 |
| Veto LLD | 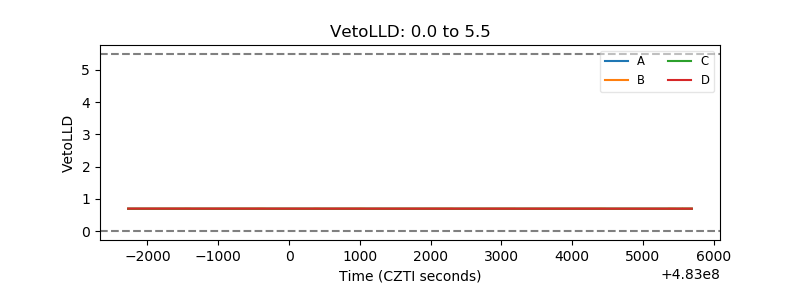 |
| Alpha Counter | 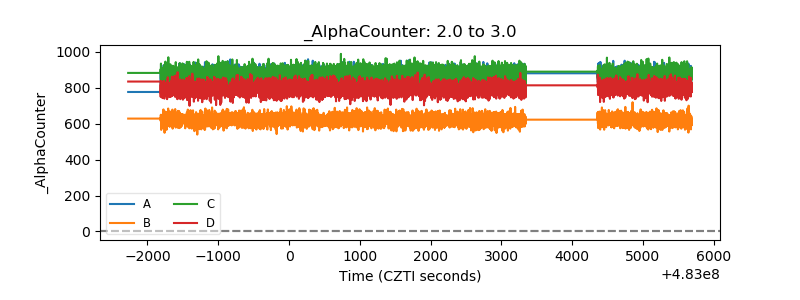 |
| _CPM_Rate | 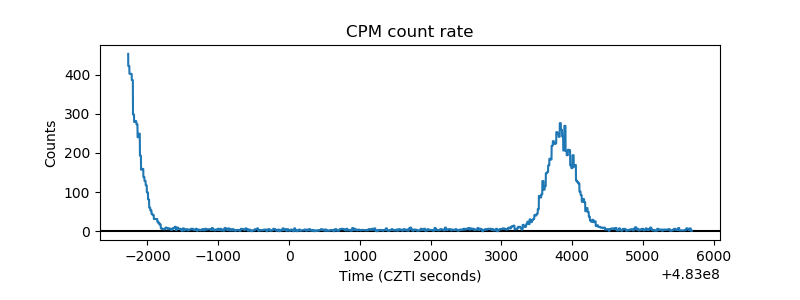 |
| CZT Counter | 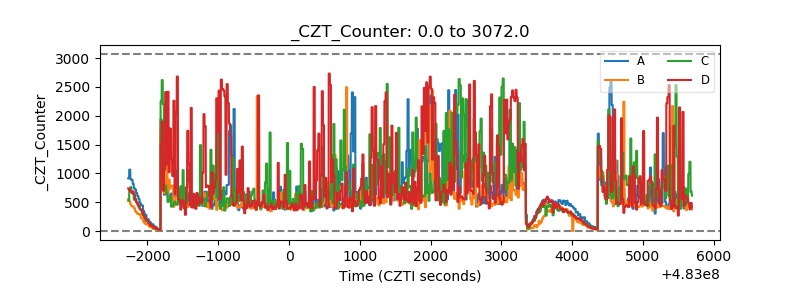 |
| +2.5 Volts monitor | 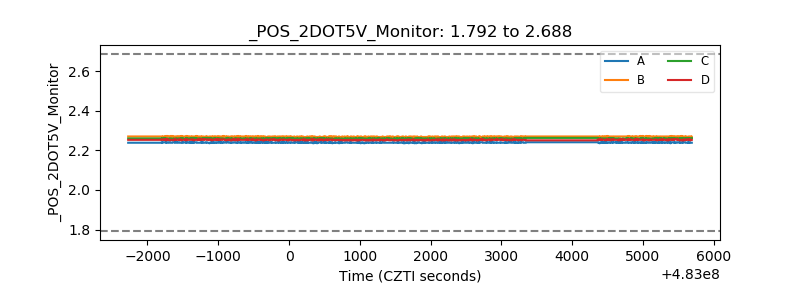 |
| +5 Volts monitor | 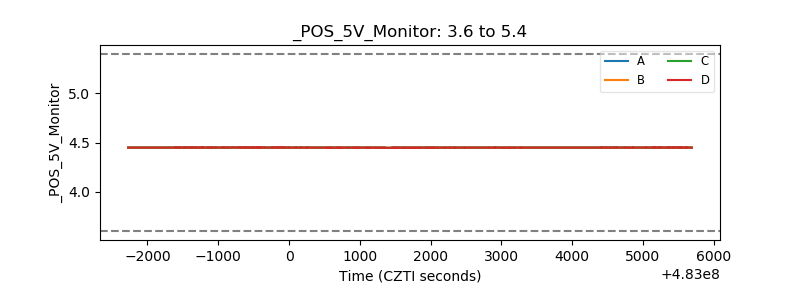 |
| _ROLL_ROT | 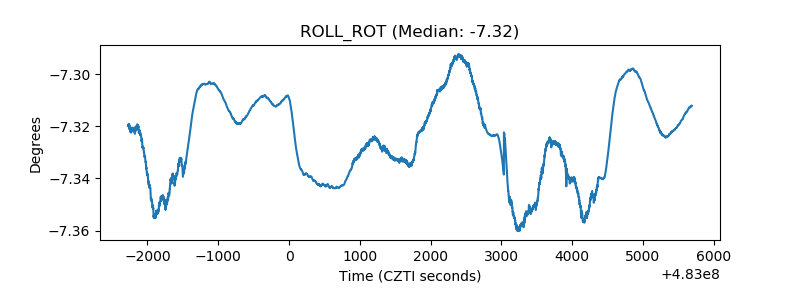 |
| _Roll_DEC | 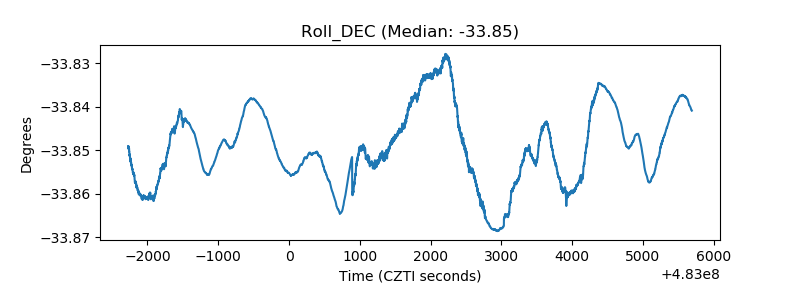 |
| _Roll_RA | 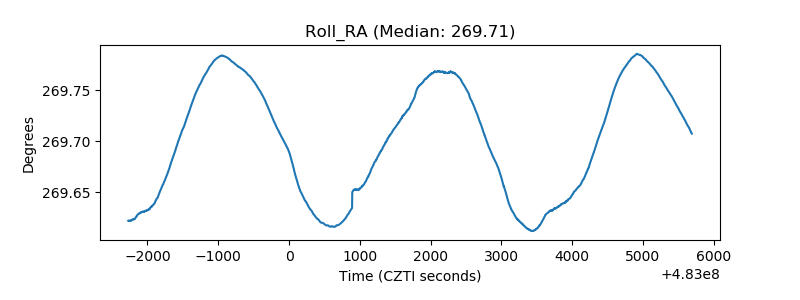 |
| Veto Counter | 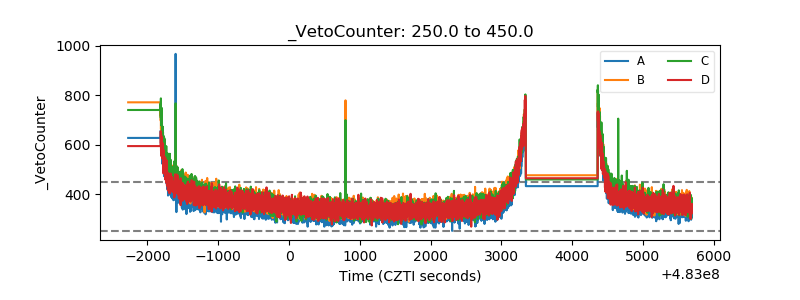 |