| Param | Original file | Final file |
|---|---|---|
| Filename | modeM0/AS1A13_090T01_9000006464_51744cztM0_level2.fits | modeM0/AS1A13_090T01_9000006464_51744cztM0_level2_quad_clean.evt |
| Size (bytes) | 589,746,240 | 95,578,560 |
| Size | 562.4 MB | 91.2 MB |
| Events in quadrant A | 4,194,707 | 628,397 |
| Events in quadrant B | 4,087,550 | 677,539 |
| Events in quadrant C | 6,523,828 | 593,936 |
| Events in quadrant D | 6,498,402 | 521,083 |
| Mode M9 | |||
|---|---|---|---|
| Quadrant | BADHDUFLAG | Total packets | Discarded packets |
| A | 0 | 10 | 0 |
| B | 0 | 11 | 0 |
| C | 0 | 11 | 0 |
| D | 0 | 11 | 0 |
| Mode SS | |||
|---|---|---|---|
| Quadrant | BADHDUFLAG | Total packets | Discarded packets |
| A | 0 | 138 | 0 |
| B | 0 | 138 | 0 |
| C | 0 | 138 | 0 |
| D | 0 | 138 | 0 |
| Mode M0 | |||
|---|---|---|---|
| Quadrant | BADHDUFLAG | Total packets | Discarded packets |
| A | 0 | 16985 | 2 |
| B | 0 | 16782 | 2 |
| C | 0 | 24095 | 8 |
| D | 0 | 23959 | 2 |
| Quadrant | Total seconds | Saturated seconds | Saturation percentage |
|---|---|---|---|
| A | 6788 | 298 | 4.390100% |
| B | 6788 | 369 | 5.436064% |
| C | 6787 | 577 | 8.501547% |
| D | 6787 | 999 | 14.719316% |
Noise dominated data is calculated using 1-second bins in cleaned event files. If a bin has >2000 counts, and if more than 50% of those come from <1% of pixels, then it is considered to be noise-dominated and hence unusable.
| Quadrant | # 1 sec bins | Bins with >0 counts | Bins with >2000 counts | High rate bins dominated by noise | Noise dominated (total time) | Noise dominated (detector-on time) | Marked lightcurve |
|---|---|---|---|---|---|---|---|
| A | 7613 | 6789 | 97 | 97 | 1.27% | 1.43% | 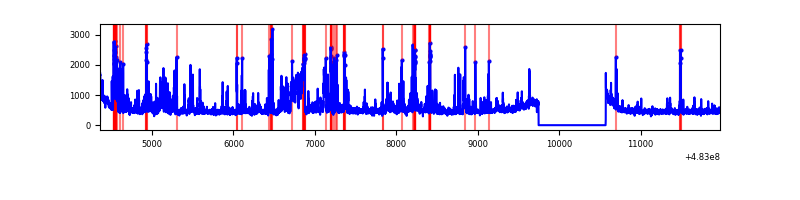 |
| B | 7613 | 6789 | 88 | 88 | 1.16% | 1.30% | 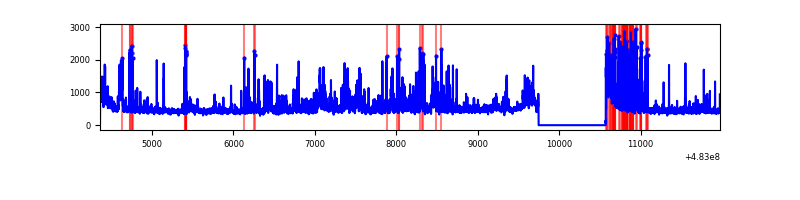 |
| C | 7612 | 6788 | 362 | 362 | 4.76% | 5.33% | 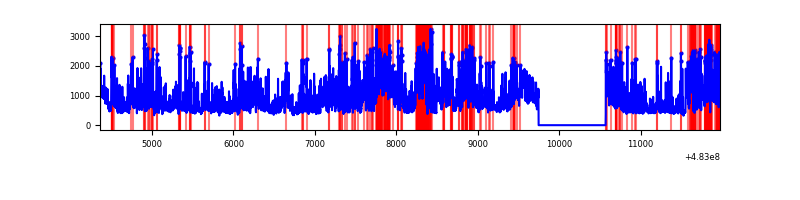 |
| D | 7612 | 6788 | 807 | 807 | 10.60% | 11.89% | 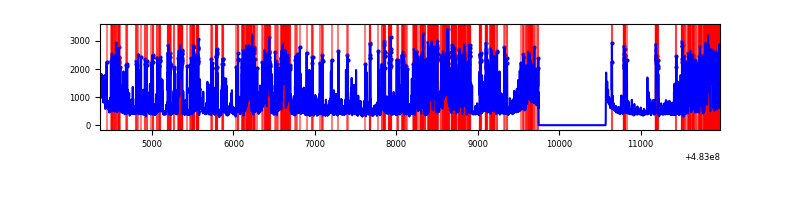 |
Top three noisy pixels from each quadrant. If the there are fewer than three noisy pixels in the level2.evt file, extra rows are filled as -1
| Pixel properties | Quadrant properties | ||||||
|---|---|---|---|---|---|---|---|
| Quadrant | DetID | PixID | Counts | Sigma | Mean | Median | Sigma |
| A | 4 | 175 | 372598 | 2000.04 | 759 | 739 | 185.9 |
| A | 11 | 3 | 187454 | 1004.25 | 759 | 739 | 185.9 |
| A | 5 | 240 | 106803 | 570.47 | 759 | 739 | 185.9 |
| B | 7 | 0 | 346437 | 2144.45 | 742 | 714 | 161.2 |
| B | 1 | 223 | 117165 | 722.32 | 742 | 714 | 161.2 |
| B | 5 | 32 | 113532 | 699.79 | 742 | 714 | 161.2 |
| C | 10 | 171 | 1831521 | 9154.71 | 729 | 721 | 200.0 |
| C | 13 | 3 | 457604 | 2284.59 | 729 | 721 | 200.0 |
| C | 9 | 38 | 250230 | 1247.64 | 729 | 721 | 200.0 |
| D | 11 | 129 | 3245415 | 16708.99 | 698 | 672 | 194.2 |
| D | 1 | 3 | 162055 | 831.05 | 698 | 672 | 194.2 |
| D | 8 | 176 | 111052 | 568.41 | 698 | 672 | 194.2 |
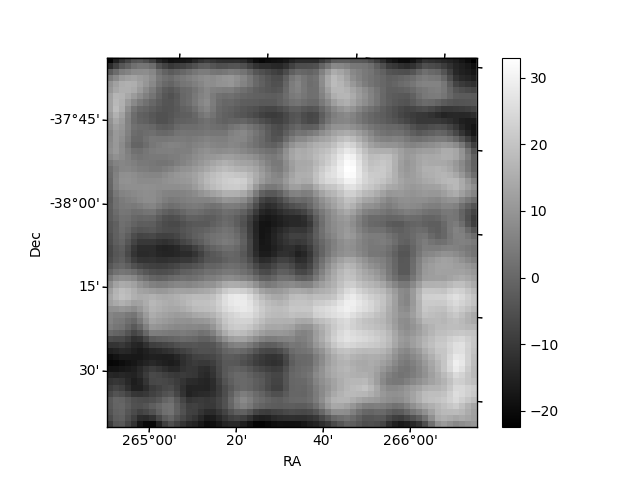
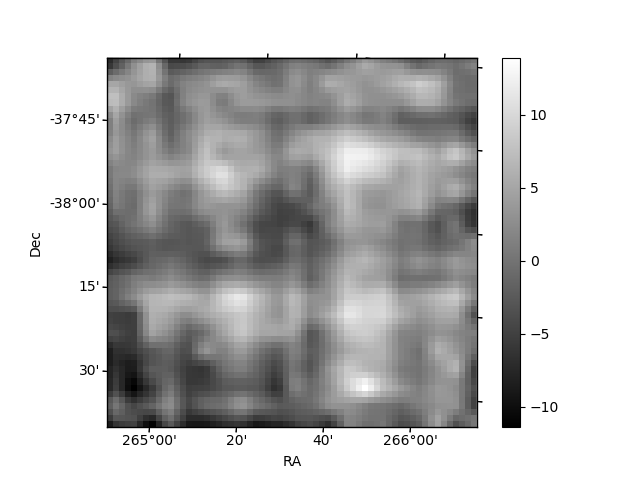
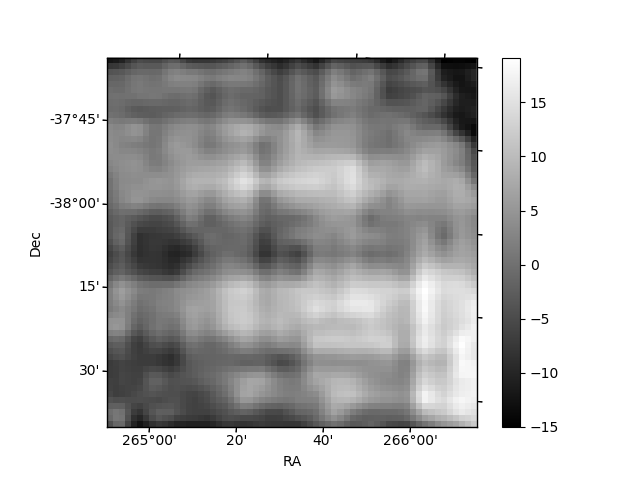
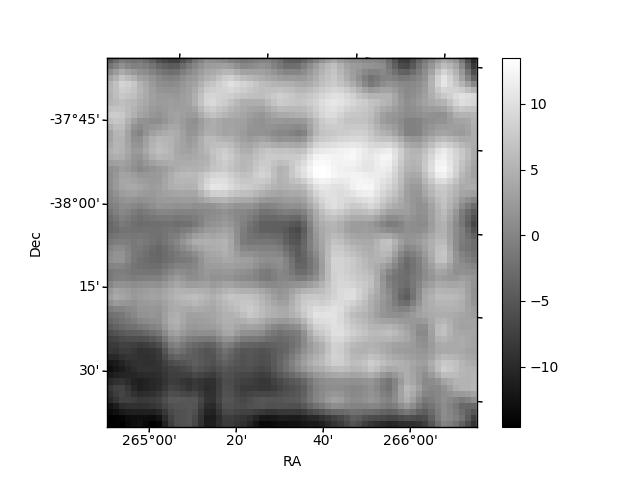
Histogram calculated using DETX and DETY for each event in the final _common_clean file
| Quadrant A | 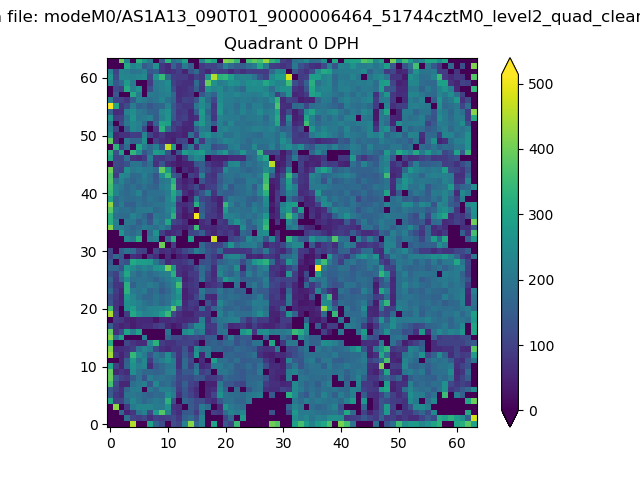 |
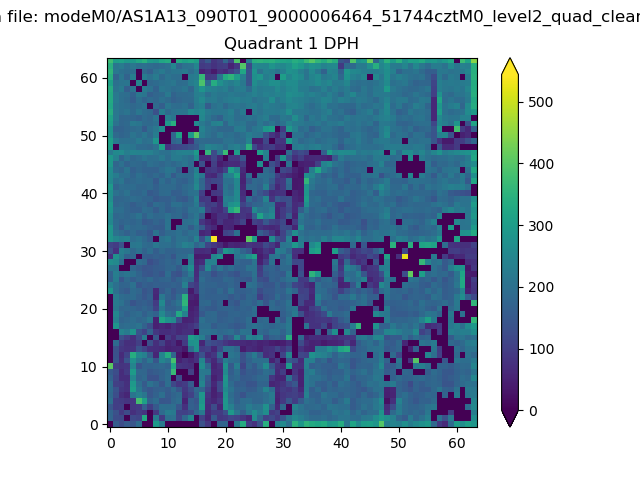 |
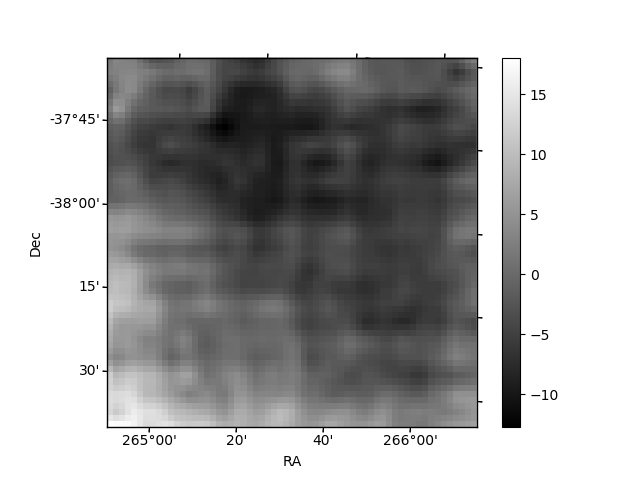
Quadrant B |
|---|---|---|---|
| Quadrant D | 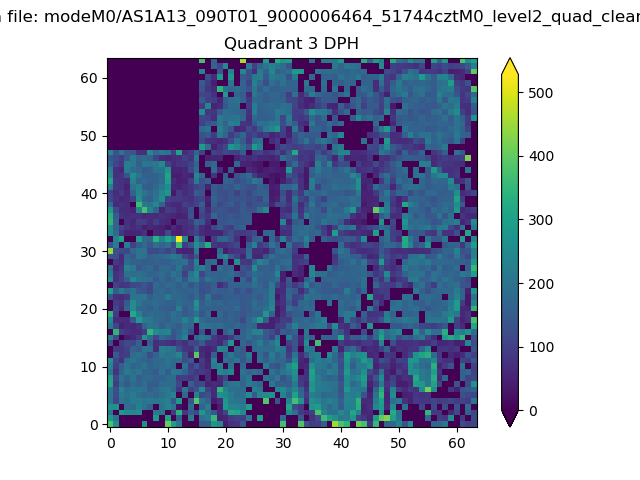 |
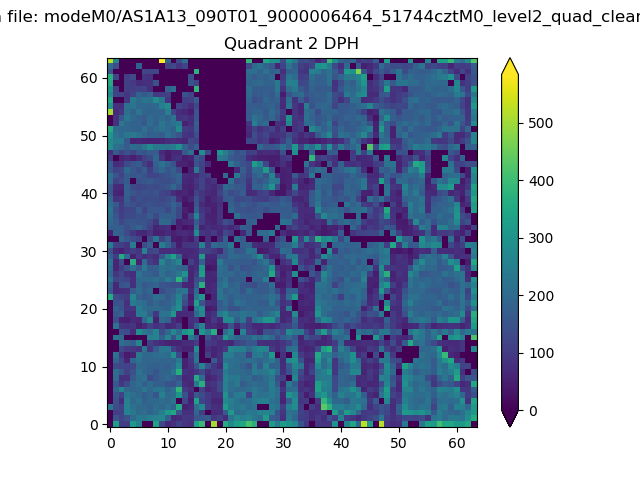 |
Quadrant C |
| Plot type | Count rate plots | Images |
|---|---|---|
| Comparison with Poisson distribution Blue bars denote a histogram of data divided into 1 sec bins. Red curve is a Poisson curve with rate = median count rate of data. |
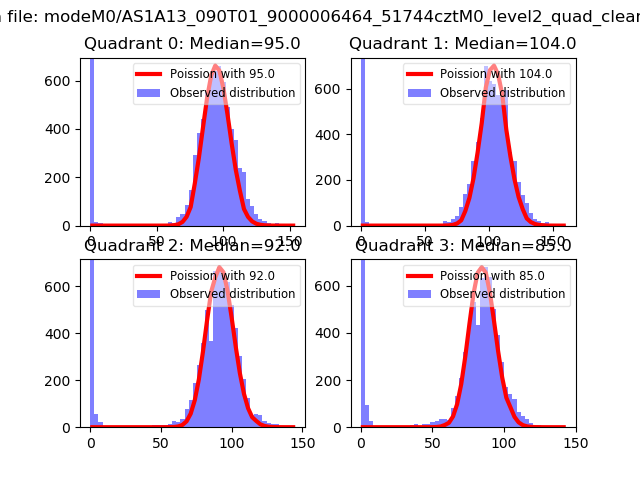 |
 |
| Quadrant-wise count rates Data is divided into 100 sec bins |
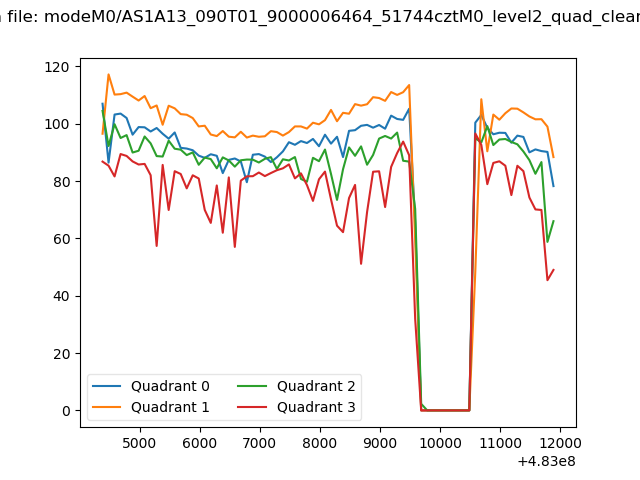 |
|
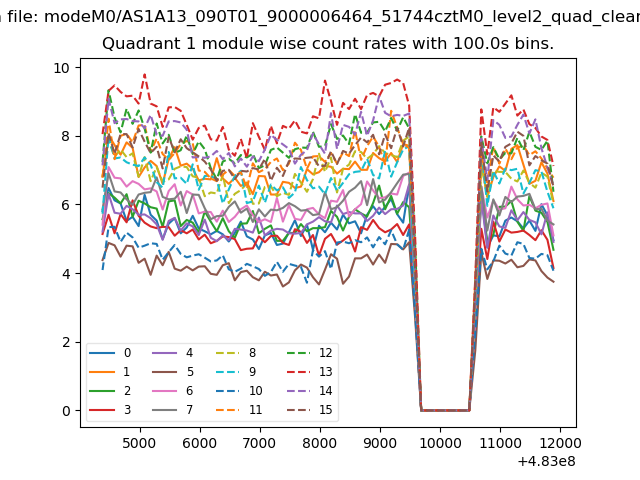
| Module-wise count rates for Quadrant A Data is divided into 100 sec bins |
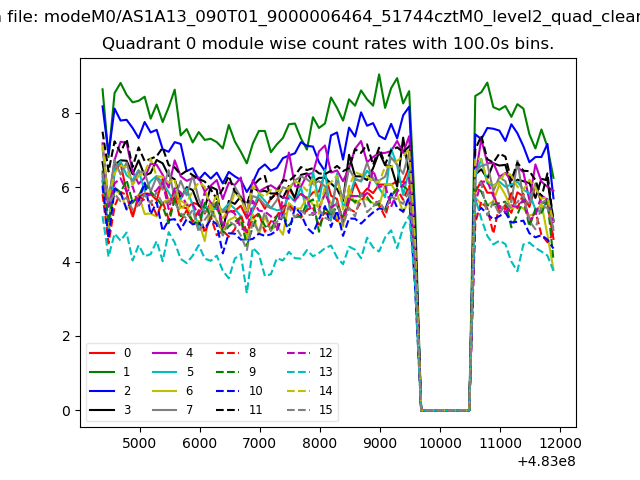 |
 |
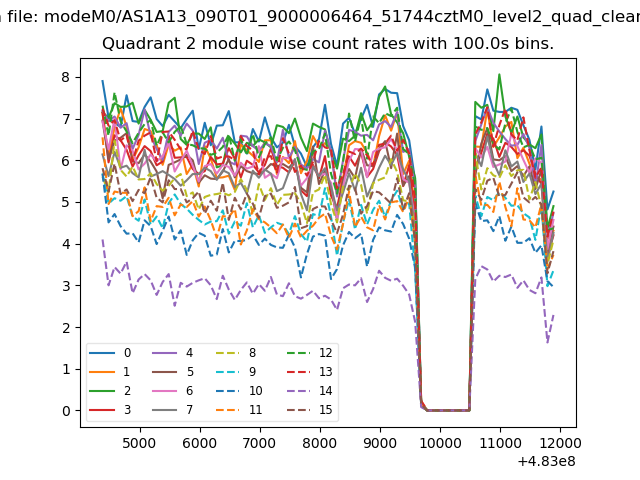
| Module-wise count rates for Quadrant B Data is divided into 100 sec bins |
 |
 |
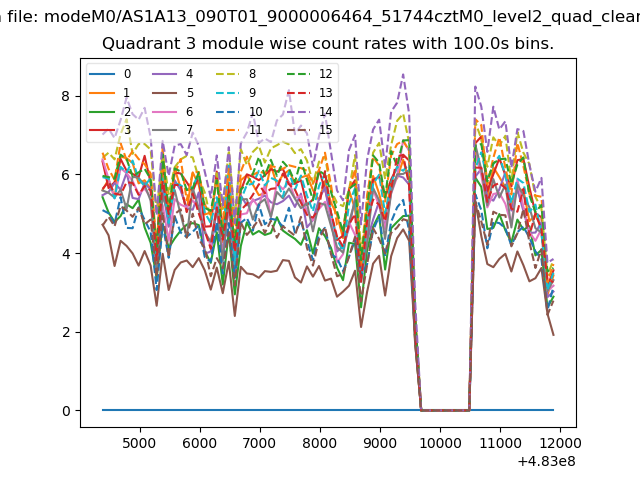
| Module-wise count rates for Quadrant C Data is divided into 100 sec bins |
 |
 |
| Module-wise count rates for Quadrant D Data is divided into 100 sec bins |
 |
 |
| Parameter | Plot |
|---|---|
| CZT HV Monitor | 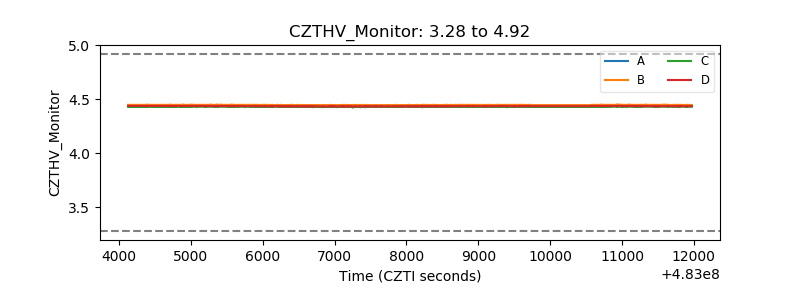 |
| D_VDD | 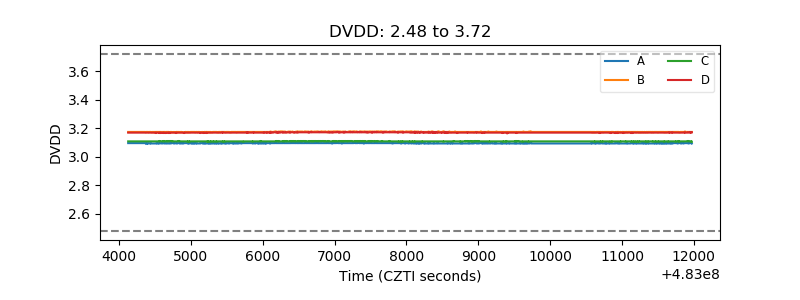 |
| Temperature 1 | 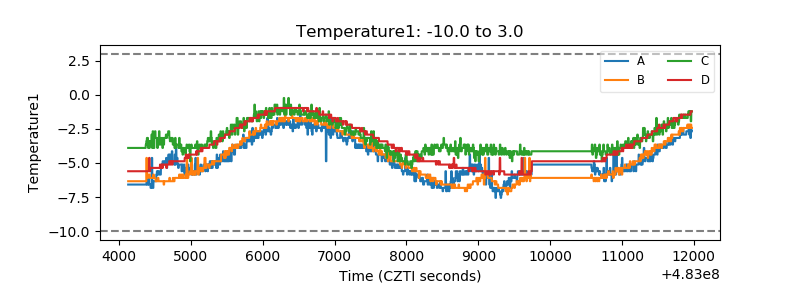 |
| Veto HV Monitor | 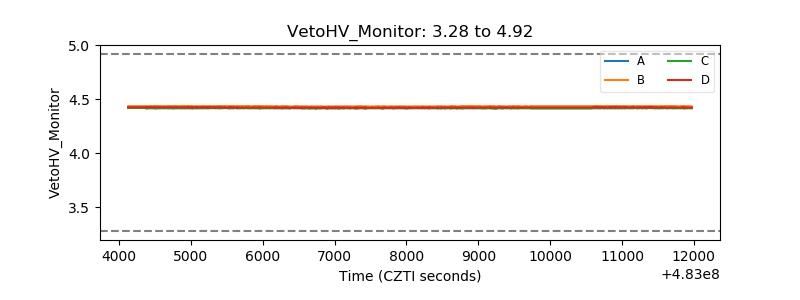 |
| Veto LLD | 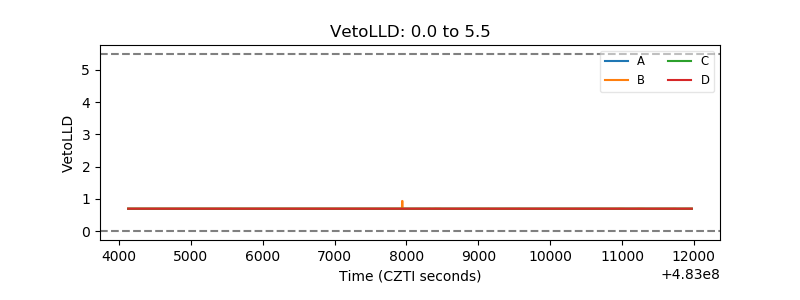 |
| Alpha Counter | 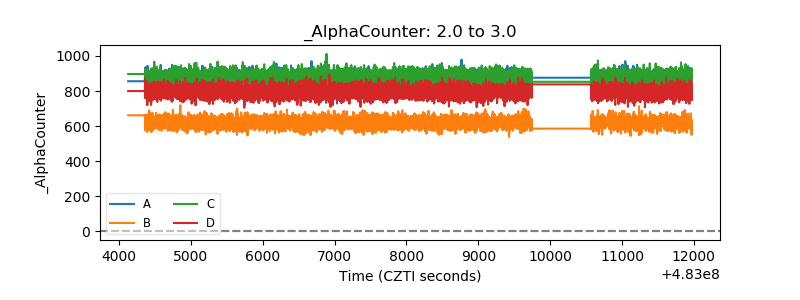 |
| _CPM_Rate | 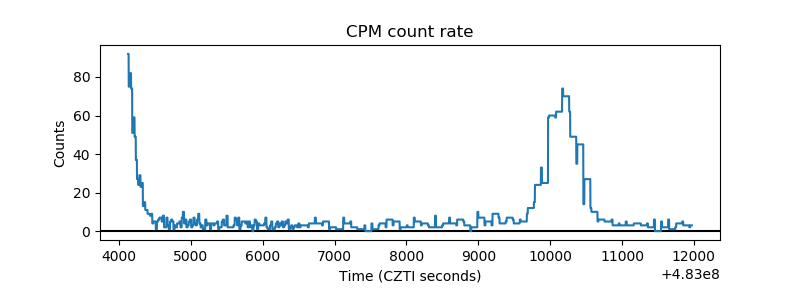 |
| CZT Counter | 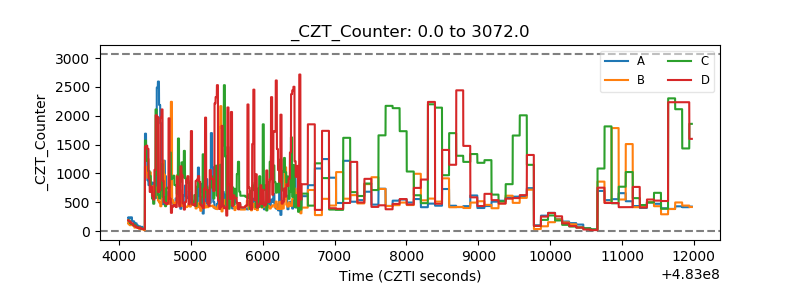 |
| +2.5 Volts monitor | 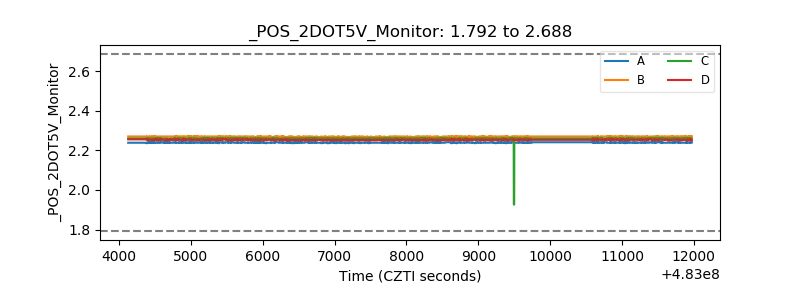 |
| +5 Volts monitor | 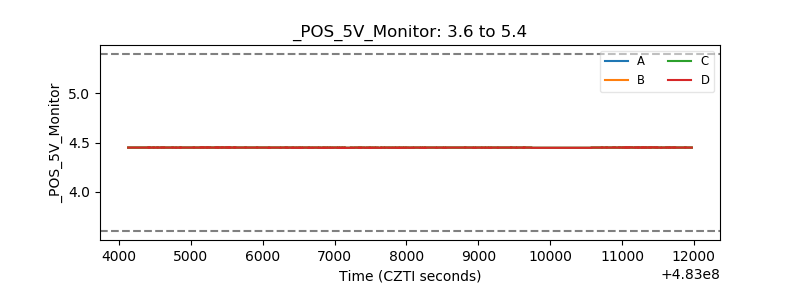 |
| _ROLL_ROT | 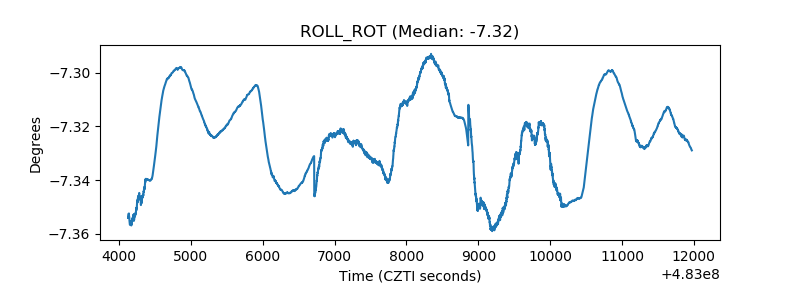 |
| _Roll_DEC | 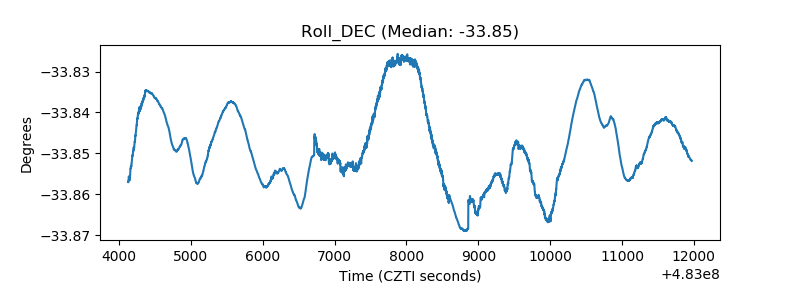 |
| _Roll_RA | 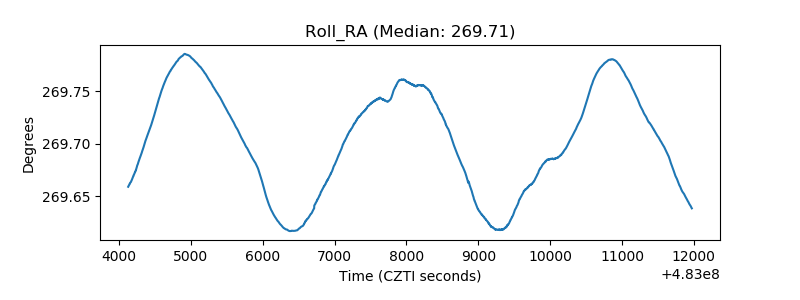 |
| Veto Counter | 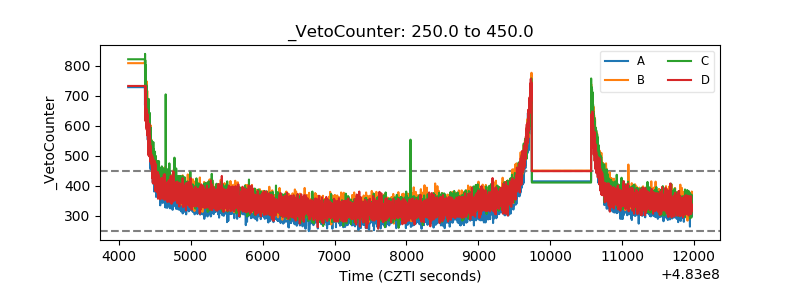 |