| Param | Original file | Final file |
|---|---|---|
| Filename | modeM0/AS1A13_090T01_9000006464_51745cztM0_level2.fits | modeM0/AS1A13_090T01_9000006464_51745cztM0_level2_quad_clean.evt |
| Size (bytes) | 737,101,440 | 104,091,840 |
| Size | 703.0 MB | 99.3 MB |
| Events in quadrant A | 4,732,383 | 699,592 |
| Events in quadrant B | 4,845,546 | 745,718 |
| Events in quadrant C | 8,672,808 | 618,472 |
| Events in quadrant D | 8,438,230 | 551,720 |
| Mode M9 | |||
|---|---|---|---|
| Quadrant | BADHDUFLAG | Total packets | Discarded packets |
| A | 0 | 3 | 0 |
| B | 0 | 3 | 0 |
| C | 0 | 3 | 0 |
| D | 0 | 3 | 0 |
| Mode SS | |||
|---|---|---|---|
| Quadrant | BADHDUFLAG | Total packets | Discarded packets |
| A | 0 | 158 | 0 |
| B | 0 | 158 | 0 |
| C | 0 | 158 | 0 |
| D | 0 | 158 | 0 |
| Mode M0 | |||
|---|---|---|---|
| Quadrant | BADHDUFLAG | Total packets | Discarded packets |
| A | 0 | 19273 | 2 |
| B | 0 | 19603 | 2 |
| C | 0 | 31054 | 2 |
| D | 0 | 30361 | 2 |
| Quadrant | Total seconds | Saturated seconds | Saturation percentage |
|---|---|---|---|
| A | 7699 | 341 | 4.429147% |
| B | 7700 | 483 | 6.272727% |
| C | 7700 | 1208 | 15.688312% |
| D | 7700 | 1529 | 19.857143% |
Noise dominated data is calculated using 1-second bins in cleaned event files. If a bin has >2000 counts, and if more than 50% of those come from <1% of pixels, then it is considered to be noise-dominated and hence unusable.
| Quadrant | # 1 sec bins | Bins with >0 counts | Bins with >2000 counts | High rate bins dominated by noise | Noise dominated (total time) | Noise dominated (detector-on time) | Marked lightcurve |
|---|---|---|---|---|---|---|---|
| A | 8069 | 7700 | 66 | 66 | 0.82% | 0.86% | 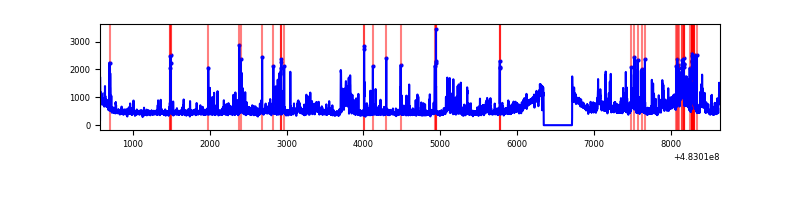 |
| B | 8070 | 7701 | 118 | 118 | 1.46% | 1.53% | 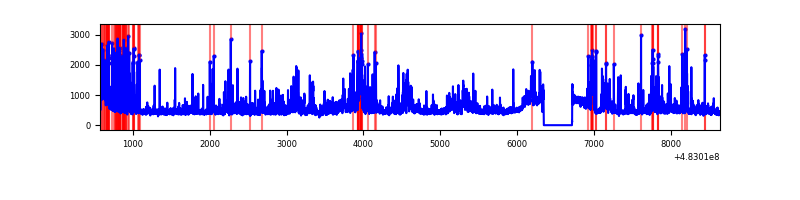 |
| C | 8070 | 7701 | 1059 | 1059 | 13.12% | 13.75% | 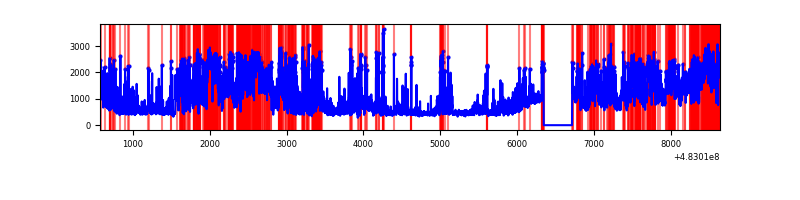 |
| D | 8070 | 7701 | 1248 | 1248 | 15.46% | 16.21% | 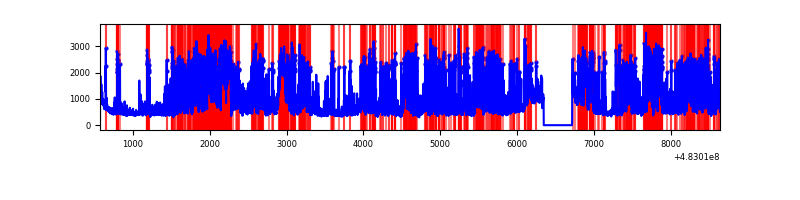 |
Top three noisy pixels from each quadrant. If the there are fewer than three noisy pixels in the level2.evt file, extra rows are filled as -1
| Pixel properties | Quadrant properties | ||||||
|---|---|---|---|---|---|---|---|
| Quadrant | DetID | PixID | Counts | Sigma | Mean | Median | Sigma |
| A | 4 | 175 | 417221 | 1983.16 | 865 | 843 | 210.0 |
| A | 5 | 240 | 115702 | 547.06 | 865 | 843 | 210.0 |
| A | 12 | 3 | 112550 | 532.05 | 865 | 843 | 210.0 |
| B | 7 | 0 | 320655 | 1730.08 | 844 | 811 | 184.9 |
| B | 5 | 32 | 216976 | 1169.27 | 844 | 811 | 184.9 |
| B | 1 | 223 | 174194 | 937.85 | 844 | 811 | 184.9 |
| C | 10 | 171 | 3208679 | 14363.51 | 812 | 805 | 223.3 |
| C | 9 | 38 | 512239 | 2289.99 | 812 | 805 | 223.3 |
| C | 13 | 3 | 398774 | 1781.94 | 812 | 805 | 223.3 |
| D | 11 | 129 | 4299979 | 19663.11 | 790 | 761 | 218.6 |
| D | 8 | 176 | 478615 | 2185.54 | 790 | 761 | 218.6 |
| D | 11 | 176 | 172668 | 786.24 | 790 | 761 | 218.6 |
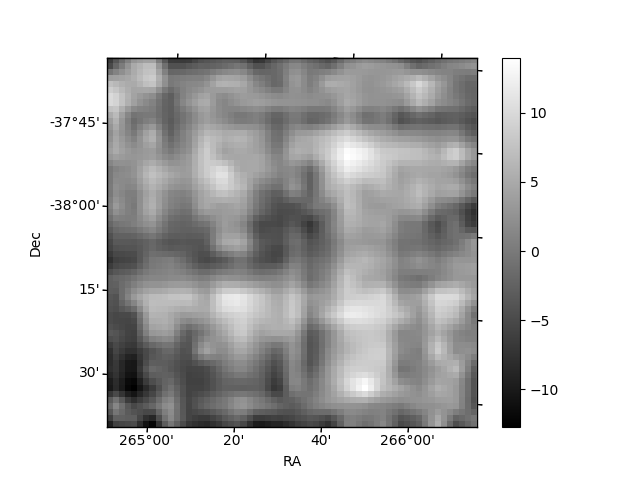
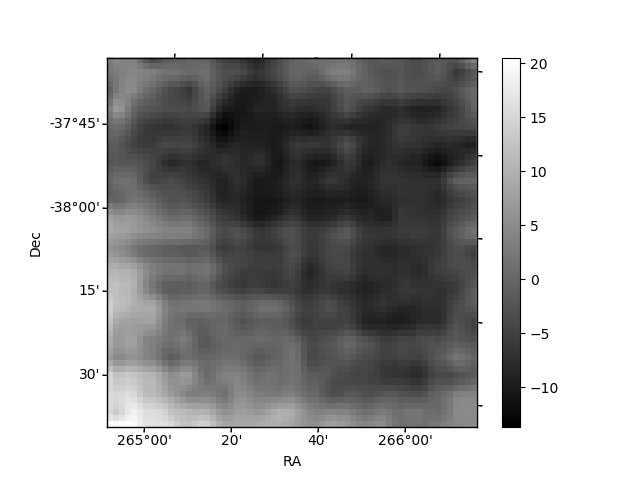
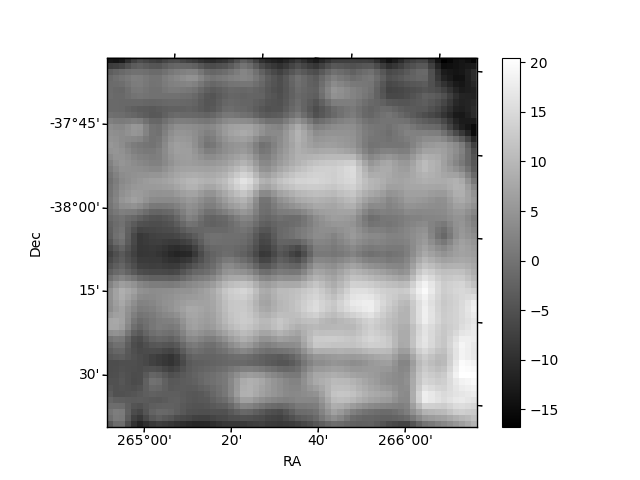
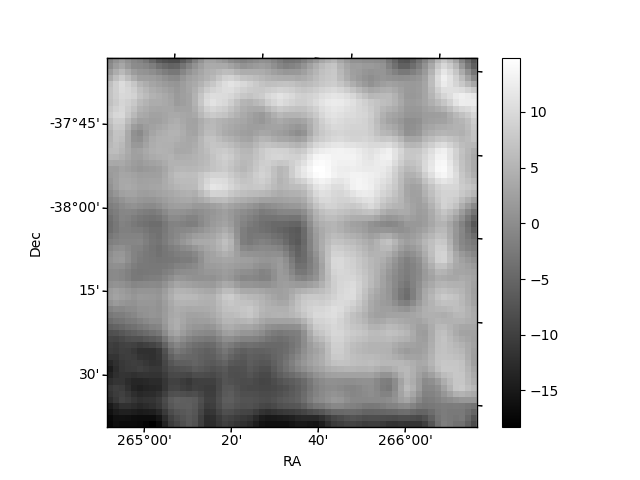
Histogram calculated using DETX and DETY for each event in the final _common_clean file
| Quadrant A | 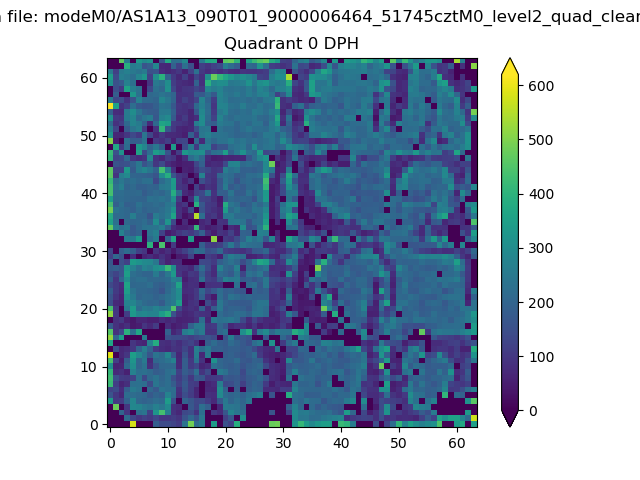 |
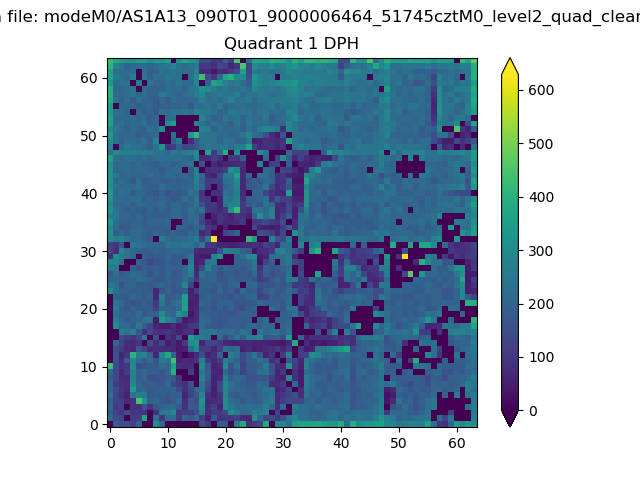 |
Quadrant B |
|---|---|---|---|
| Quadrant D | 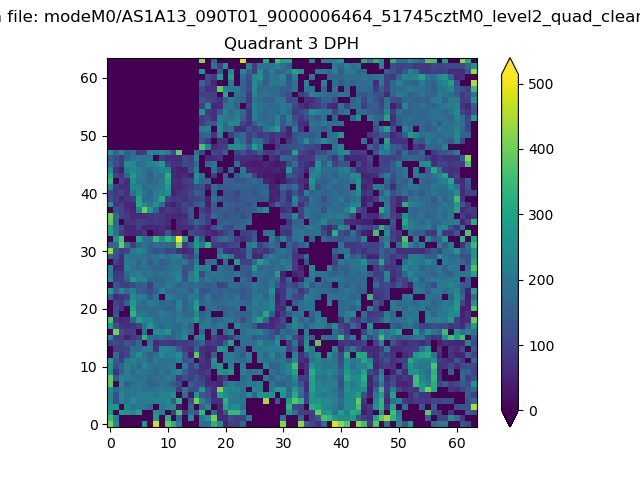 |
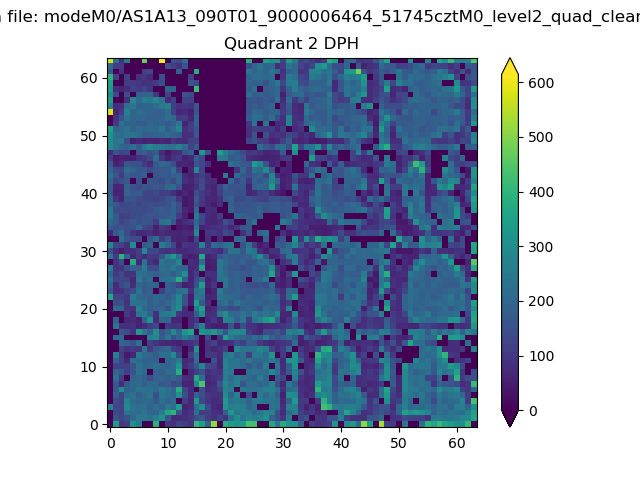 |
Quadrant C |
| Plot type | Count rate plots | Images |
|---|---|---|
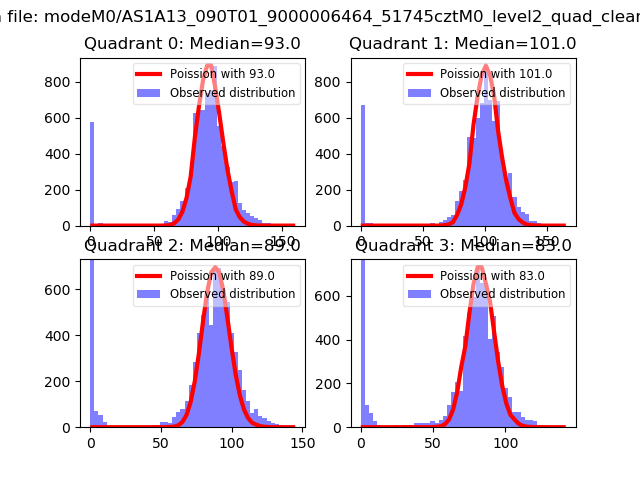
| Comparison with Poisson distribution Blue bars denote a histogram of data divided into 1 sec bins. Red curve is a Poisson curve with rate = median count rate of data. |
 |
 |
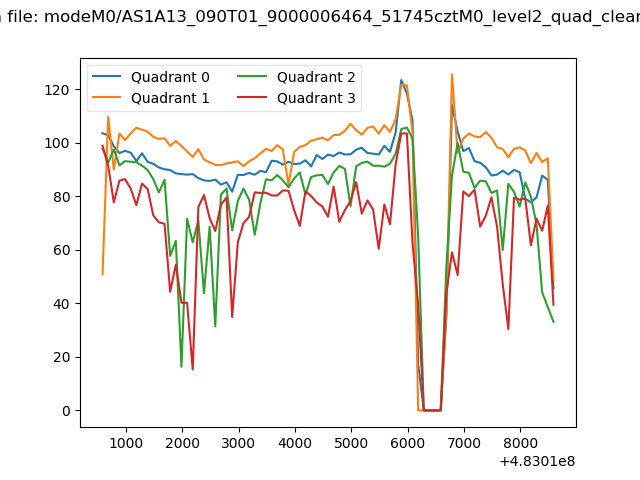
| Quadrant-wise count rates Data is divided into 100 sec bins |
 |
|
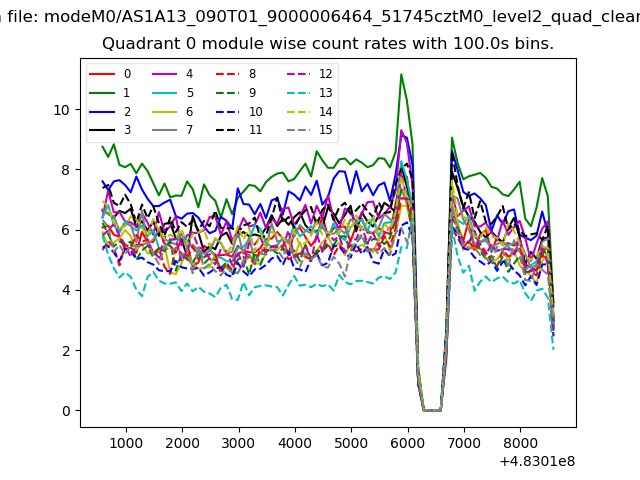
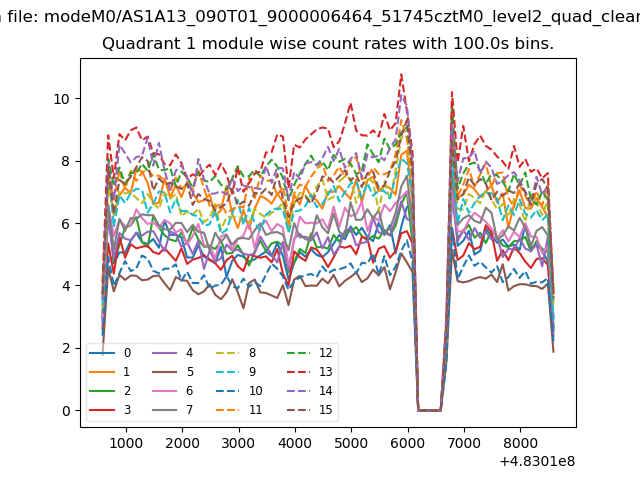
| Module-wise count rates for Quadrant A Data is divided into 100 sec bins |
 |
 |
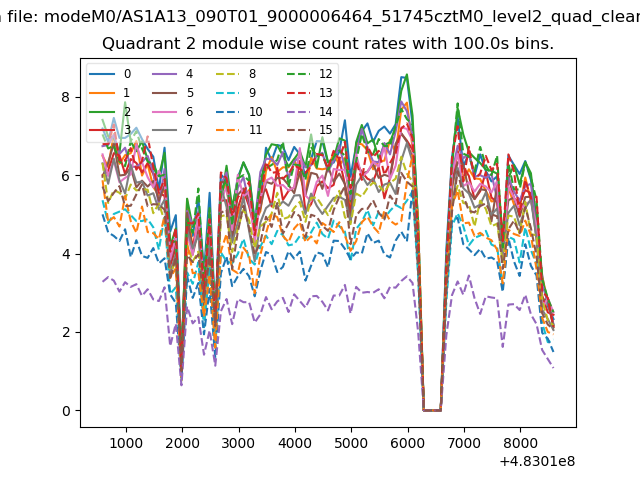
| Module-wise count rates for Quadrant B Data is divided into 100 sec bins |
 |
 |
| Module-wise count rates for Quadrant C Data is divided into 100 sec bins |
 |
 |
| Module-wise count rates for Quadrant D Data is divided into 100 sec bins |
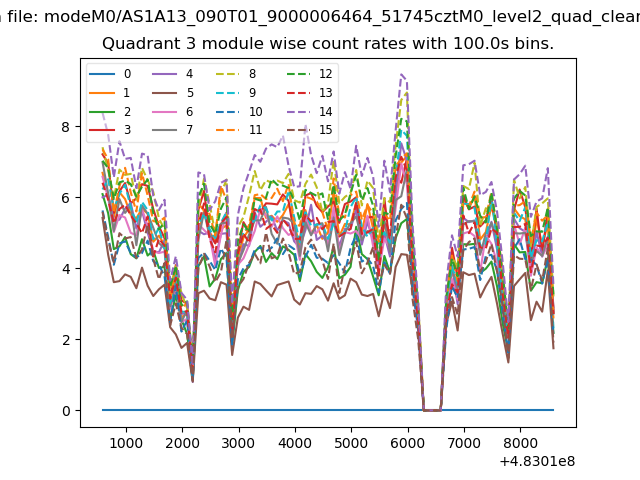 |
 |
| Parameter | Plot |
|---|---|
| CZT HV Monitor | 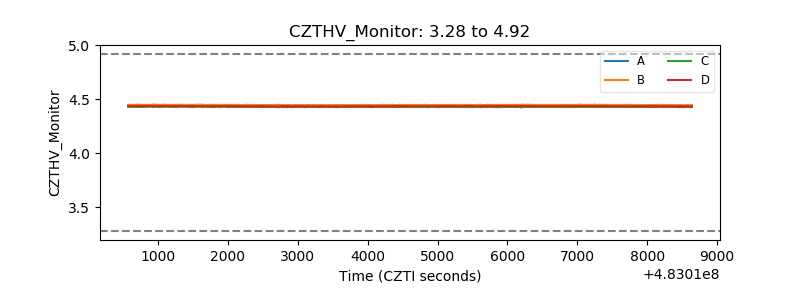 |
| D_VDD | 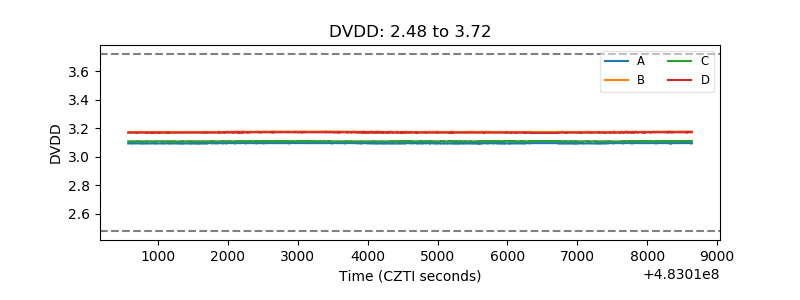 |
| Temperature 1 | 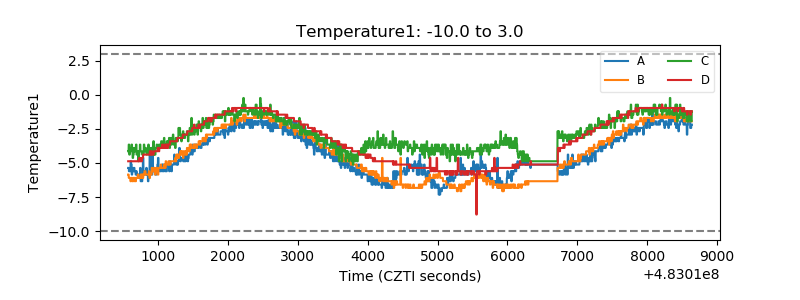 |
| Veto HV Monitor | 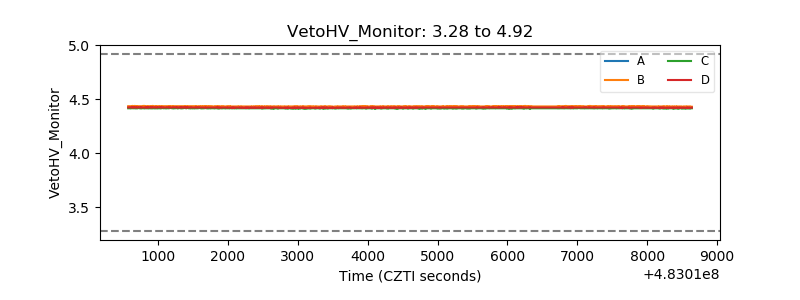 |
| Veto LLD | 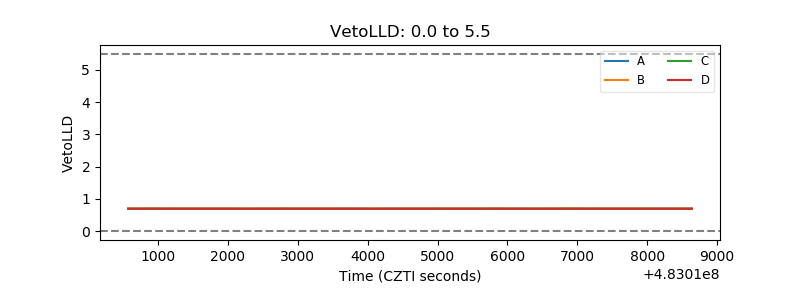 |
| Alpha Counter | 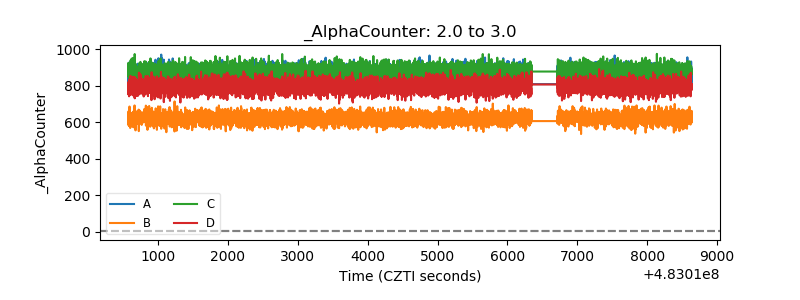 |
| _CPM_Rate | 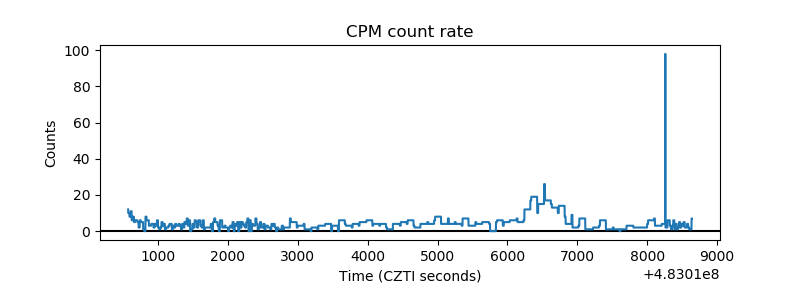 |
| CZT Counter | 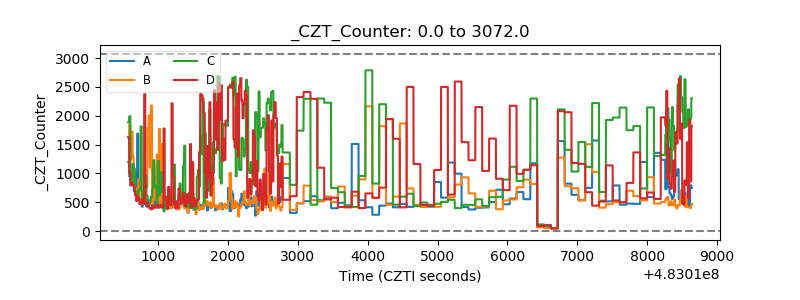 |
| +2.5 Volts monitor | 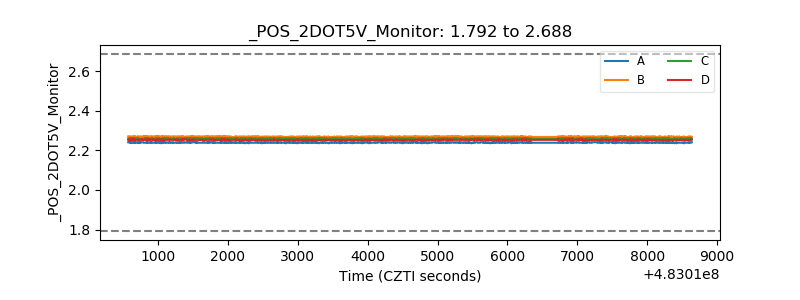 |
| +5 Volts monitor | 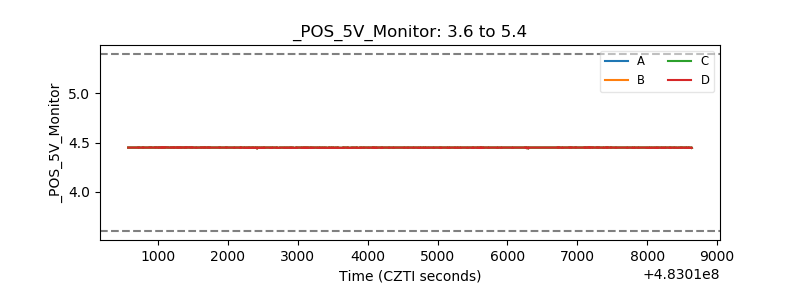 |
| _ROLL_ROT | 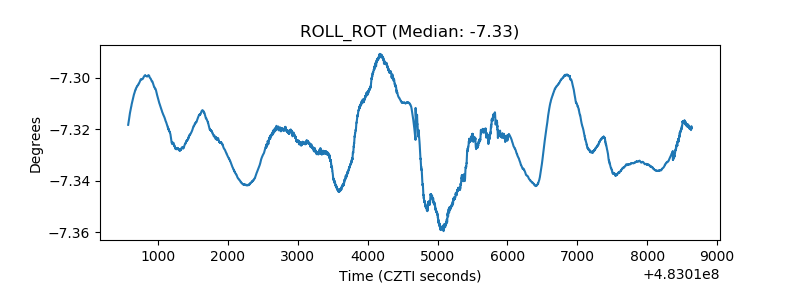 |
| _Roll_DEC | 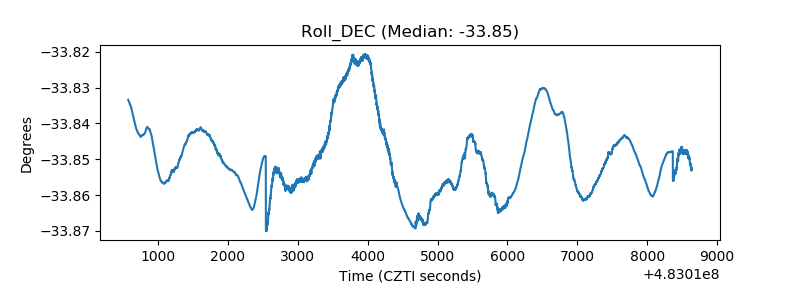 |
| _Roll_RA | 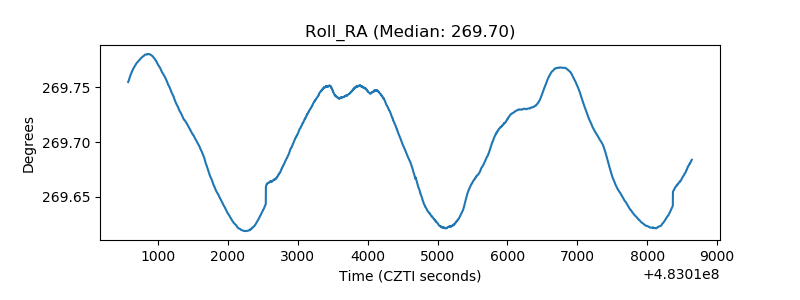 |
| Veto Counter |  |