| Param | Original file | Final file |
|---|---|---|
| Filename | modeM0/AS1A13_090T01_9000006464_51747cztM0_level2.fits | modeM0/AS1A13_090T01_9000006464_51747cztM0_level2_quad_clean.evt |
| Size (bytes) | 771,860,160 | 105,667,200 |
| Size | 736.1 MB | 100.8 MB |
| Events in quadrant A | 6,795,759 | 668,902 |
| Events in quadrant B | 6,484,347 | 724,866 |
| Events in quadrant C | 5,361,604 | 695,378 |
| Events in quadrant D | 9,318,664 | 560,584 |
| Mode SS | |||
|---|---|---|---|
| Quadrant | BADHDUFLAG | Total packets | Discarded packets |
| A | 0 | 158 | 0 |
| B | 0 | 158 | 0 |
| C | 0 | 158 | 0 |
| D | 0 | 158 | 0 |
| Mode M0 | |||
|---|---|---|---|
| Quadrant | BADHDUFLAG | Total packets | Discarded packets |
| A | 0 | 25431 | 0 |
| B | 0 | 24701 | 0 |
| C | 0 | 21377 | 0 |
| D | 0 | 33184 | 5 |
| Quadrant | Total seconds | Saturated seconds | Saturation percentage |
|---|---|---|---|
| A | 7901 | 749 | 9.479813% |
| B | 7902 | 823 | 10.415085% |
| C | 7902 | 270 | 3.416856% |
| D | 7901 | 1559 | 19.731680% |
Noise dominated data is calculated using 1-second bins in cleaned event files. If a bin has >2000 counts, and if more than 50% of those come from <1% of pixels, then it is considered to be noise-dominated and hence unusable.
| Quadrant | # 1 sec bins | Bins with >0 counts | Bins with >2000 counts | High rate bins dominated by noise | Noise dominated (total time) | Noise dominated (detector-on time) | Marked lightcurve |
|---|---|---|---|---|---|---|---|
| A | 7901 | 7901 | 733 | 733 | 9.28% | 9.28% | 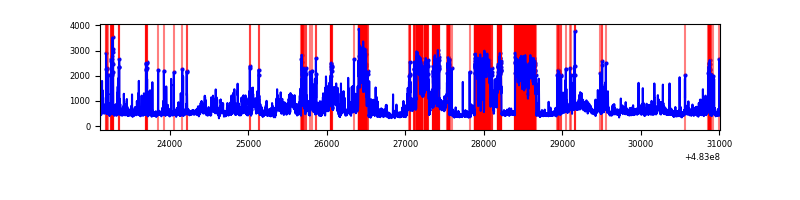 |
| B | 7902 | 7902 | 605 | 605 | 7.66% | 7.66% | 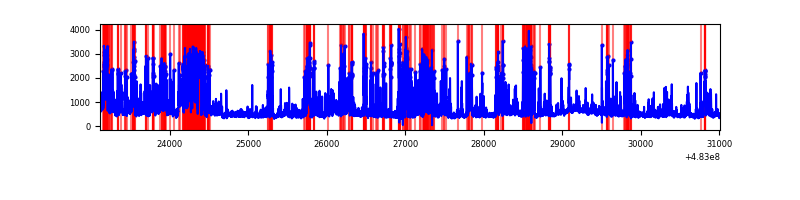 |
| C | 7902 | 7902 | 248 | 248 | 3.14% | 3.14% | 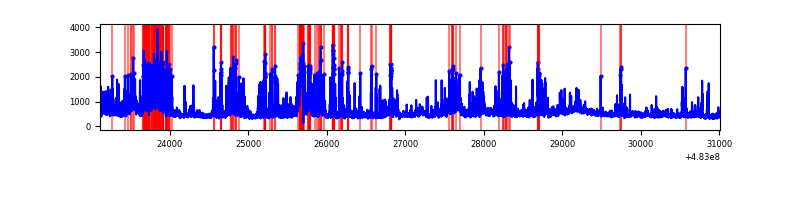 |
| D | 7901 | 7901 | 1442 | 1442 | 18.25% | 18.25% | 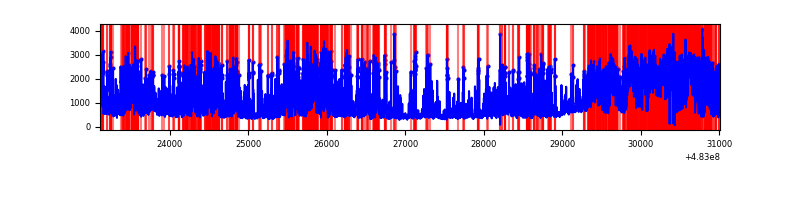 |
Top three noisy pixels from each quadrant. If the there are fewer than three noisy pixels in the level2.evt file, extra rows are filled as -1
| Pixel properties | Quadrant properties | ||||||
|---|---|---|---|---|---|---|---|
| Quadrant | DetID | PixID | Counts | Sigma | Mean | Median | Sigma |
| A | 8 | 62 | 1480617 | 7289.18 | 828 | 806 | 203.0 |
| A | 12 | 3 | 566232 | 2785.15 | 828 | 806 | 203.0 |
| A | 8 | 246 | 393874 | 1936.16 | 828 | 806 | 203.0 |
| B | 4 | 206 | 1790180 | 10227.99 | 807 | 780 | 175.0 |
| B | 4 | 174 | 822023 | 4694.13 | 807 | 780 | 175.0 |
| B | 8 | 128 | 130592 | 741.99 | 807 | 780 | 175.0 |
| C | 15 | 230 | 288914 | 1276.8 | 825 | 818 | 225.6 |
| C | 14 | 245 | 282871 | 1250.01 | 825 | 818 | 225.6 |
| C | 15 | 218 | 273219 | 1207.24 | 825 | 818 | 225.6 |
| D | 11 | 129 | 4043350 | 18632.27 | 770 | 744 | 217.0 |
| D | 8 | 176 | 1126441 | 5188.31 | 770 | 744 | 217.0 |
| D | 7 | 159 | 188794 | 866.72 | 770 | 744 | 217.0 |
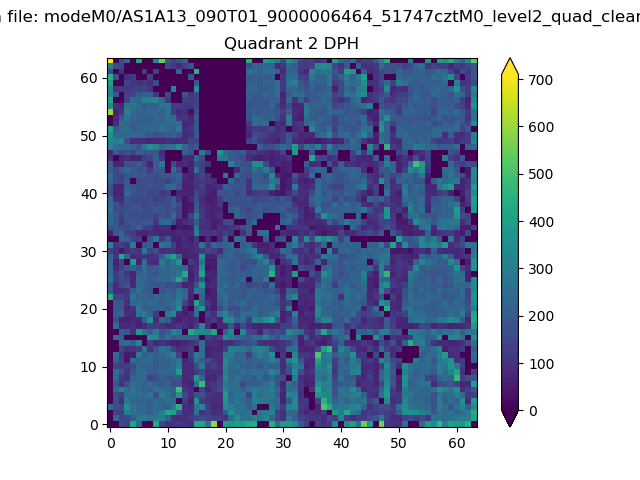
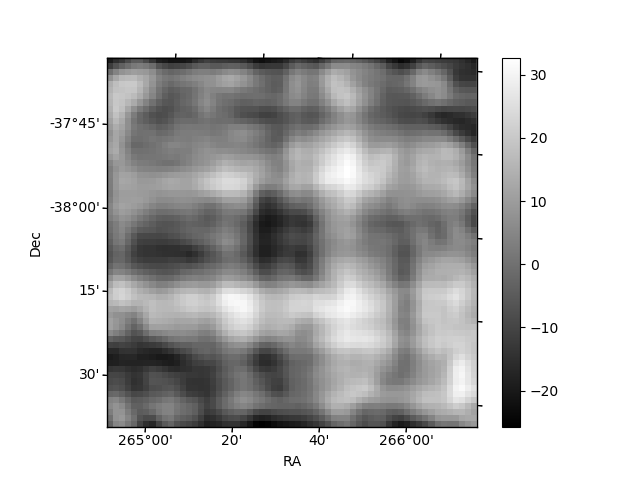
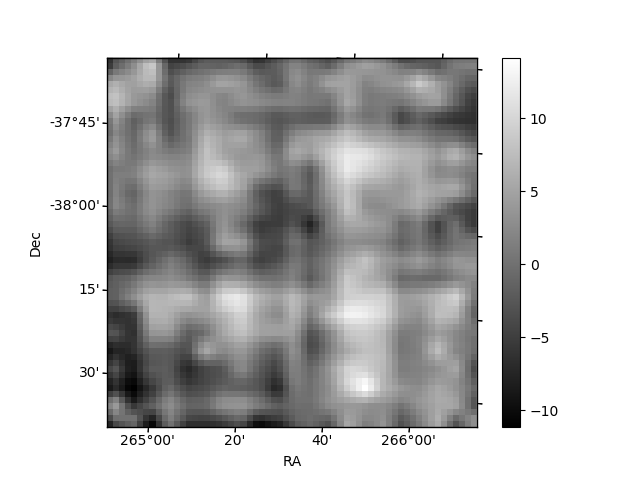
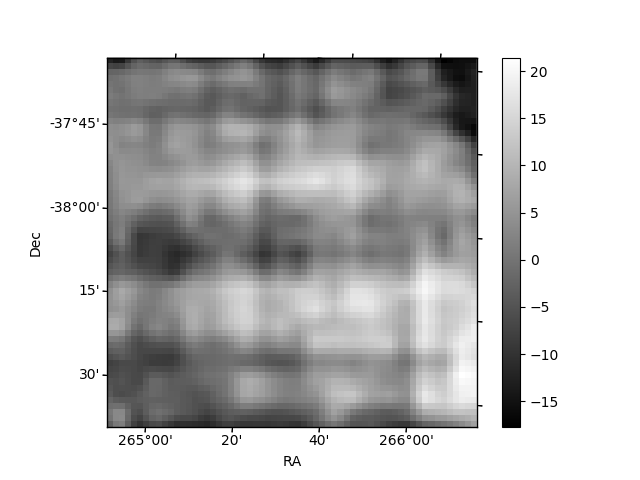
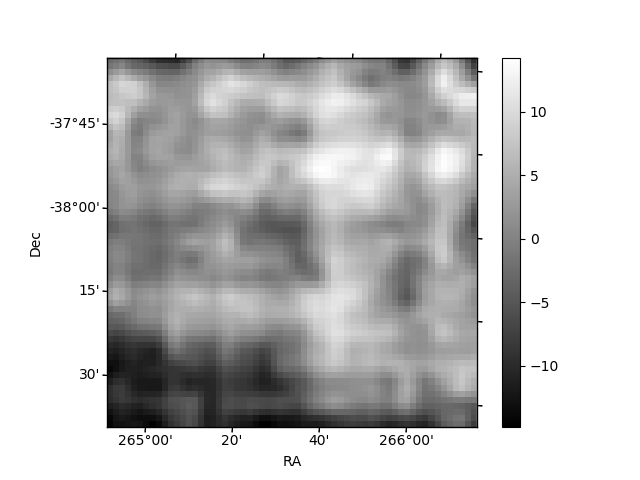
Histogram calculated using DETX and DETY for each event in the final _common_clean file
| Quadrant A | 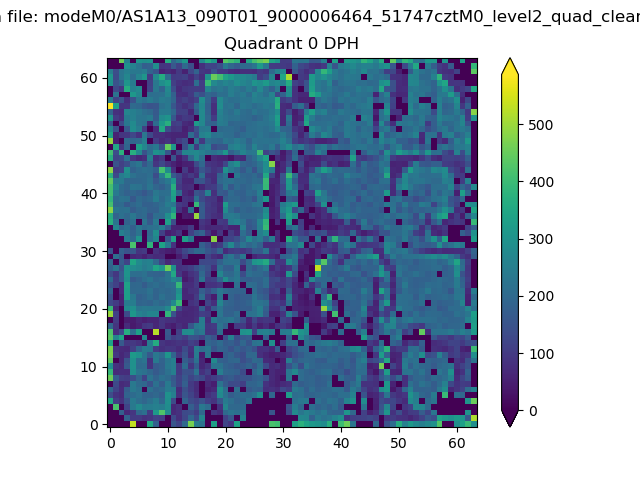 |
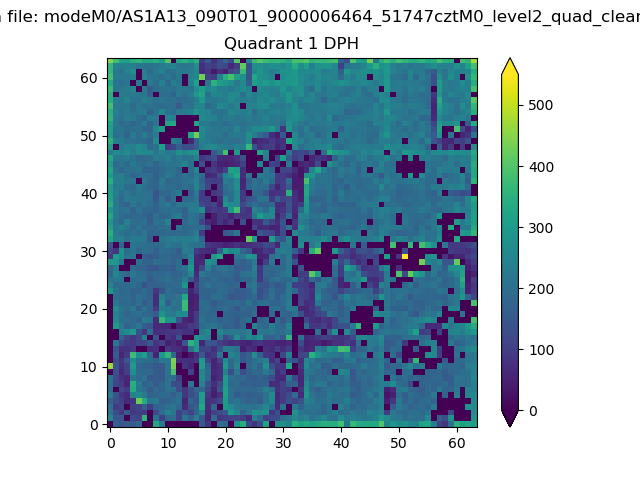 |
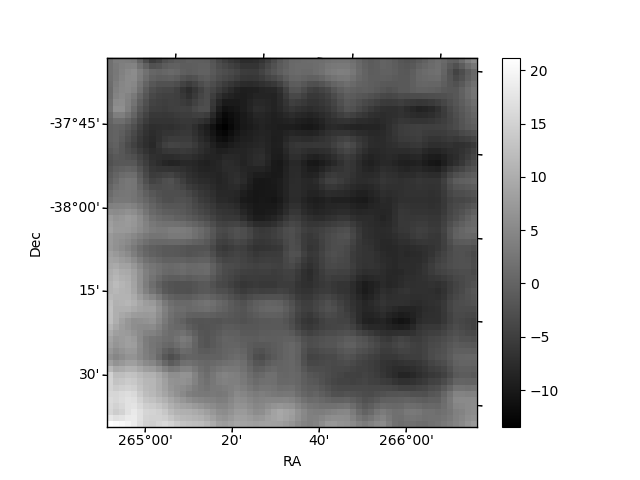
Quadrant B |
|---|---|---|---|
| Quadrant D | 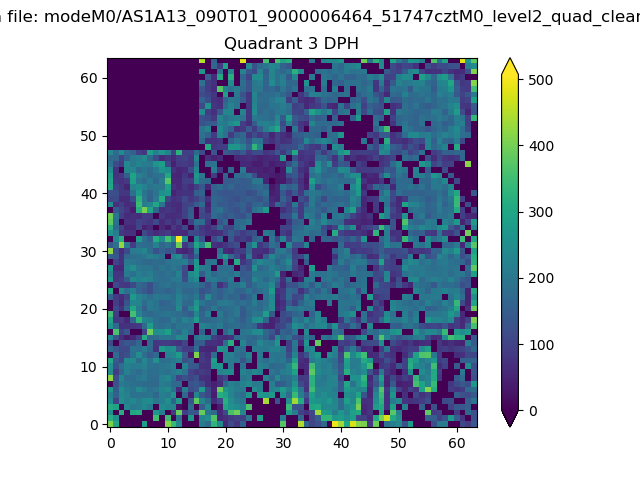 |
 |
Quadrant C |
| Plot type | Count rate plots | Images |
|---|---|---|
| Comparison with Poisson distribution Blue bars denote a histogram of data divided into 1 sec bins. Red curve is a Poisson curve with rate = median count rate of data. |
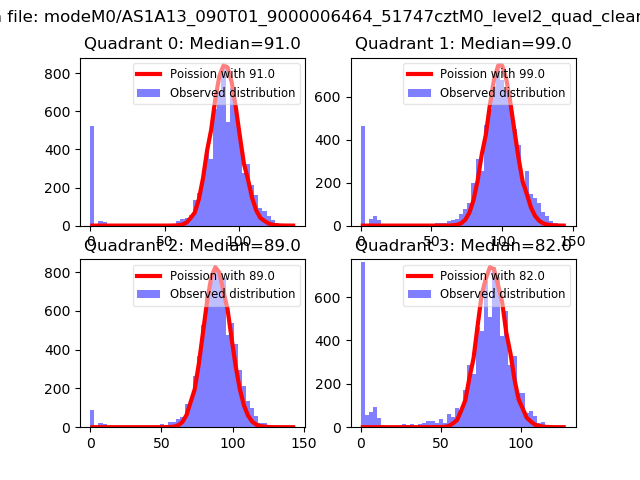 |
 |
| Quadrant-wise count rates Data is divided into 100 sec bins |
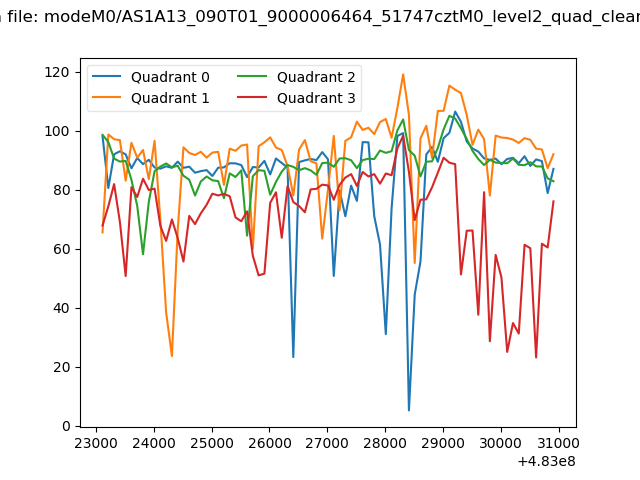 |
|
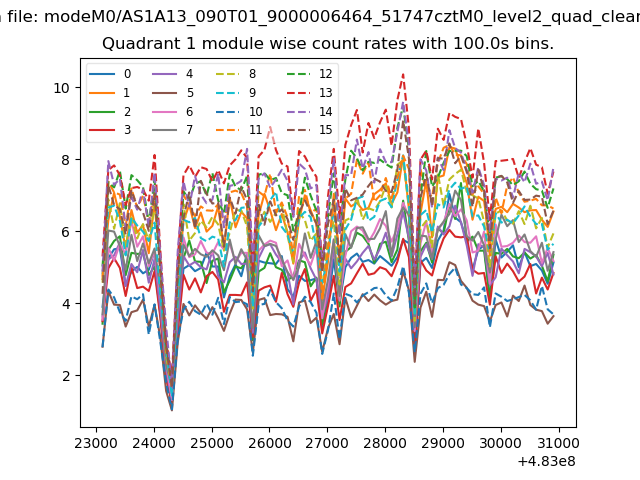
| Module-wise count rates for Quadrant A Data is divided into 100 sec bins |
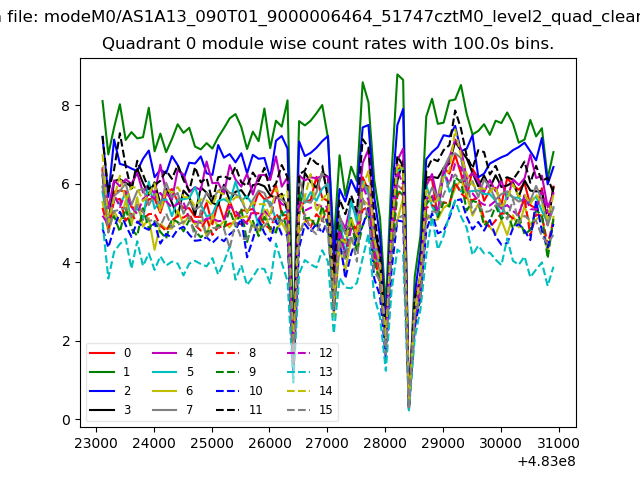 |
 |
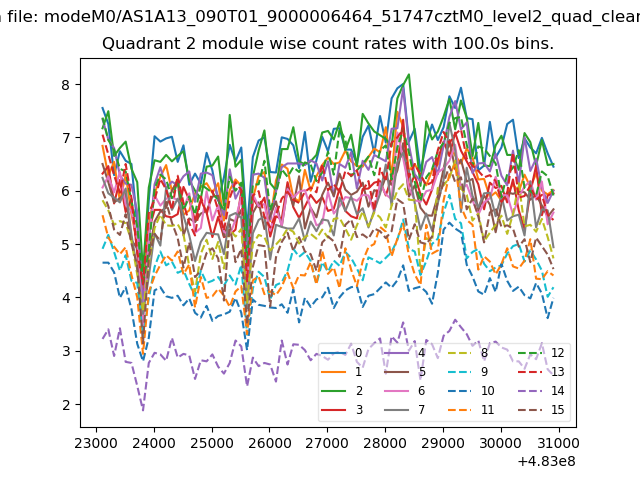
| Module-wise count rates for Quadrant B Data is divided into 100 sec bins |
 |
 |
| Module-wise count rates for Quadrant C Data is divided into 100 sec bins |
 |
 |
| Module-wise count rates for Quadrant D Data is divided into 100 sec bins |
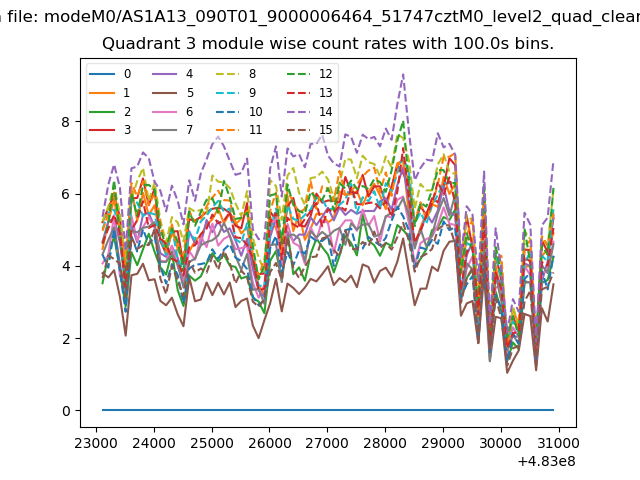 |
 |
| Parameter | Plot |
|---|---|
| CZT HV Monitor | 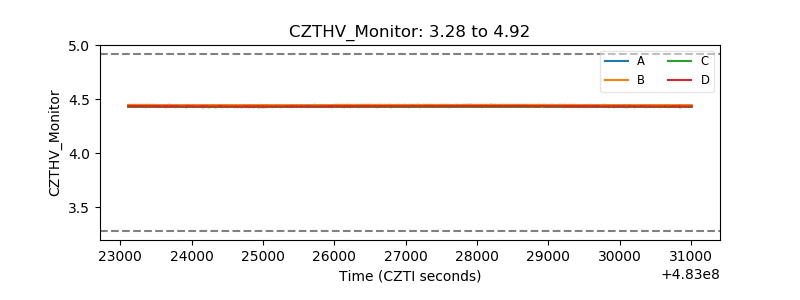 |
| D_VDD | 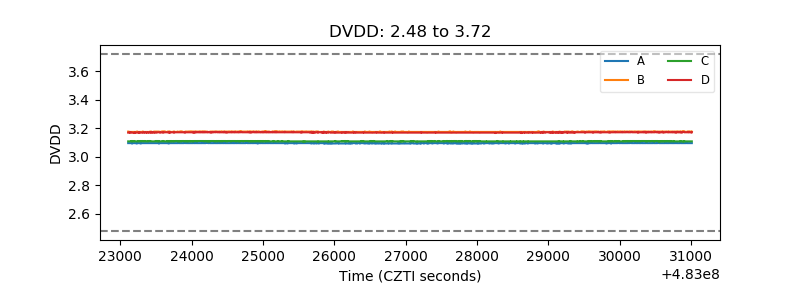 |
| Temperature 1 | 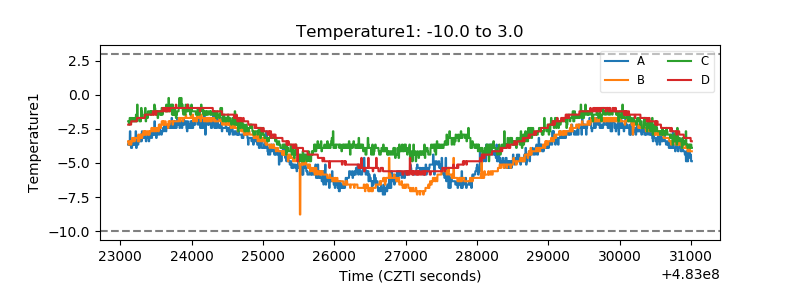 |
| Veto HV Monitor | 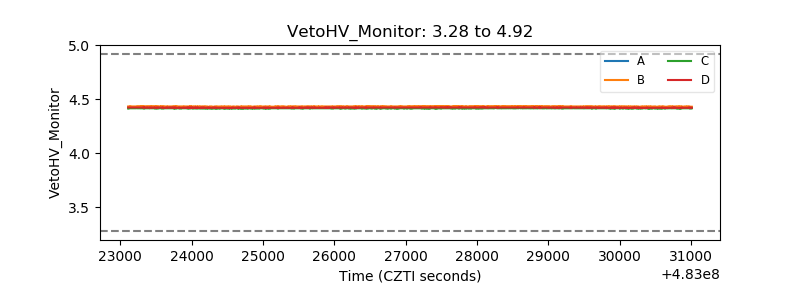 |
| Veto LLD | 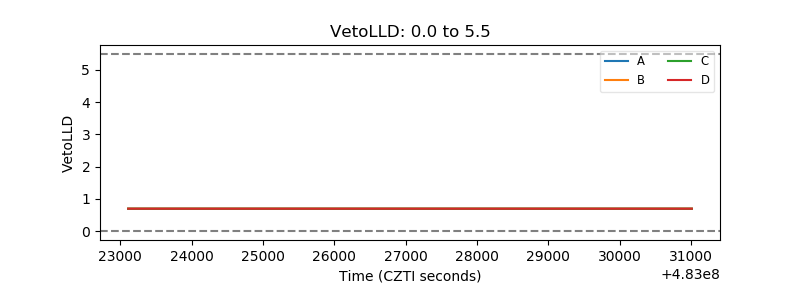 |
| Alpha Counter | 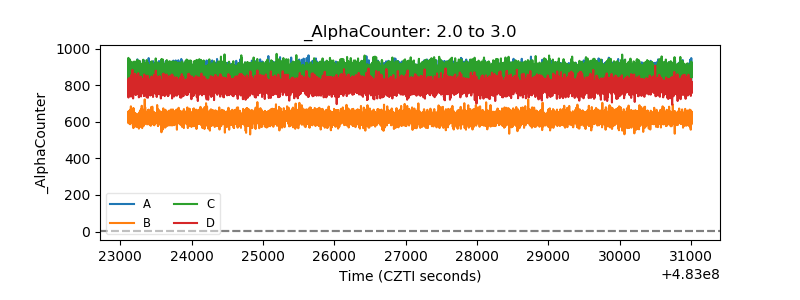 |
| _CPM_Rate | 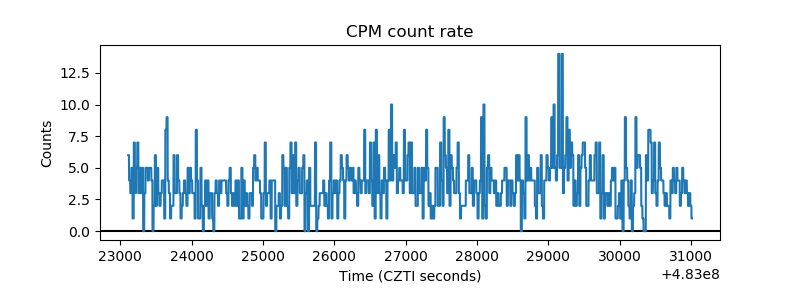 |
| CZT Counter | 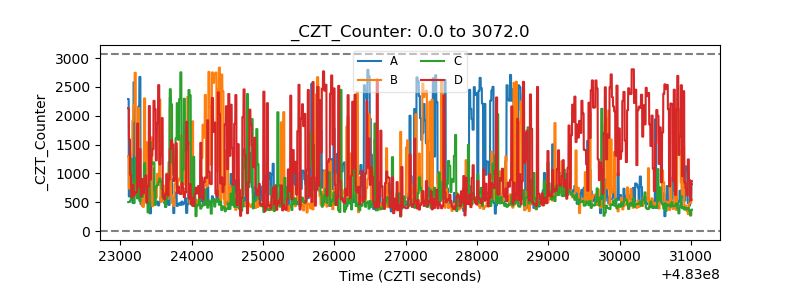 |
| +2.5 Volts monitor | 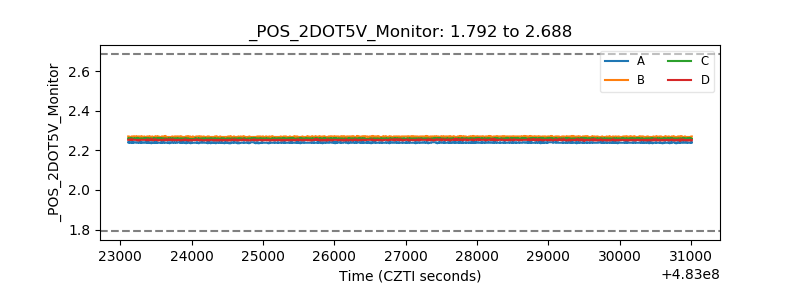 |
| +5 Volts monitor | 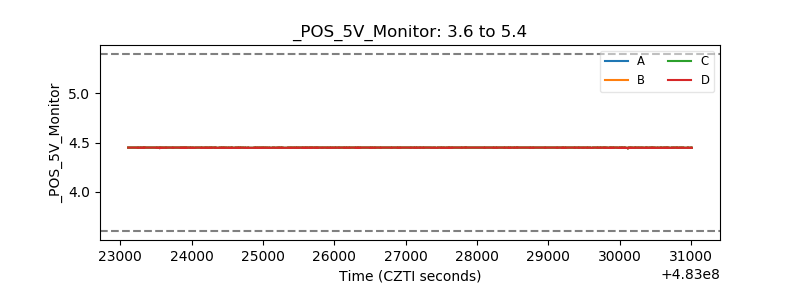 |
| _ROLL_ROT | 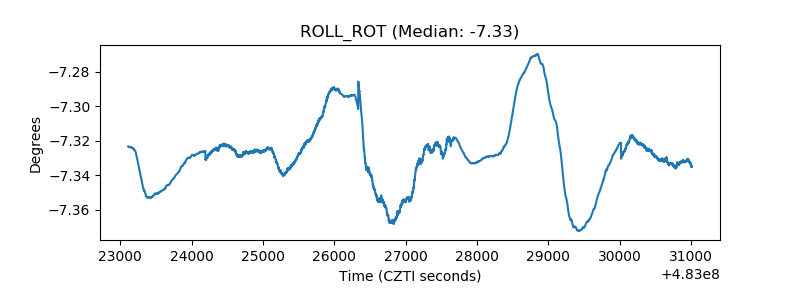 |
| _Roll_DEC | 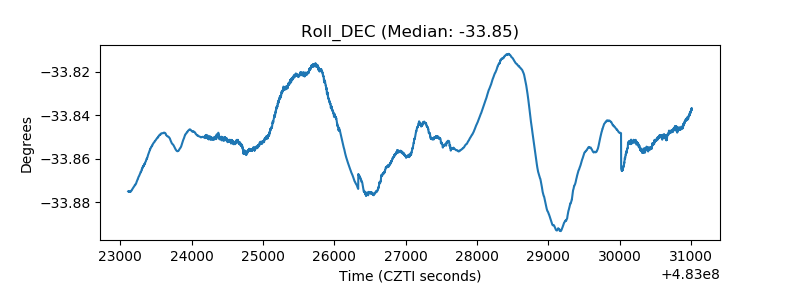 |
| _Roll_RA | 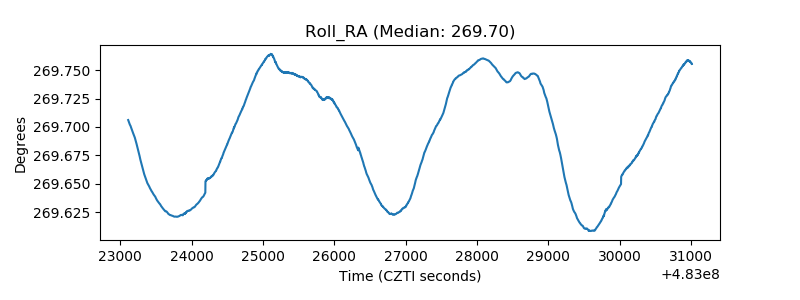 |
| Veto Counter | 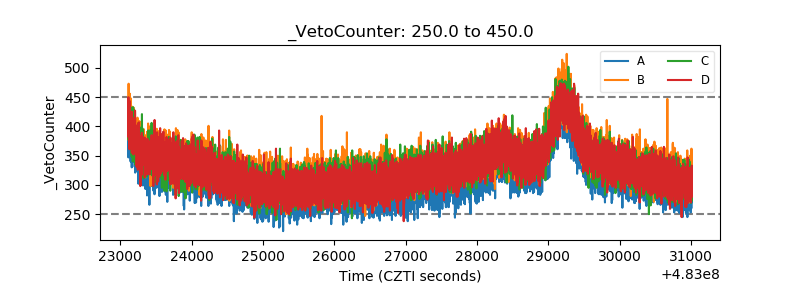 |