| Param | Original file | Final file |
|---|---|---|
| Filename | modeM0/AS1A13_090T01_9000006464_51750cztM0_level2.fits | modeM0/AS1A13_090T01_9000006464_51750cztM0_level2_quad_clean.evt |
| Size (bytes) | 1,554,287,040 | 219,392,640 |
| Size | 1.4 GB | 209.2 MB |
| Events in quadrant A | 10,170,576 | 1,506,017 |
| Events in quadrant B | 14,026,063 | 1,512,651 |
| Events in quadrant C | 9,819,027 | 1,460,296 |
| Events in quadrant D | 22,237,527 | 1,018,264 |
| Mode M9 | |||
|---|---|---|---|
| Quadrant | BADHDUFLAG | Total packets | Discarded packets |
| A | 0 | 2 | 0 |
| B | 0 | 2 | 0 |
| C | 0 | 2 | 0 |
| D | 0 | 2 | 0 |
| Mode SS | |||
|---|---|---|---|
| Quadrant | BADHDUFLAG | Total packets | Discarded packets |
| A | 0 | 334 | 0 |
| B | 0 | 334 | 0 |
| C | 0 | 334 | 0 |
| D | 0 | 334 | 0 |
| Mode M0 | |||
|---|---|---|---|
| Quadrant | BADHDUFLAG | Total packets | Discarded packets |
| A | 0 | 41337 | 1 |
| B | 0 | 53086 | 1 |
| C | 0 | 40856 | 1 |
| D | 0 | 77504 | 1 |
| Quadrant | Total seconds | Saturated seconds | Saturation percentage |
|---|---|---|---|
| A | 16597 | 530 | 3.193348% |
| B | 16597 | 1909 | 11.502079% |
| C | 16597 | 300 | 1.807556% |
| D | 16598 | 4626 | 27.870828% |
Noise dominated data is calculated using 1-second bins in cleaned event files. If a bin has >2000 counts, and if more than 50% of those come from <1% of pixels, then it is considered to be noise-dominated and hence unusable.
| Quadrant | # 1 sec bins | Bins with >0 counts | Bins with >2000 counts | High rate bins dominated by noise | Noise dominated (total time) | Noise dominated (detector-on time) | Marked lightcurve |
|---|---|---|---|---|---|---|---|
| A | 16832 | 16598 | 331 | 331 | 1.97% | 1.99% | 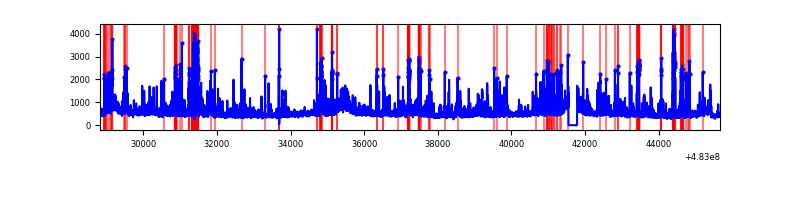 |
| B | 16832 | 16598 | 1194 | 1194 | 7.09% | 7.19% | 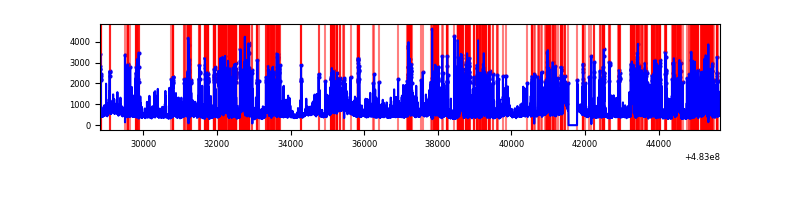 |
| C | 16832 | 16598 | 214 | 214 | 1.27% | 1.29% | 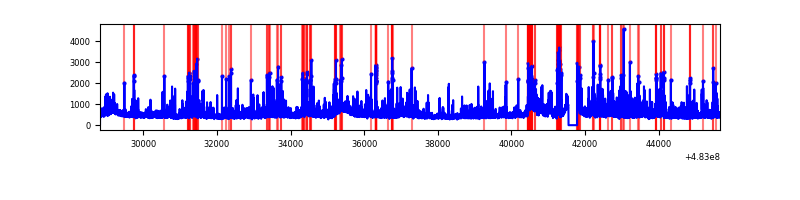 |
| D | 16833 | 16599 | 4067 | 4067 | 24.16% | 24.50% | 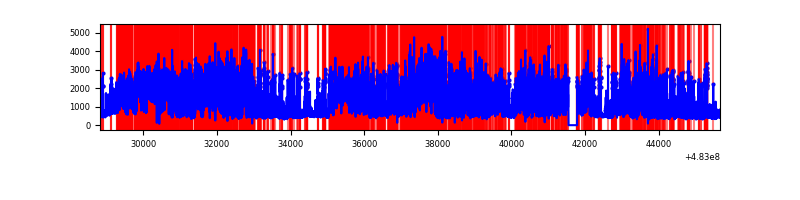 |
Top three noisy pixels from each quadrant. If the there are fewer than three noisy pixels in the level2.evt file, extra rows are filled as -1
| Pixel properties | Quadrant properties | ||||||
|---|---|---|---|---|---|---|---|
| Quadrant | DetID | PixID | Counts | Sigma | Mean | Median | Sigma |
| A | 2 | 143 | 463830 | 1062.34 | 1780 | 1740 | 435.0 |
| A | 4 | 3 | 281952 | 644.2 | 1780 | 1740 | 435.0 |
| A | 3 | 14 | 269857 | 616.4 | 1780 | 1740 | 435.0 |
| B | 4 | 206 | 4602462 | 12529.41 | 1711 | 1648 | 367.2 |
| B | 8 | 128 | 409684 | 1111.21 | 1711 | 1648 | 367.2 |
| B | 1 | 207 | 397078 | 1076.88 | 1711 | 1648 | 367.2 |
| C | 3 | 233 | 478644 | 998.14 | 1748 | 1738 | 477.8 |
| C | 13 | 3 | 408326 | 850.97 | 1748 | 1738 | 477.8 |
| C | 15 | 218 | 391734 | 816.25 | 1748 | 1738 | 477.8 |
| D | 11 | 129 | 10785552 | 25166.02 | 1536 | 1483 | 428.5 |
| D | 8 | 176 | 1923357 | 4484.94 | 1536 | 1483 | 428.5 |
| D | 7 | 60 | 1257986 | 2932.21 | 1536 | 1483 | 428.5 |
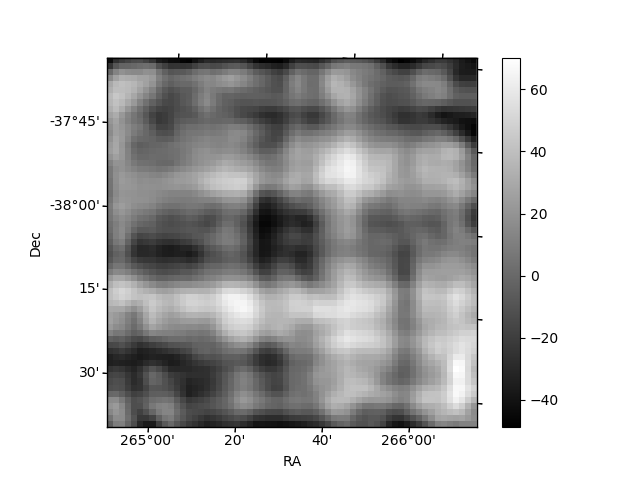
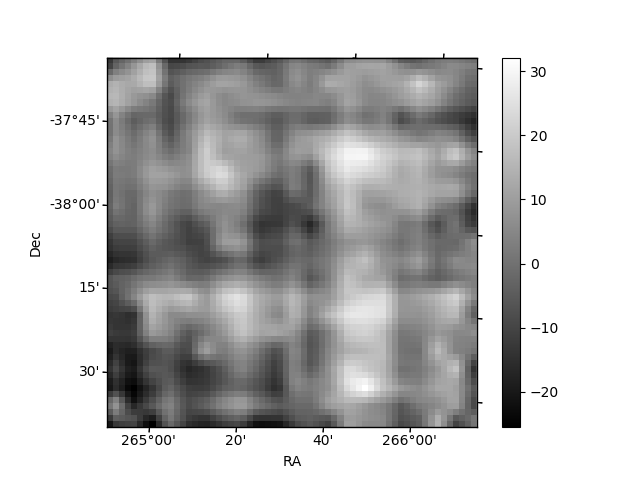
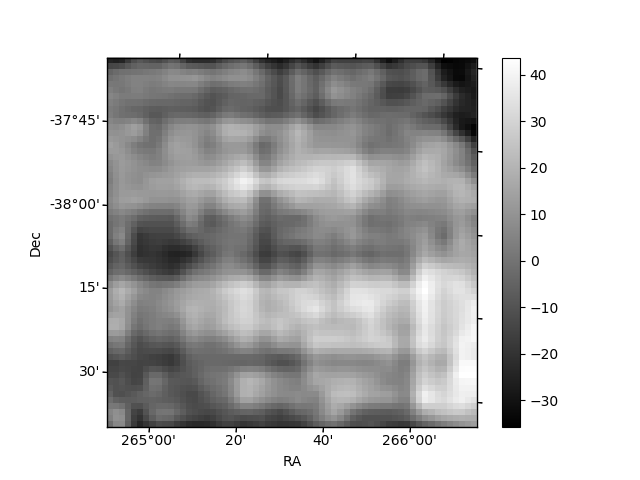
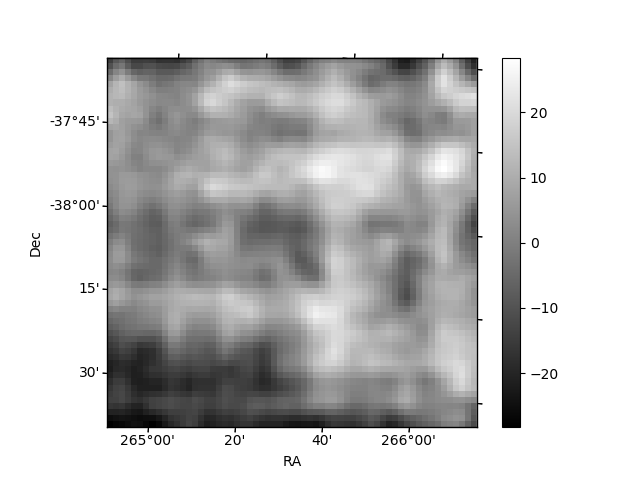
Histogram calculated using DETX and DETY for each event in the final _common_clean file
| Quadrant A | 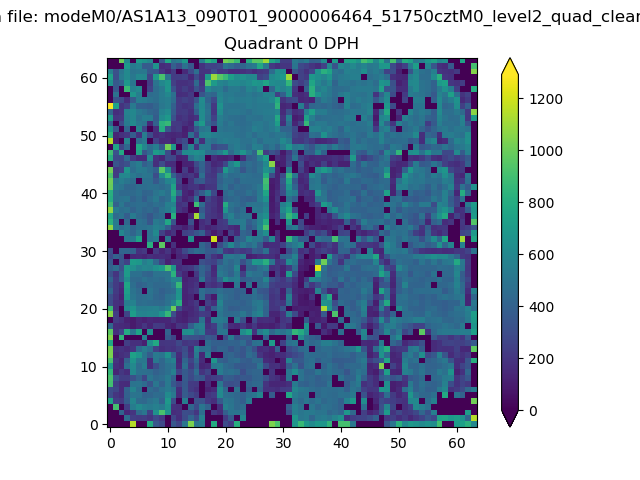 |
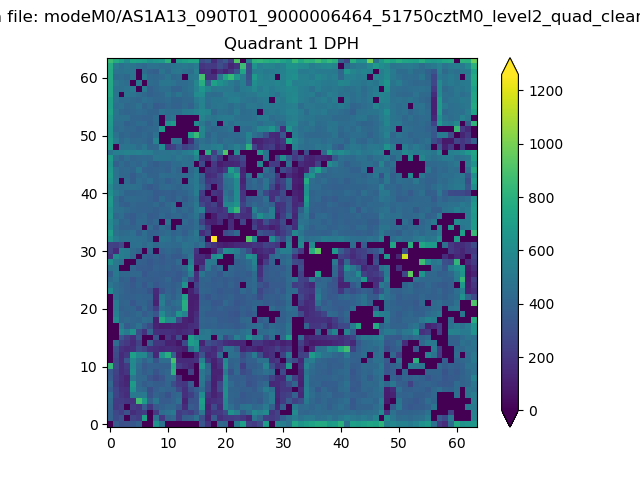 |
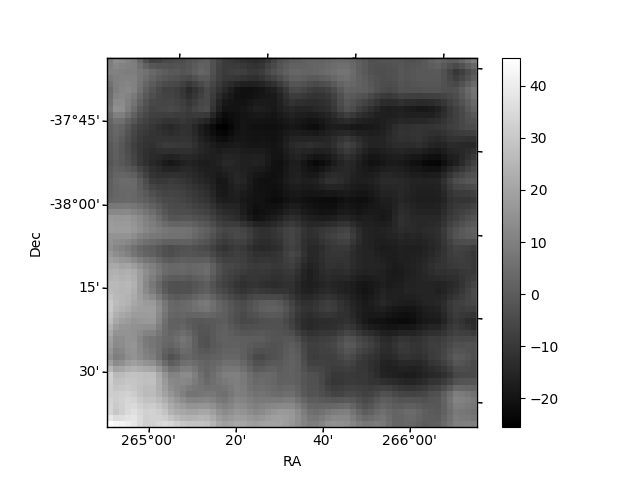
Quadrant B |
|---|---|---|---|
| Quadrant D | 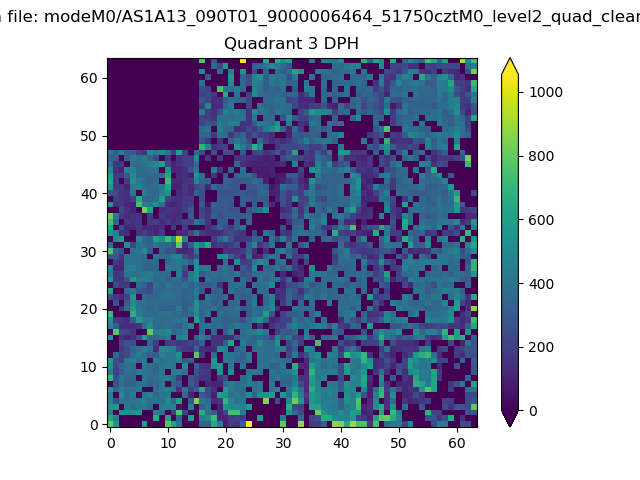 |
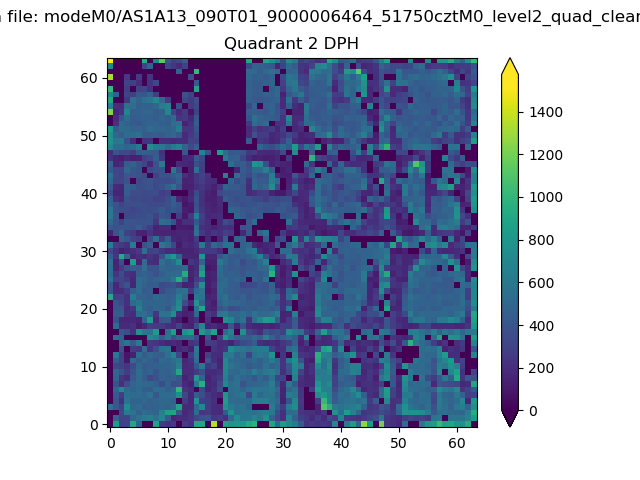 |
Quadrant C |
| Plot type | Count rate plots | Images |
|---|---|---|
| Comparison with Poisson distribution Blue bars denote a histogram of data divided into 1 sec bins. Red curve is a Poisson curve with rate = median count rate of data. |
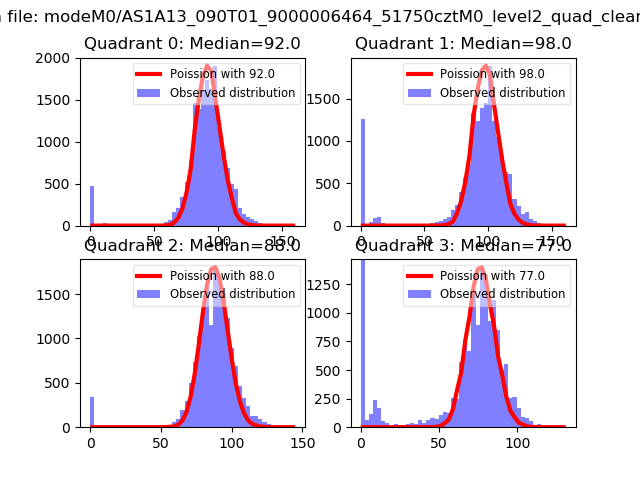 |
 |
| Quadrant-wise count rates Data is divided into 100 sec bins |
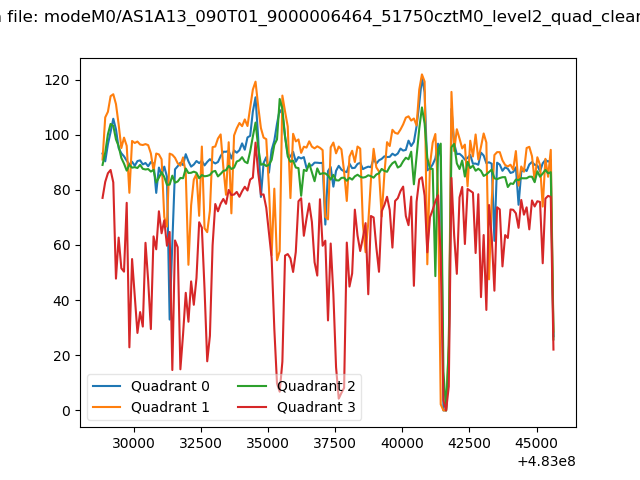 |
|
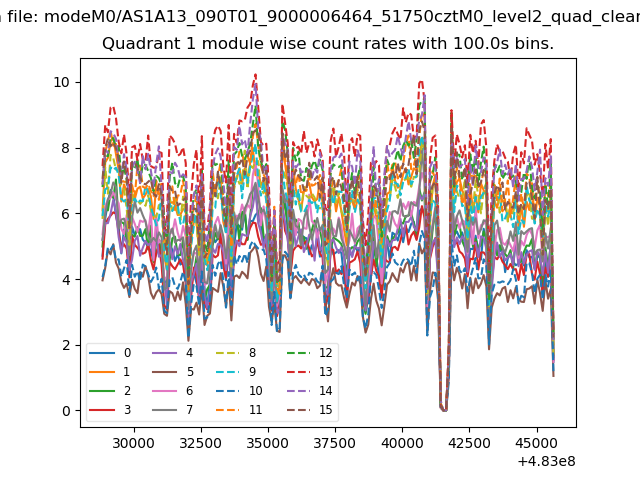
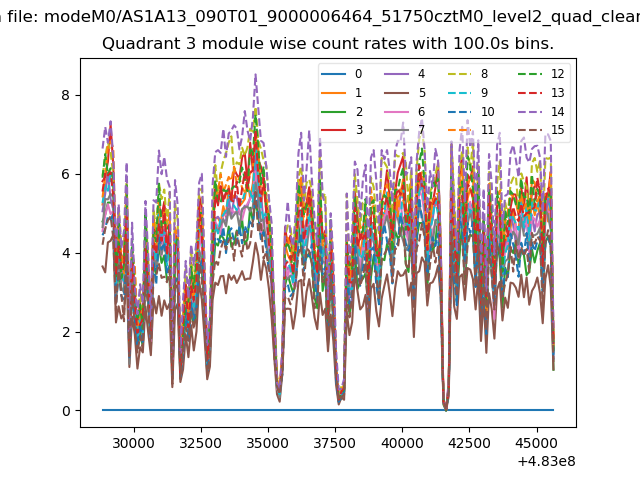
| Module-wise count rates for Quadrant A Data is divided into 100 sec bins |
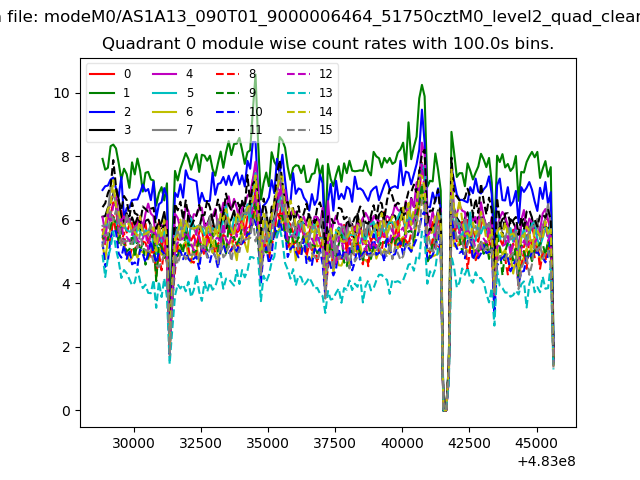 |
 |
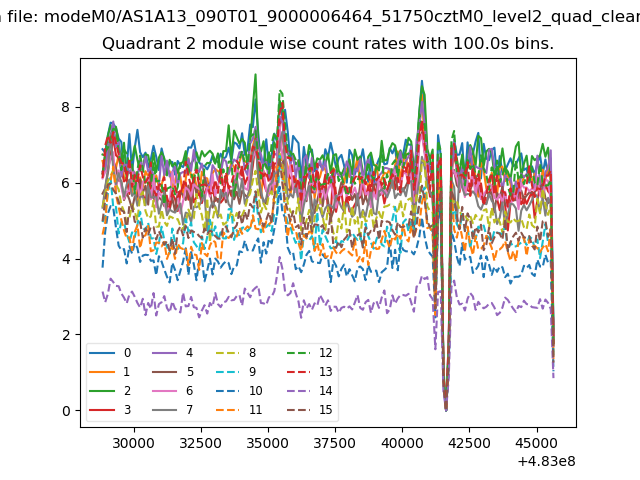
| Module-wise count rates for Quadrant B Data is divided into 100 sec bins |
 |
 |
| Module-wise count rates for Quadrant C Data is divided into 100 sec bins |
 |
 |
| Module-wise count rates for Quadrant D Data is divided into 100 sec bins |
 |
 |
| Parameter | Plot |
|---|---|
| CZT HV Monitor | 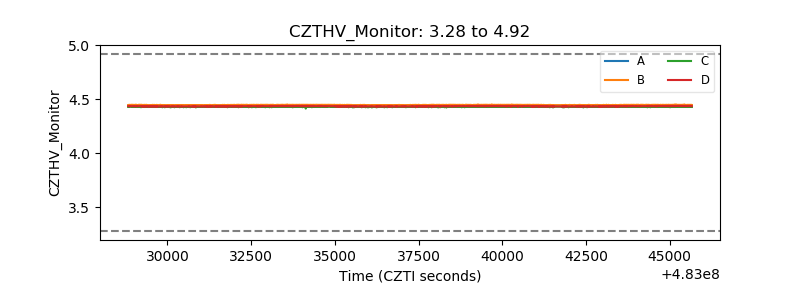 |
| D_VDD | 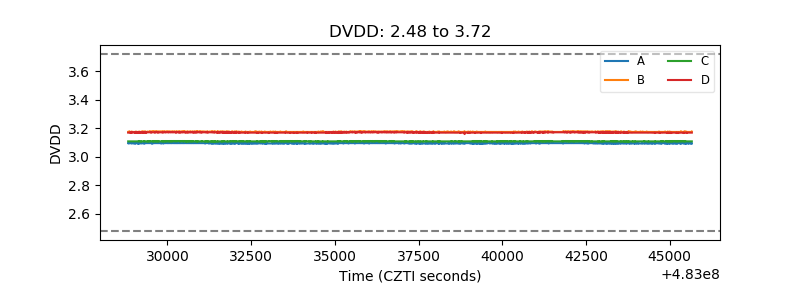 |
| Temperature 1 |  |
| Veto HV Monitor | 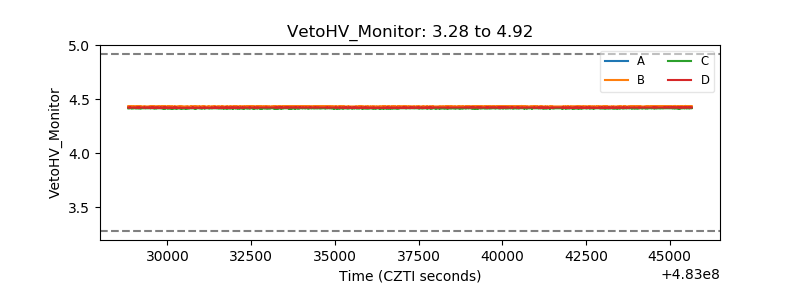 |
| Veto LLD | 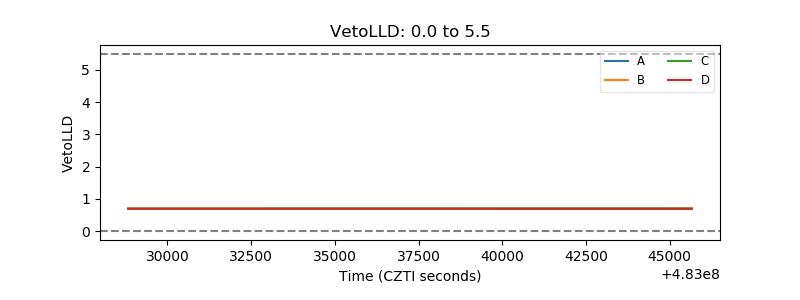 |
| Alpha Counter | 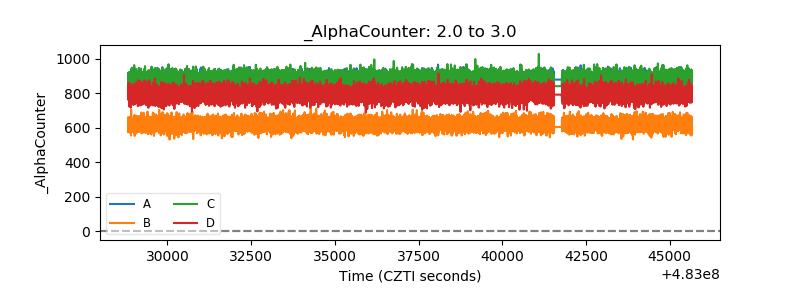 |
| _CPM_Rate | 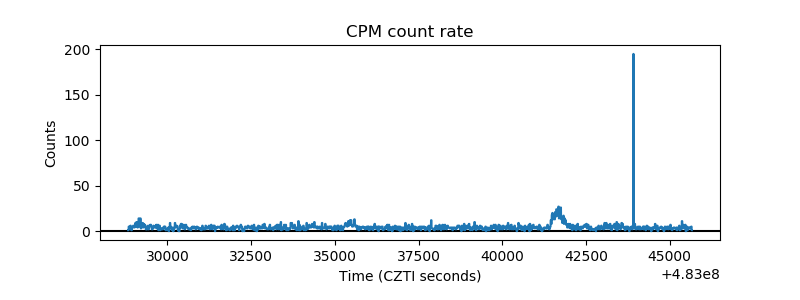 |
| CZT Counter | 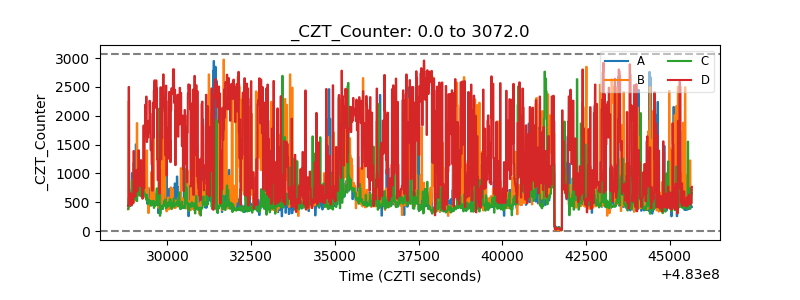 |
| +2.5 Volts monitor | 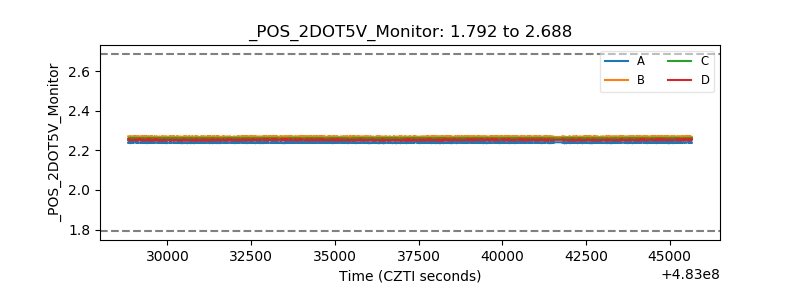 |
| +5 Volts monitor | 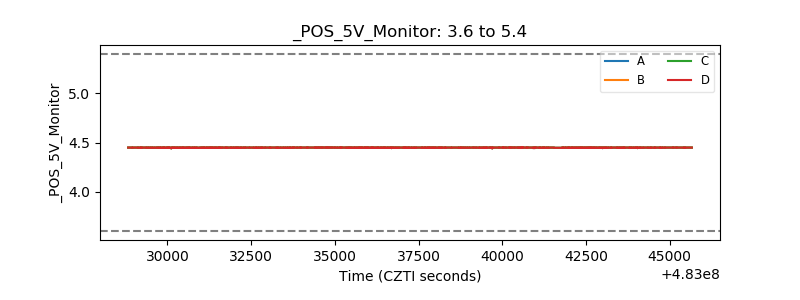 |
| _ROLL_ROT | 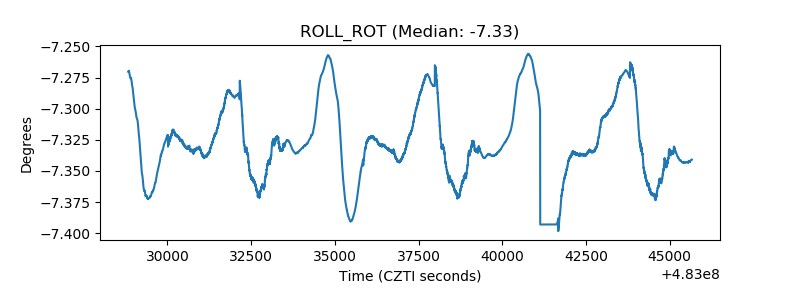 |
| _Roll_DEC | 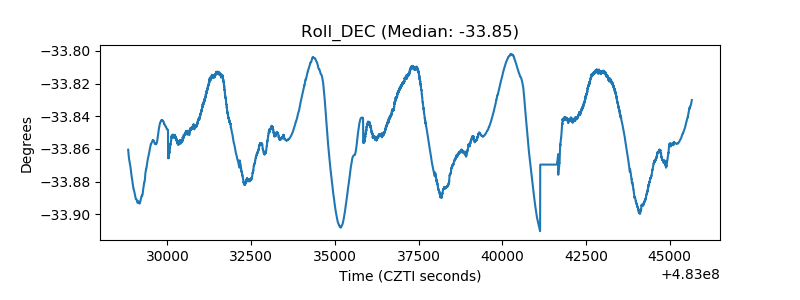 |
| _Roll_RA | 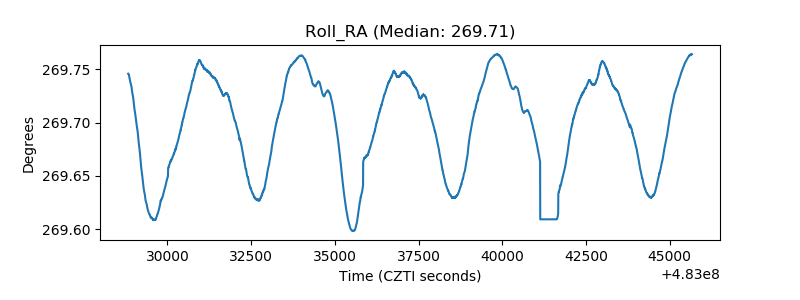 |
| Veto Counter | 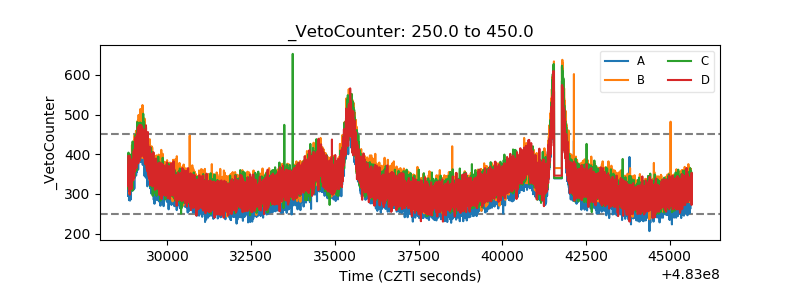 |