| Param | Original file | Final file |
|---|---|---|
| Filename | modeM0/AS1A13_090T01_9000006464_51751cztM0_level2.fits | modeM0/AS1A13_090T01_9000006464_51751cztM0_level2_quad_clean.evt |
| Size (bytes) | 939,637,440 | 131,892,480 |
| Size | 896.1 MB | 125.8 MB |
| Events in quadrant A | 6,190,135 | 891,988 |
| Events in quadrant B | 10,239,647 | 854,959 |
| Events in quadrant C | 6,418,352 | 856,491 |
| Events in quadrant D | 11,172,495 | 707,196 |
| Mode M9 | |||
|---|---|---|---|
| Quadrant | BADHDUFLAG | Total packets | Discarded packets |
| A | 0 | 14 | 0 |
| B | 0 | 14 | 0 |
| C | 0 | 14 | 0 |
| D | 0 | 14 | 0 |
| Mode SS | |||
|---|---|---|---|
| Quadrant | BADHDUFLAG | Total packets | Discarded packets |
| A | 0 | 200 | 0 |
| B | 0 | 200 | 0 |
| C | 0 | 200 | 0 |
| D | 0 | 200 | 0 |
| Mode M0 | |||
|---|---|---|---|
| Quadrant | BADHDUFLAG | Total packets | Discarded packets |
| A | 0 | 25041 | 2 |
| B | 0 | 37223 | 2 |
| C | 0 | 25873 | 2 |
| D | 0 | 40022 | 4 |
| Quadrant | Total seconds | Saturated seconds | Saturation percentage |
|---|---|---|---|
| A | 9847 | 412 | 4.184015% |
| B | 9848 | 1836 | 18.643379% |
| C | 9848 | 457 | 4.640536% |
| D | 9847 | 1822 | 18.503097% |
Noise dominated data is calculated using 1-second bins in cleaned event files. If a bin has >2000 counts, and if more than 50% of those come from <1% of pixels, then it is considered to be noise-dominated and hence unusable.
| Quadrant | # 1 sec bins | Bins with >0 counts | Bins with >2000 counts | High rate bins dominated by noise | Noise dominated (total time) | Noise dominated (detector-on time) | Marked lightcurve |
|---|---|---|---|---|---|---|---|
| A | 11179 | 9850 | 281 | 281 | 2.51% | 2.85% | 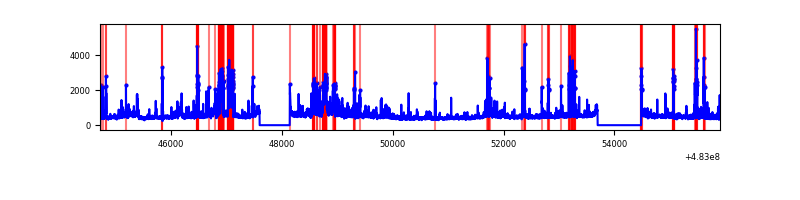 |
| B | 11180 | 9851 | 1281 | 1281 | 11.46% | 13.00% | 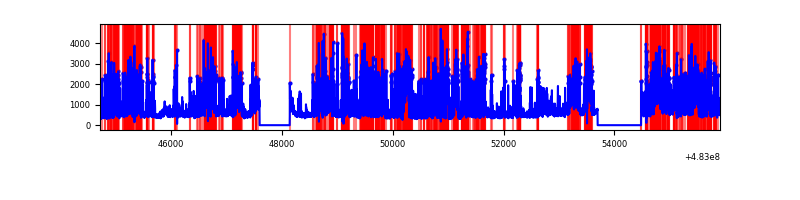 |
| C | 11180 | 9851 | 301 | 301 | 2.69% | 3.06% |  |
| D | 11179 | 9850 | 1624 | 1624 | 14.53% | 16.49% | 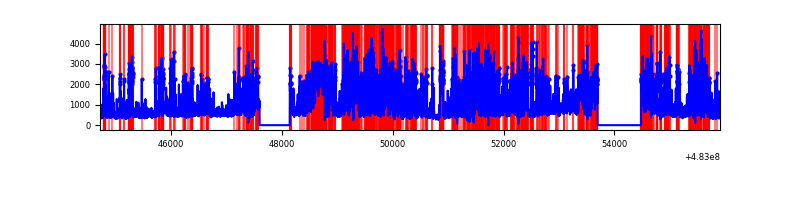 |
Top three noisy pixels from each quadrant. If the there are fewer than three noisy pixels in the level2.evt file, extra rows are filled as -1
| Pixel properties | Quadrant properties | ||||||
|---|---|---|---|---|---|---|---|
| Quadrant | DetID | PixID | Counts | Sigma | Mean | Median | Sigma |
| A | 8 | 62 | 396129 | 1528.52 | 1042 | 1015 | 258.5 |
| A | 4 | 175 | 314768 | 1213.77 | 1042 | 1015 | 258.5 |
| A | 15 | 174 | 261632 | 1008.21 | 1042 | 1015 | 258.5 |
| B | 4 | 206 | 4944527 | 23373.67 | 980 | 944 | 211.5 |
| B | 8 | 128 | 841491 | 3974.18 | 980 | 944 | 211.5 |
| B | 0 | 213 | 136217 | 639.58 | 980 | 944 | 211.5 |
| C | 13 | 3 | 905656 | 3269.61 | 1010 | 1002 | 276.7 |
| C | 15 | 224 | 205381 | 738.67 | 1010 | 1002 | 276.7 |
| C | 15 | 230 | 173240 | 622.5 | 1010 | 1002 | 276.7 |
| D | 11 | 129 | 6220679 | 23507.42 | 950 | 914 | 264.6 |
| D | 8 | 176 | 350620 | 1321.7 | 950 | 914 | 264.6 |
| D | 7 | 125 | 218649 | 822.92 | 950 | 914 | 264.6 |
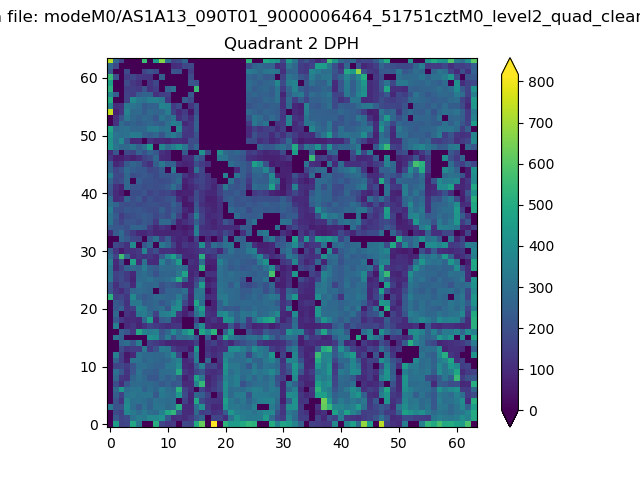
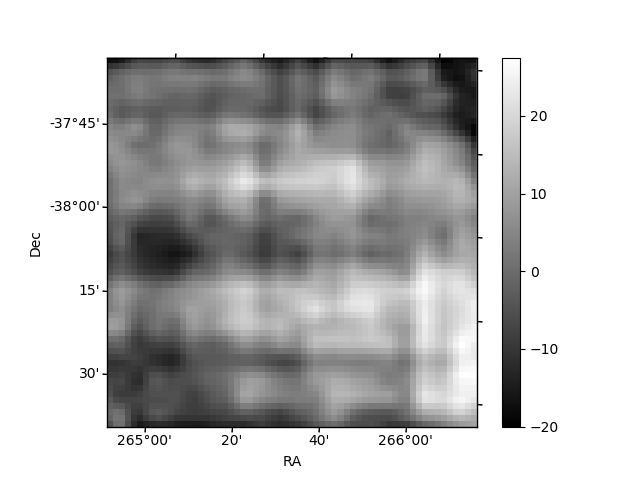
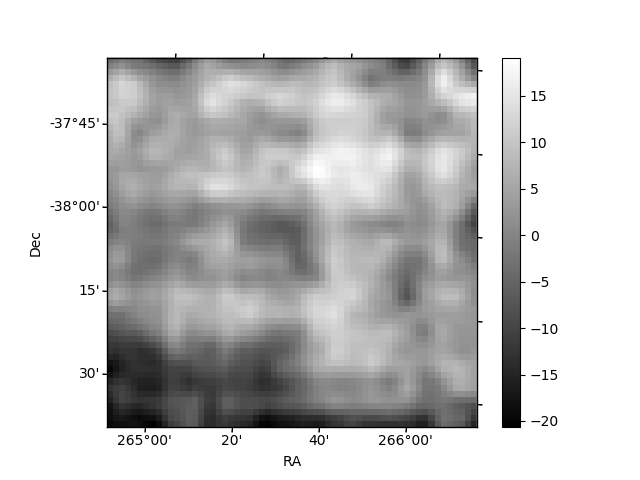
Histogram calculated using DETX and DETY for each event in the final _common_clean file
| Quadrant A | 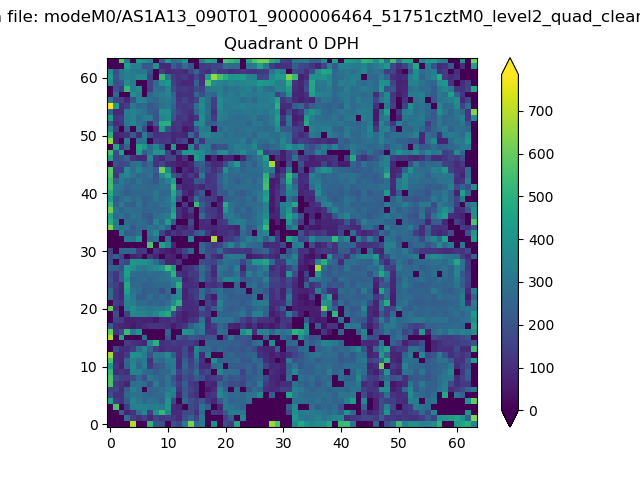 |
 |
Quadrant B |
|---|---|---|---|
| Quadrant D | 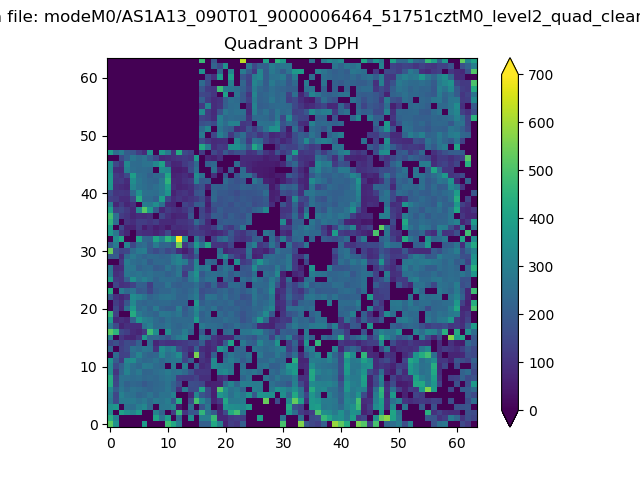 |
 |
Quadrant C |
| Plot type | Count rate plots | Images |
|---|---|---|
| Comparison with Poisson distribution Blue bars denote a histogram of data divided into 1 sec bins. Red curve is a Poisson curve with rate = median count rate of data. |
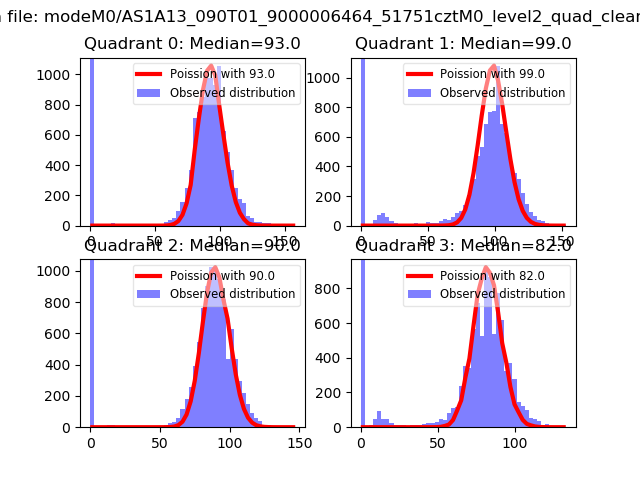 |
 |
| Quadrant-wise count rates Data is divided into 100 sec bins |
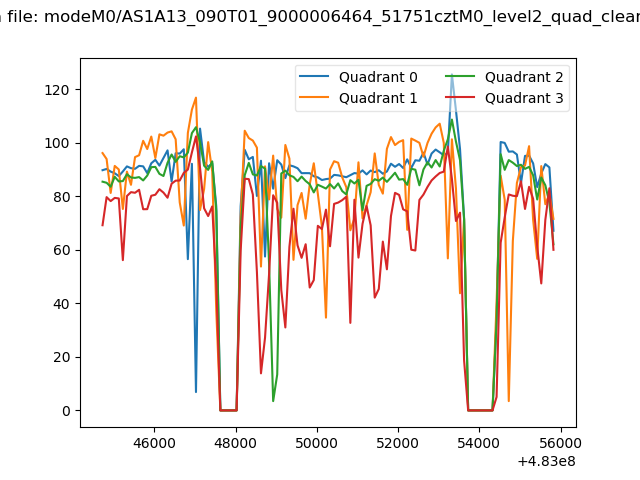 |
|
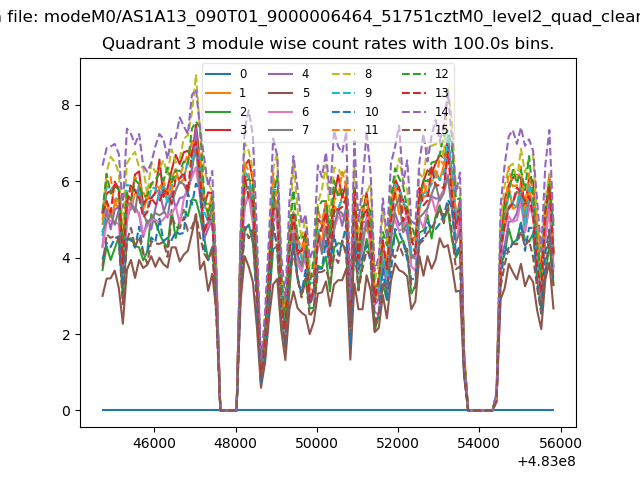
| Module-wise count rates for Quadrant A Data is divided into 100 sec bins |
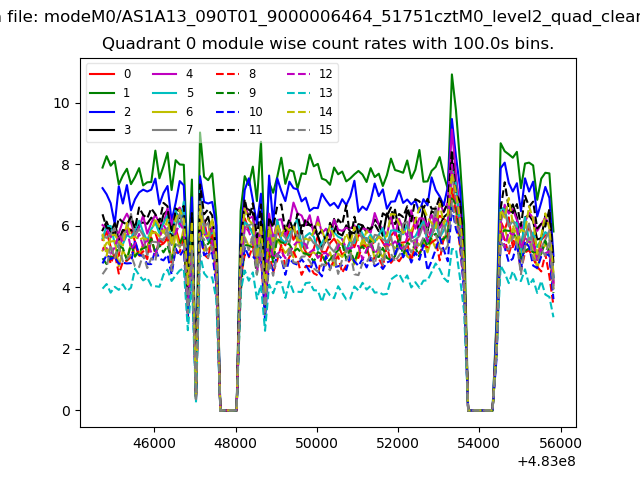 |
 |
| Module-wise count rates for Quadrant B Data is divided into 100 sec bins |
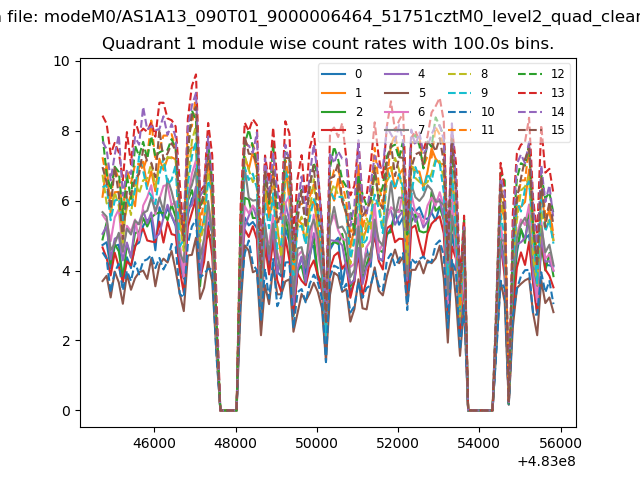 |
 |
| Module-wise count rates for Quadrant C Data is divided into 100 sec bins |
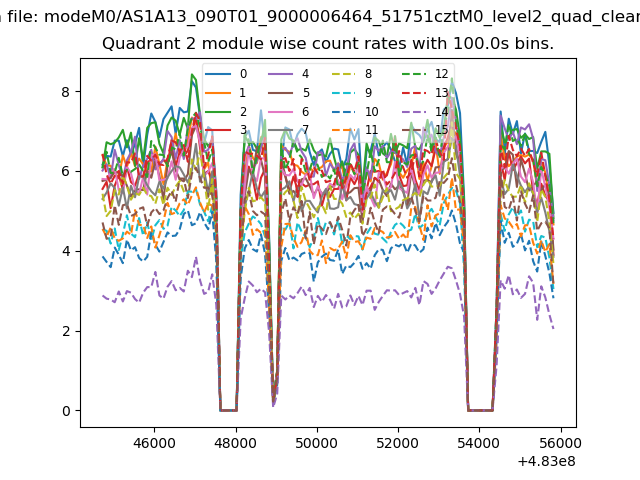 |
 |
| Module-wise count rates for Quadrant D Data is divided into 100 sec bins |
 |
 |
| Parameter | Plot |
|---|---|
| CZT HV Monitor | 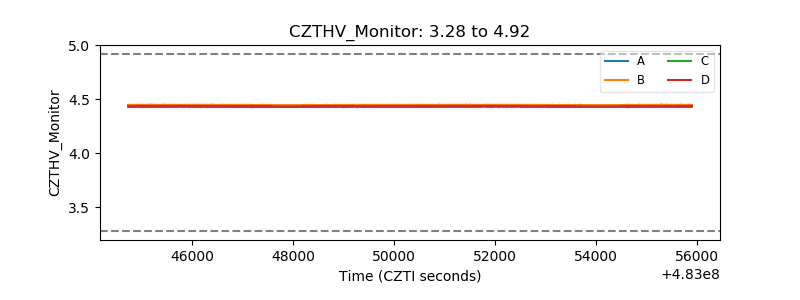 |
| D_VDD | 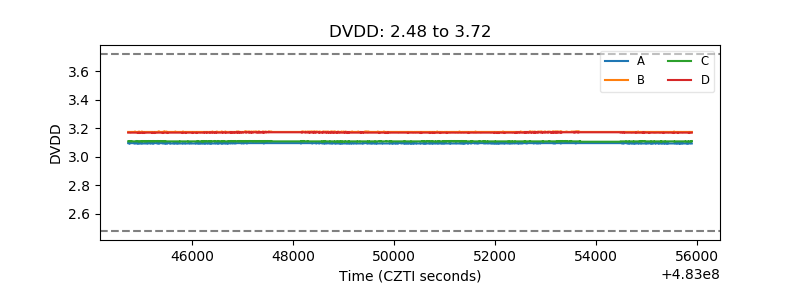 |
| Temperature 1 | 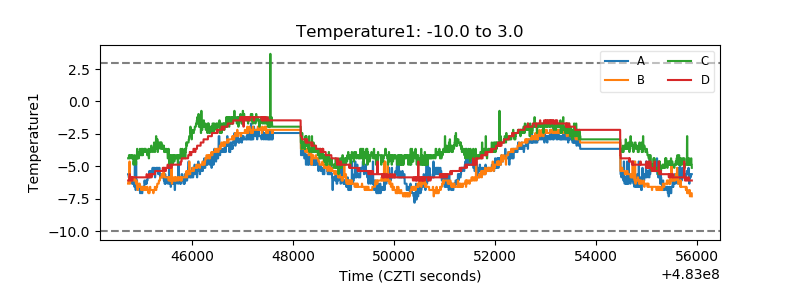 |
| Veto HV Monitor | 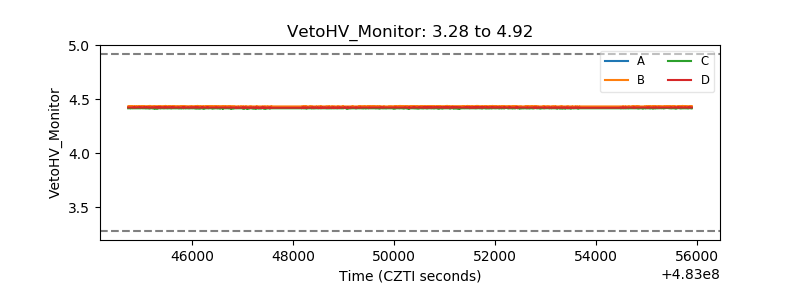 |
| Veto LLD | 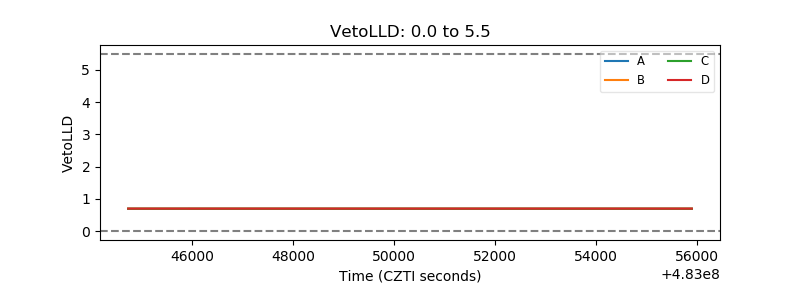 |
| Alpha Counter | 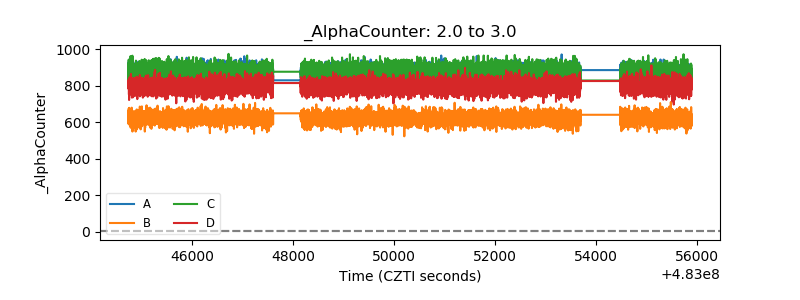 |
| _CPM_Rate | 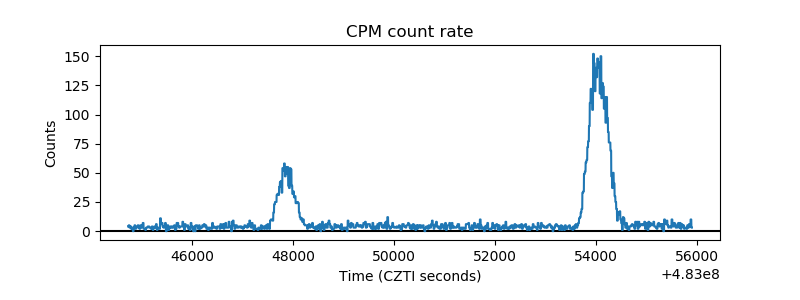 |
| CZT Counter | 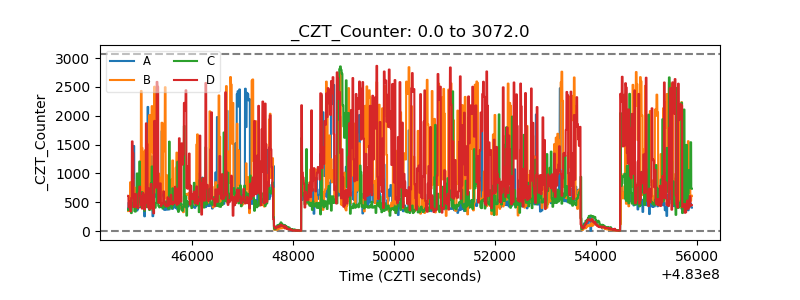 |
| +2.5 Volts monitor | 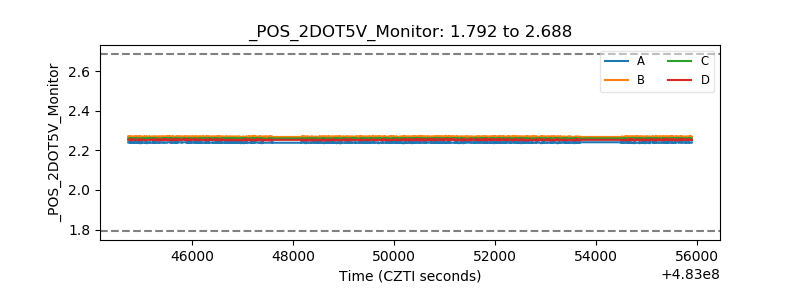 |
| +5 Volts monitor | 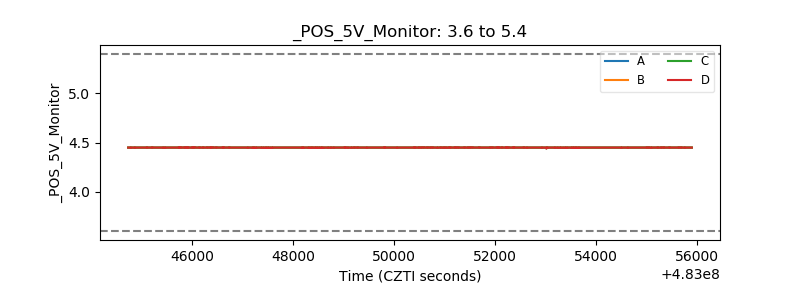 |
| _ROLL_ROT | 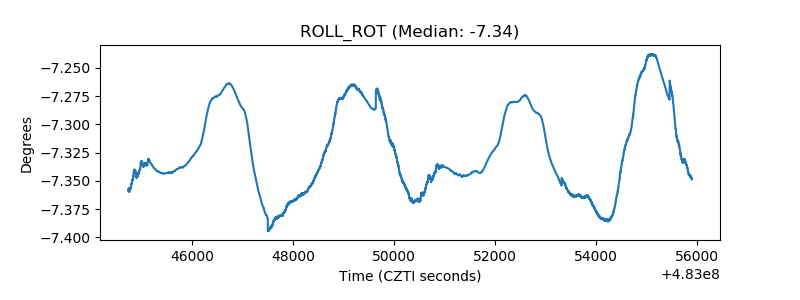 |
| _Roll_DEC | 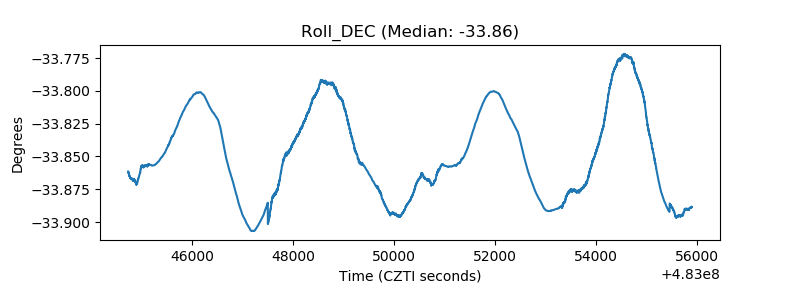 |
| _Roll_RA | 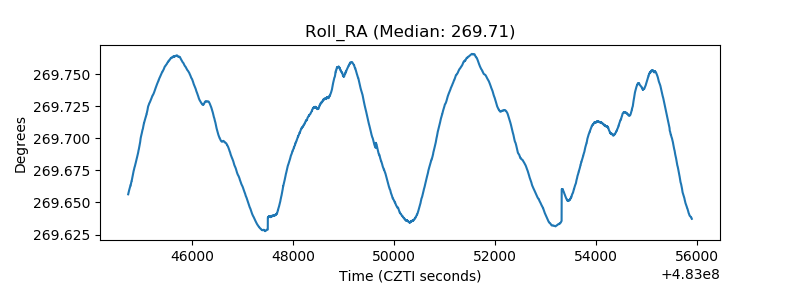 |
| Veto Counter | 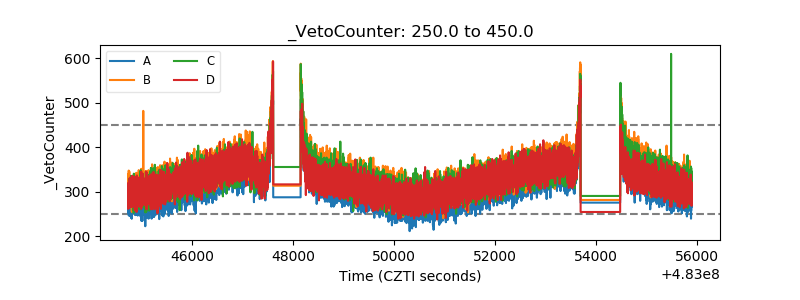 |