| Param | Original file | Final file |
|---|---|---|
| Filename | modeM0/AS1A13_090T01_9000006464_51754cztM0_level2.fits | modeM0/AS1A13_090T01_9000006464_51754cztM0_level2_quad_clean.evt |
| Size (bytes) | 1,129,749,120 | 164,577,600 |
| Size | 1.1 GB | 157.0 MB |
| Events in quadrant A | 7,120,996 | 1,133,429 |
| Events in quadrant B | 12,133,628 | 1,066,558 |
| Events in quadrant C | 6,977,905 | 1,099,092 |
| Events in quadrant D | 14,641,056 | 838,028 |
| Mode M9 | |||
|---|---|---|---|
| Quadrant | BADHDUFLAG | Total packets | Discarded packets |
| A | 0 | 22 | 0 |
| B | 0 | 23 | 0 |
| C | 0 | 23 | 0 |
| D | 0 | 23 | 0 |
| Mode SS | |||
|---|---|---|---|
| Quadrant | BADHDUFLAG | Total packets | Discarded packets |
| A | 0 | 246 | 0 |
| B | 0 | 246 | 0 |
| C | 0 | 246 | 0 |
| D | 0 | 246 | 0 |
| Mode M0 | |||
|---|---|---|---|
| Quadrant | BADHDUFLAG | Total packets | Discarded packets |
| A | 0 | 29578 | 2 |
| B | 0 | 44634 | 2 |
| C | 0 | 29257 | 2 |
| D | 0 | 51978 | 10 |
| Quadrant | Total seconds | Saturated seconds | Saturation percentage |
|---|---|---|---|
| A | 12237 | 259 | 2.116532% |
| B | 12237 | 2083 | 17.022146% |
| C | 12237 | 287 | 2.345346% |
| D | 12236 | 2705 | 22.106898% |
Noise dominated data is calculated using 1-second bins in cleaned event files. If a bin has >2000 counts, and if more than 50% of those come from <1% of pixels, then it is considered to be noise-dominated and hence unusable.
| Quadrant | # 1 sec bins | Bins with >0 counts | Bins with >2000 counts | High rate bins dominated by noise | Noise dominated (total time) | Noise dominated (detector-on time) | Marked lightcurve |
|---|---|---|---|---|---|---|---|
| A | 14209 | 12239 | 129 | 129 | 0.91% | 1.05% | 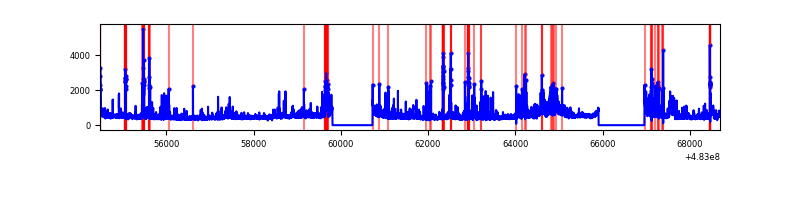 |
| B | 14209 | 12239 | 1299 | 1299 | 9.14% | 10.61% | 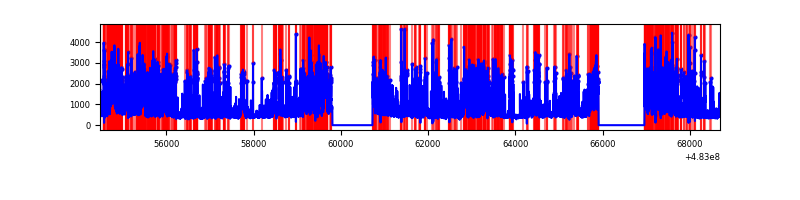 |
| C | 14209 | 12239 | 221 | 221 | 1.56% | 1.81% | 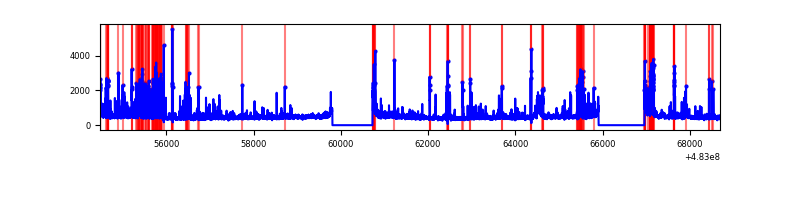 |
| D | 14208 | 12238 | 2297 | 2297 | 16.17% | 18.77% | 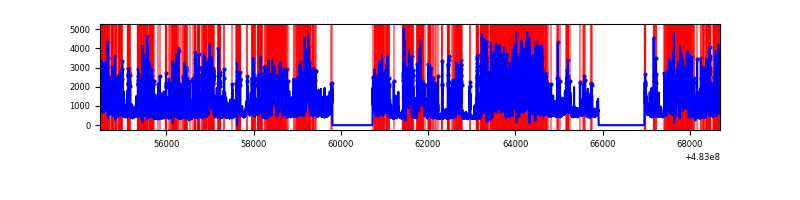 |
Top three noisy pixels from each quadrant. If the there are fewer than three noisy pixels in the level2.evt file, extra rows are filled as -1
| Pixel properties | Quadrant properties | ||||||
|---|---|---|---|---|---|---|---|
| Quadrant | DetID | PixID | Counts | Sigma | Mean | Median | Sigma |
| A | 12 | 3 | 566535 | 1767.44 | 1295 | 1264 | 319.8 |
| A | 4 | 3 | 233829 | 727.16 | 1295 | 1264 | 319.8 |
| A | 5 | 240 | 145583 | 451.24 | 1295 | 1264 | 319.8 |
| B | 4 | 206 | 5417788 | 20926.61 | 1213 | 1171 | 258.8 |
| B | 7 | 0 | 512078 | 1973.84 | 1213 | 1171 | 258.8 |
| B | 8 | 128 | 438253 | 1688.63 | 1213 | 1171 | 258.8 |
| C | 13 | 3 | 352155 | 1005.99 | 1274 | 1268 | 348.8 |
| C | 1 | 243 | 331225 | 945.98 | 1274 | 1268 | 348.8 |
| C | 9 | 38 | 222355 | 633.85 | 1274 | 1268 | 348.8 |
| D | 11 | 129 | 8493699 | 26604.5 | 1141 | 1099 | 319.2 |
| D | 8 | 176 | 582429 | 1821.11 | 1141 | 1099 | 319.2 |
| D | 3 | 12 | 295252 | 921.48 | 1141 | 1099 | 319.2 |
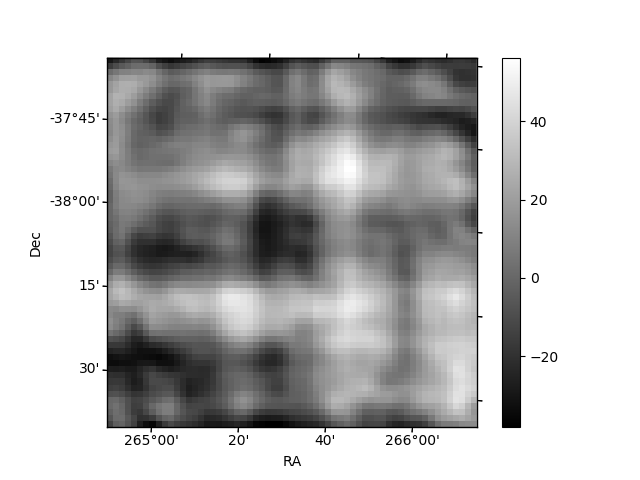
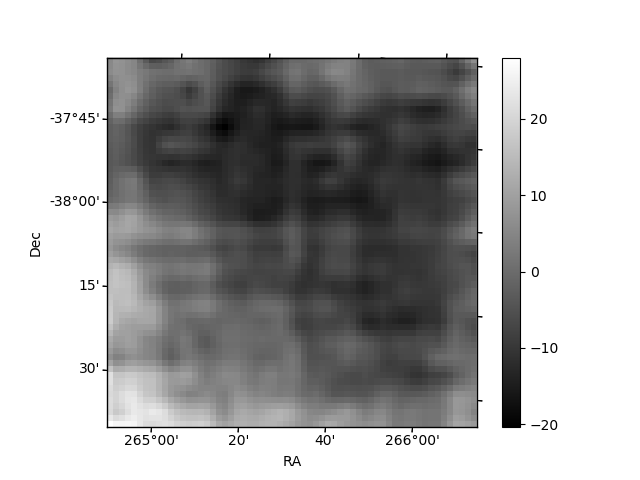
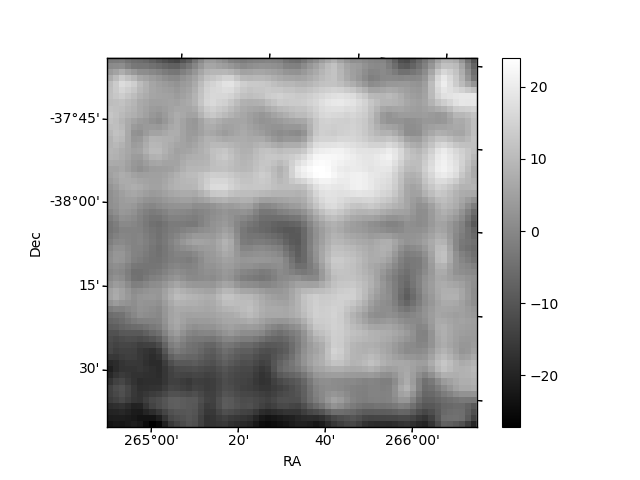
Histogram calculated using DETX and DETY for each event in the final _common_clean file
| Quadrant A | 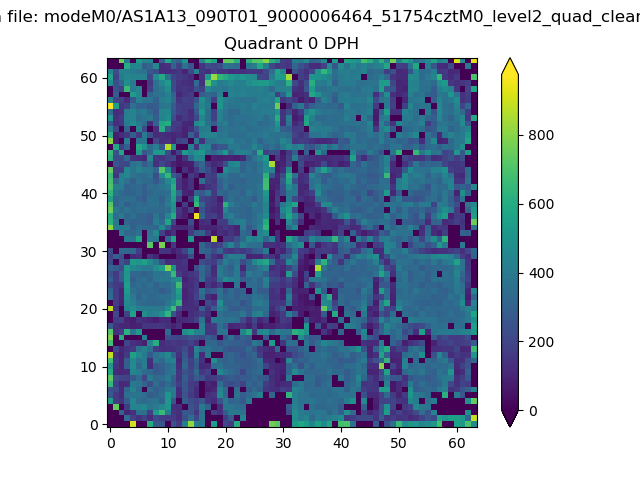 |
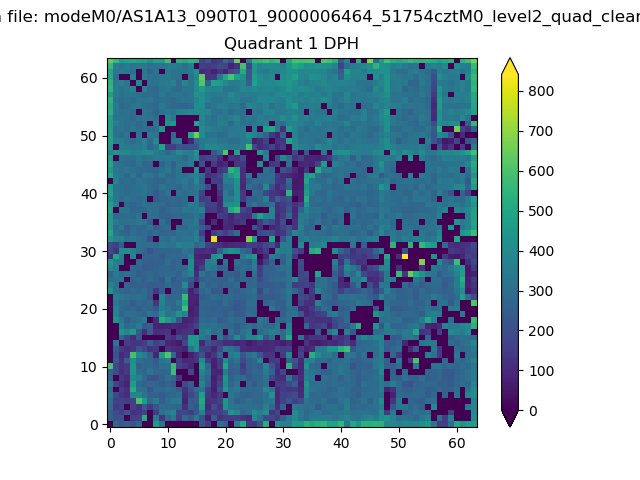 |
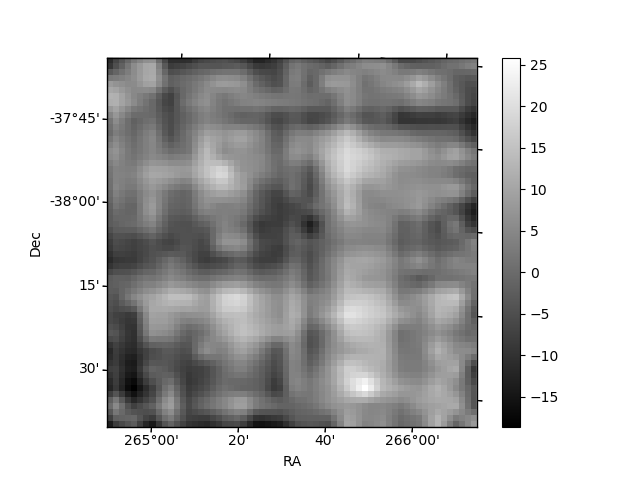
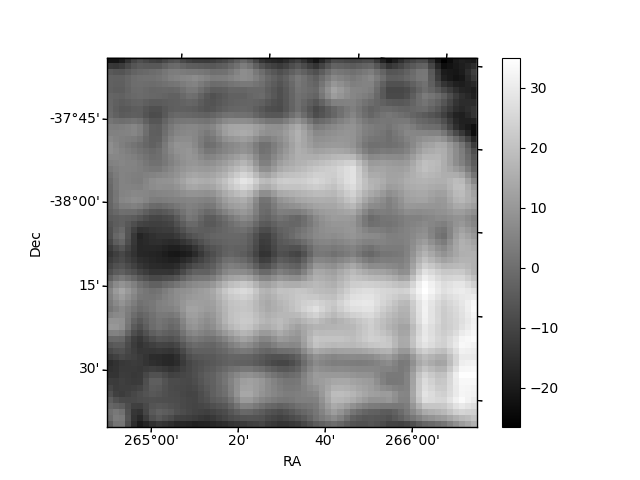
Quadrant B |
|---|---|---|---|
| Quadrant D | 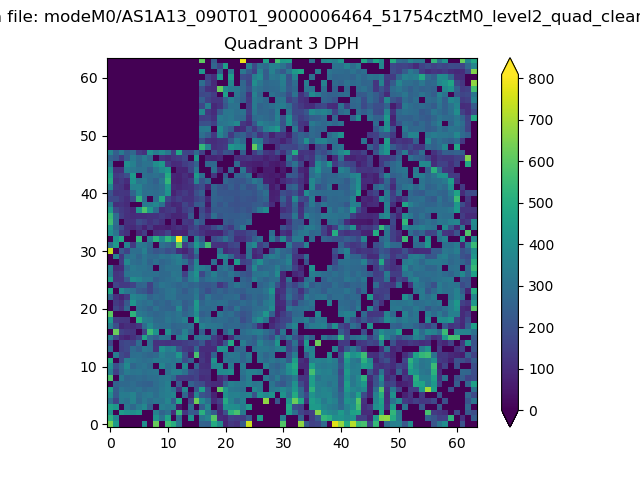 |
 |
Quadrant C |
| Plot type | Count rate plots | Images |
|---|---|---|
| Comparison with Poisson distribution Blue bars denote a histogram of data divided into 1 sec bins. Red curve is a Poisson curve with rate = median count rate of data. |
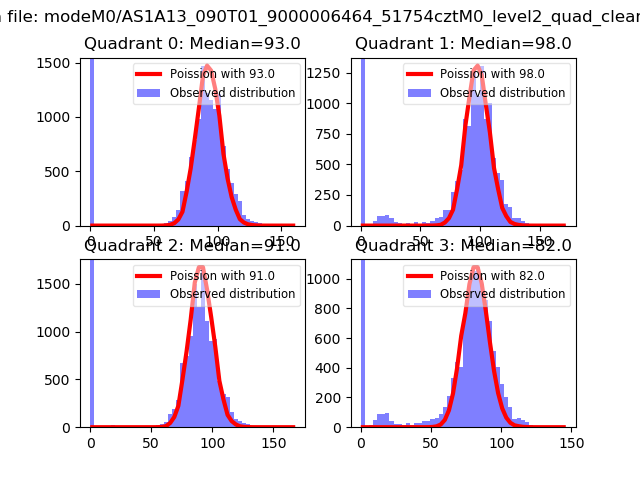 |
 |
| Quadrant-wise count rates Data is divided into 100 sec bins |
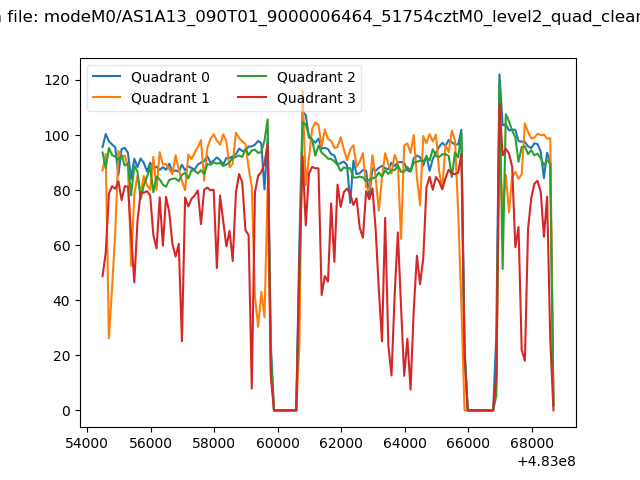 |
|
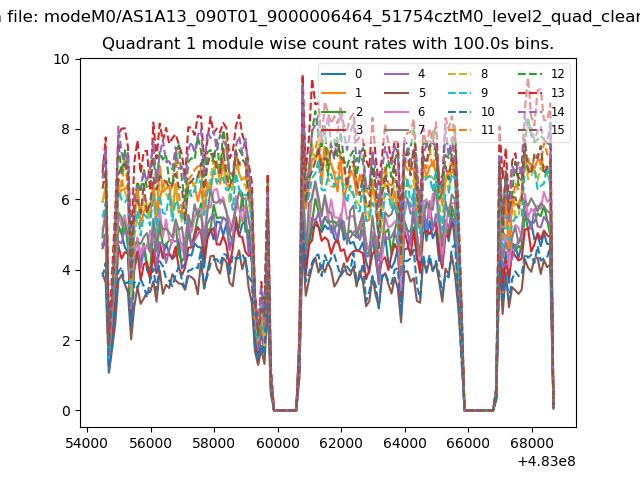
| Module-wise count rates for Quadrant A Data is divided into 100 sec bins |
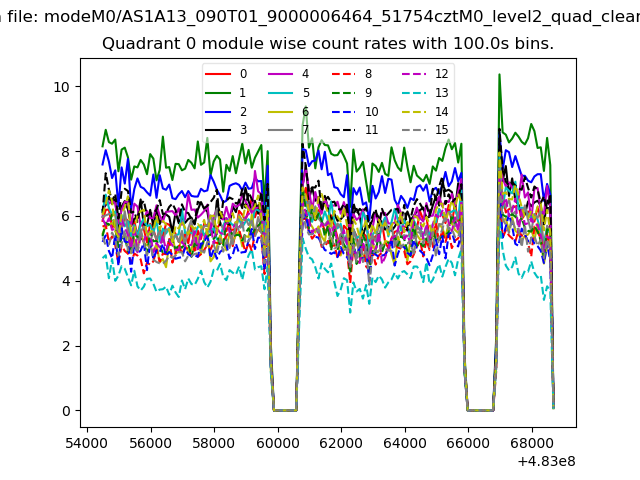 |
 |
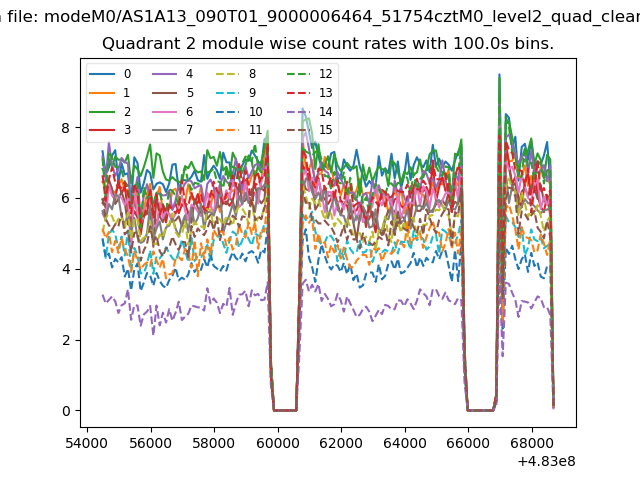
| Module-wise count rates for Quadrant B Data is divided into 100 sec bins |
 |
 |
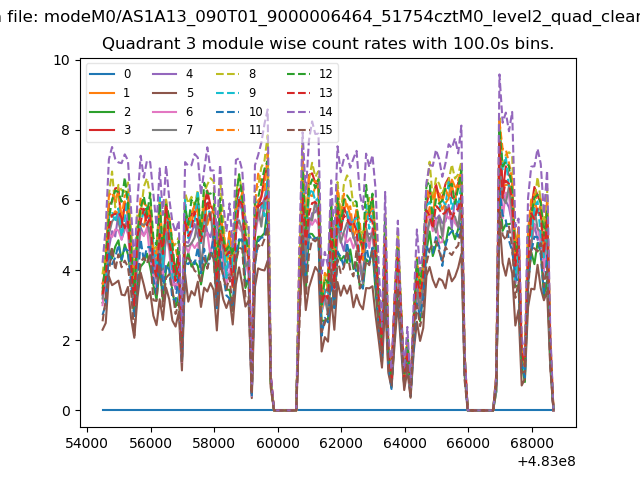
| Module-wise count rates for Quadrant C Data is divided into 100 sec bins |
 |
 |
| Module-wise count rates for Quadrant D Data is divided into 100 sec bins |
 |
 |
| Parameter | Plot |
|---|---|
| CZT HV Monitor | 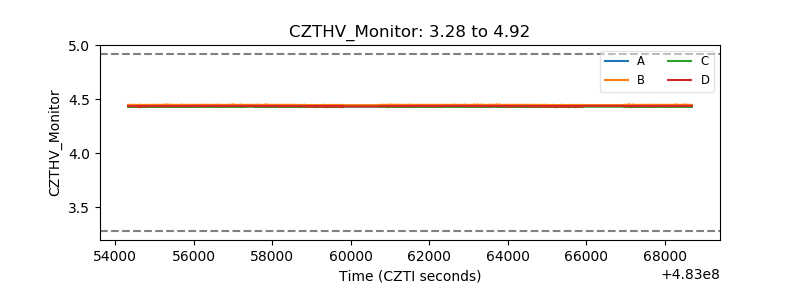 |
| D_VDD | 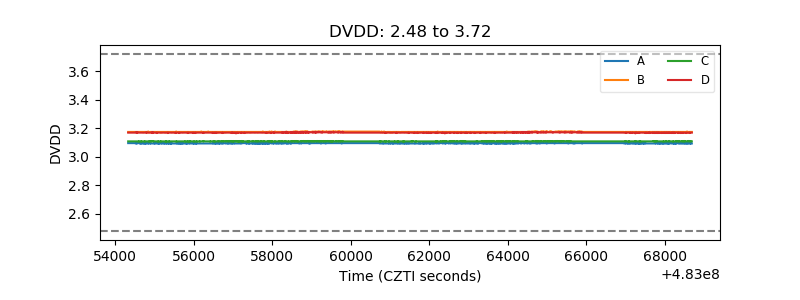 |
| Temperature 1 | 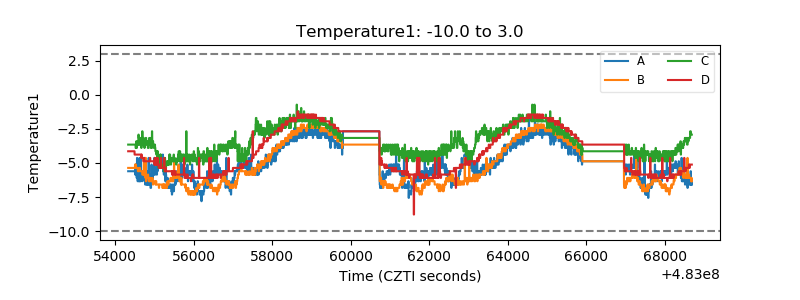 |
| Veto HV Monitor | 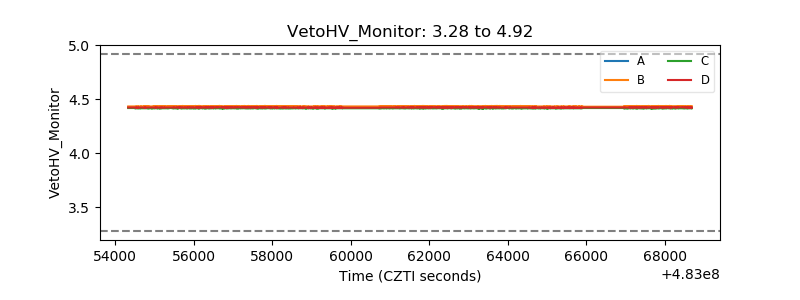 |
| Veto LLD | 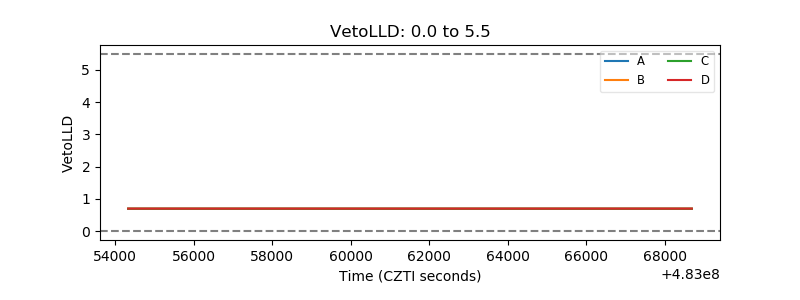 |
| Alpha Counter | 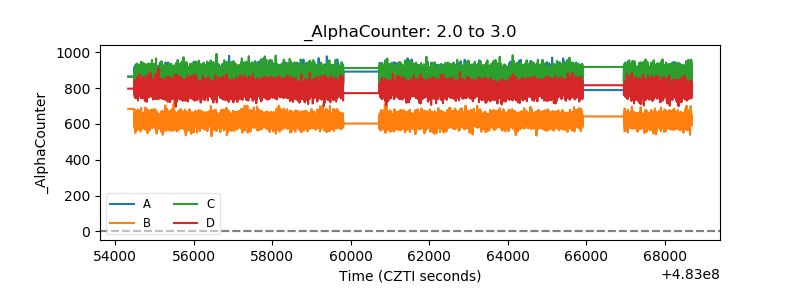 |
| _CPM_Rate | 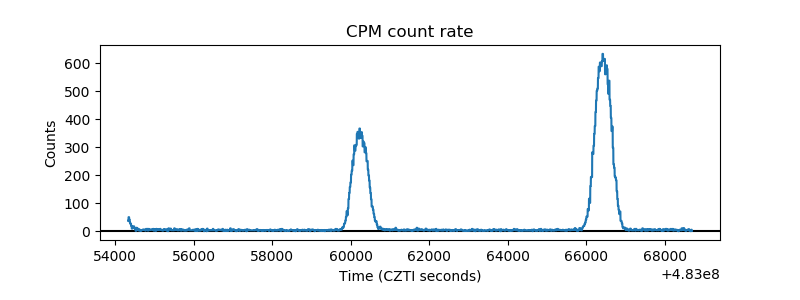 |
| CZT Counter | 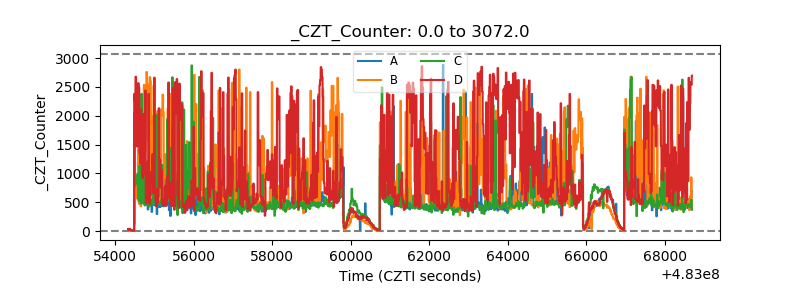 |
| +2.5 Volts monitor | 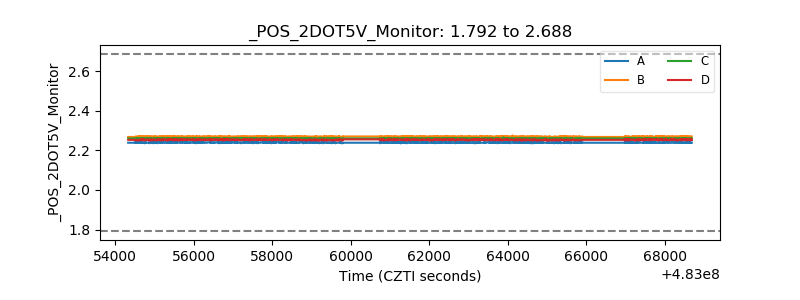 |
| +5 Volts monitor | 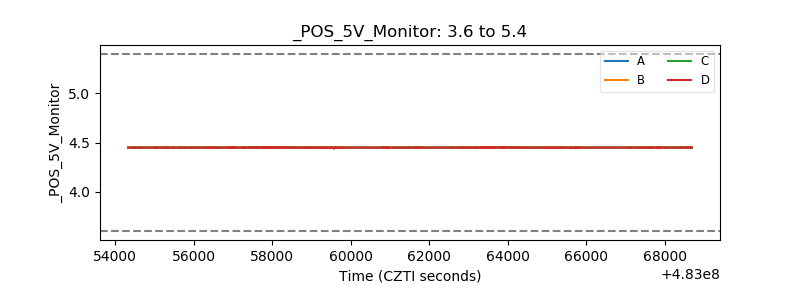 |
| _ROLL_ROT | 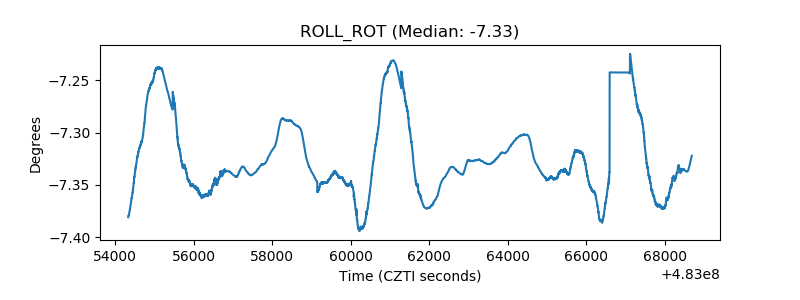 |
| _Roll_DEC | 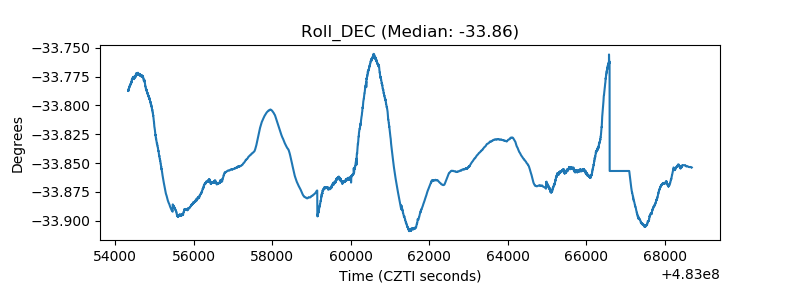 |
| _Roll_RA | 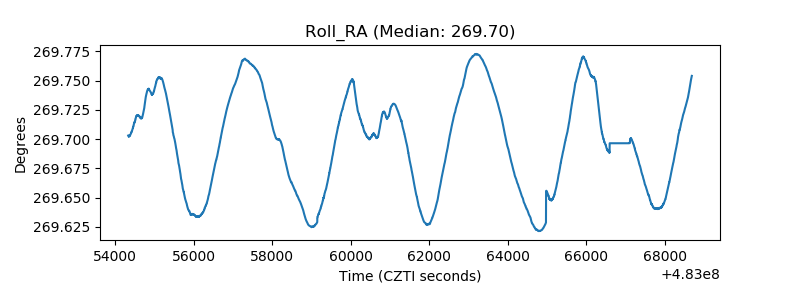 |
| Veto Counter | 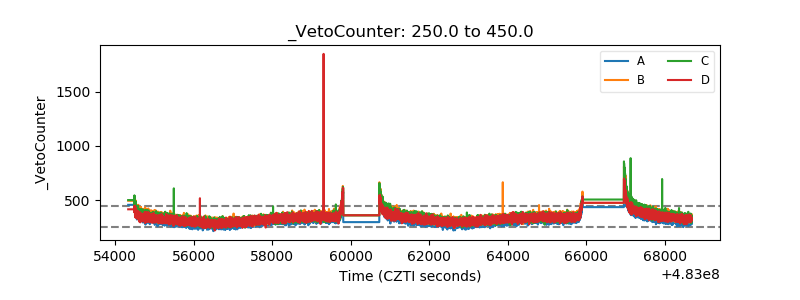 |