| Param | Original file | Final file |
|---|---|---|
| Filename | modeM0/AS1A13_090T01_9000006464_51755cztM0_level2.fits | modeM0/AS1A13_090T01_9000006464_51755cztM0_level2_quad_clean.evt |
| Size (bytes) | 591,773,760 | 95,843,520 |
| Size | 564.4 MB | 91.4 MB |
| Events in quadrant A | 4,028,202 | 650,334 |
| Events in quadrant B | 5,663,291 | 654,392 |
| Events in quadrant C | 4,224,942 | 624,625 |
| Events in quadrant D | 7,470,358 | 506,513 |
| Mode M9 | |||
|---|---|---|---|
| Quadrant | BADHDUFLAG | Total packets | Discarded packets |
| A | 0 | 12 | 0 |
| B | 0 | 12 | 0 |
| C | 0 | 12 | 0 |
| D | 0 | 12 | 0 |
| Mode SS | |||
|---|---|---|---|
| Quadrant | BADHDUFLAG | Total packets | Discarded packets |
| A | 0 | 134 | 0 |
| B | 0 | 134 | 0 |
| C | 0 | 134 | 0 |
| D | 0 | 134 | 0 |
| Mode M0 | |||
|---|---|---|---|
| Quadrant | BADHDUFLAG | Total packets | Discarded packets |
| A | 0 | 16433 | 2 |
| B | 0 | 21470 | 2 |
| C | 0 | 16999 | 2 |
| D | 0 | 26773 | 2 |
| Quadrant | Total seconds | Saturated seconds | Saturation percentage |
|---|---|---|---|
| A | 6691 | 108 | 1.614109% |
| B | 6691 | 759 | 11.343596% |
| C | 6692 | 261 | 3.900179% |
| D | 6692 | 1195 | 17.857143% |
Noise dominated data is calculated using 1-second bins in cleaned event files. If a bin has >2000 counts, and if more than 50% of those come from <1% of pixels, then it is considered to be noise-dominated and hence unusable.
| Quadrant | # 1 sec bins | Bins with >0 counts | Bins with >2000 counts | High rate bins dominated by noise | Noise dominated (total time) | Noise dominated (detector-on time) | Marked lightcurve |
|---|---|---|---|---|---|---|---|
| A | 7856 | 6692 | 44 | 44 | 0.56% | 0.66% | 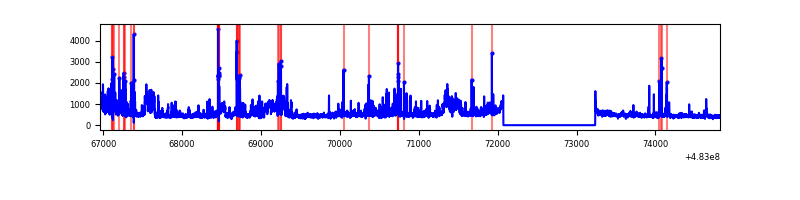 |
| B | 7856 | 6691 | 479 | 479 | 6.10% | 7.16% | 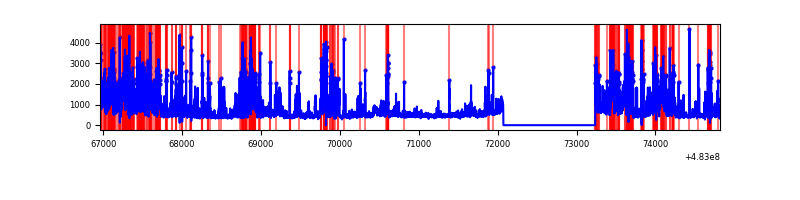 |
| C | 7857 | 6693 | 173 | 173 | 2.20% | 2.58% | 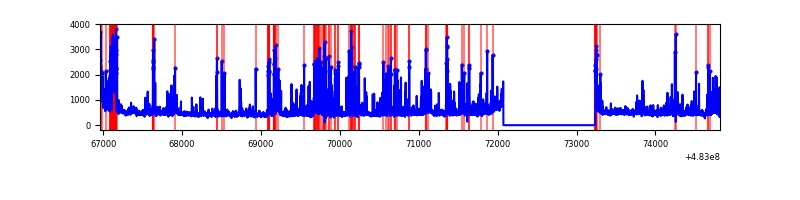 |
| D | 7857 | 6693 | 1035 | 1035 | 13.17% | 15.46% | 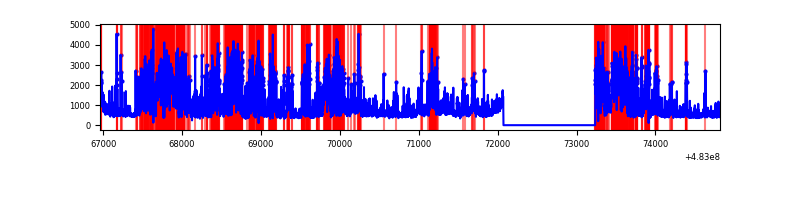 |
Top three noisy pixels from each quadrant. If the there are fewer than three noisy pixels in the level2.evt file, extra rows are filled as -1
| Pixel properties | Quadrant properties | ||||||
|---|---|---|---|---|---|---|---|
| Quadrant | DetID | PixID | Counts | Sigma | Mean | Median | Sigma |
| A | 12 | 3 | 444417 | 2460.48 | 728 | 711 | 180.3 |
| A | 15 | 174 | 112774 | 621.42 | 728 | 711 | 180.3 |
| A | 9 | 160 | 101939 | 561.34 | 728 | 711 | 180.3 |
| B | 4 | 206 | 1750717 | 11763.22 | 698 | 674 | 148.8 |
| B | 7 | 0 | 585430 | 3930.54 | 698 | 674 | 148.8 |
| B | 10 | 41 | 139459 | 932.87 | 698 | 674 | 148.8 |
| C | 15 | 230 | 426464 | 2162.29 | 715 | 710 | 196.9 |
| C | 1 | 243 | 166625 | 842.64 | 715 | 710 | 196.9 |
| C | 13 | 3 | 148916 | 752.7 | 715 | 710 | 196.9 |
| D | 11 | 129 | 4108061 | 22300.18 | 659 | 636 | 184.2 |
| D | 8 | 176 | 290993 | 1576.42 | 659 | 636 | 184.2 |
| D | 10 | 181 | 208289 | 1127.4 | 659 | 636 | 184.2 |
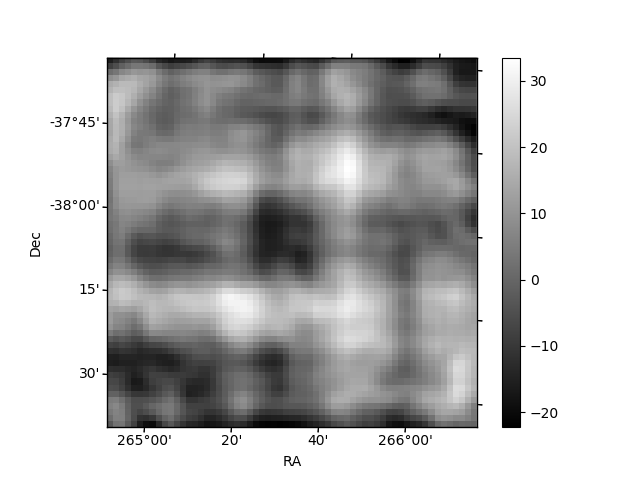
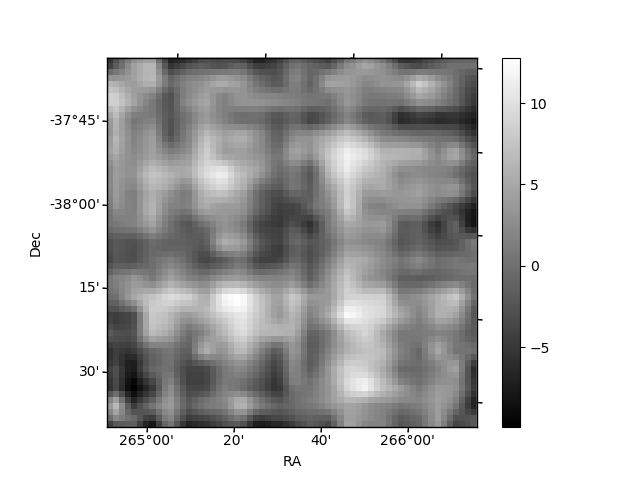
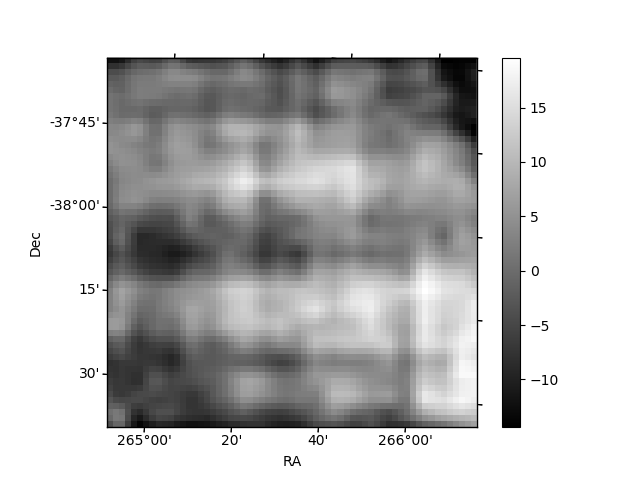
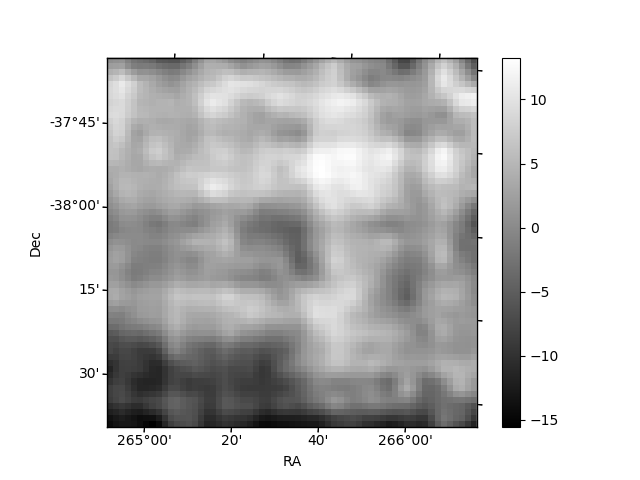
Histogram calculated using DETX and DETY for each event in the final _common_clean file
| Quadrant A | 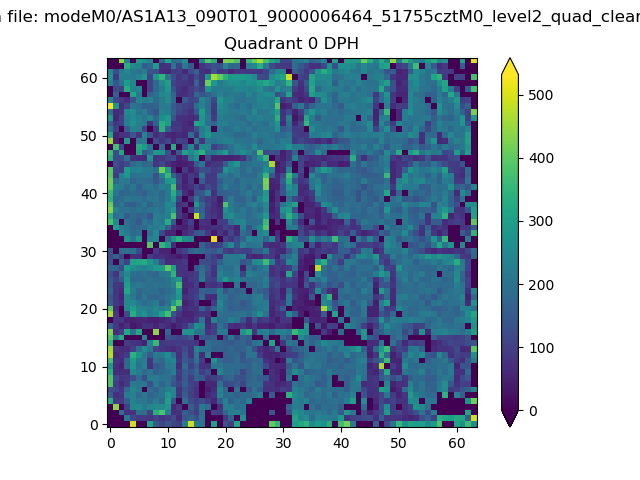 |
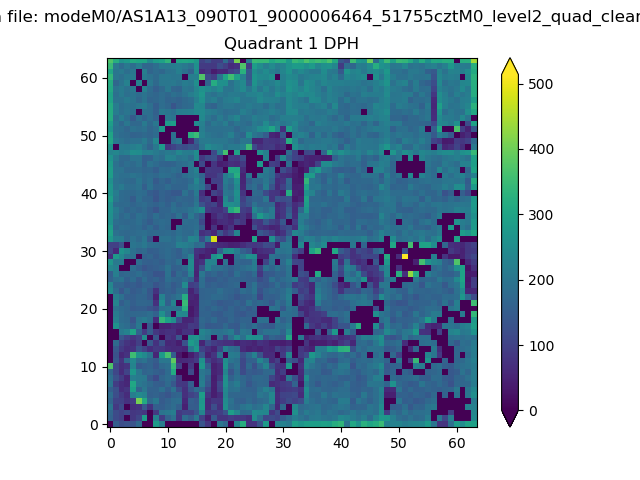 |
Quadrant B |
|---|---|---|---|
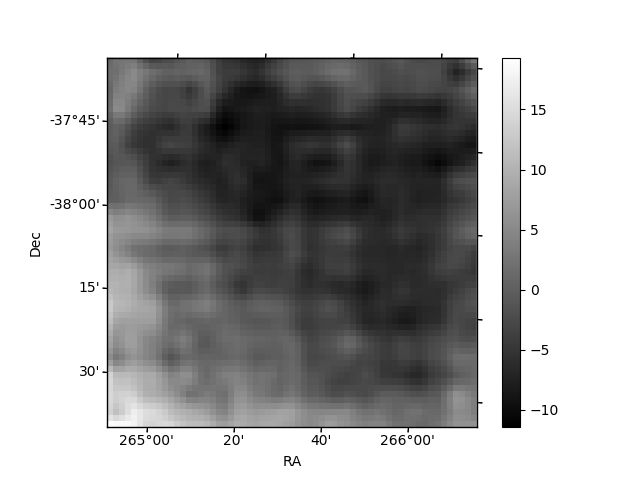
| Quadrant D | 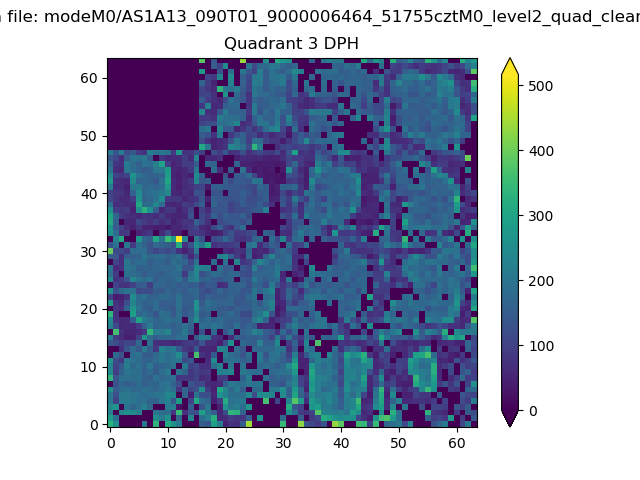 |
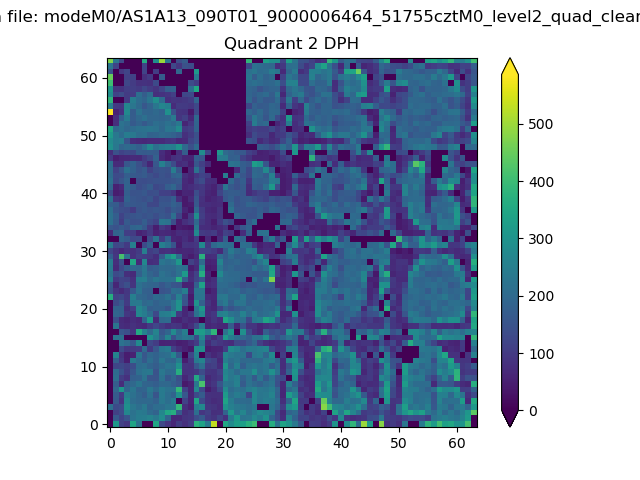 |
Quadrant C |
| Plot type | Count rate plots | Images |
|---|---|---|
| Comparison with Poisson distribution Blue bars denote a histogram of data divided into 1 sec bins. Red curve is a Poisson curve with rate = median count rate of data. |
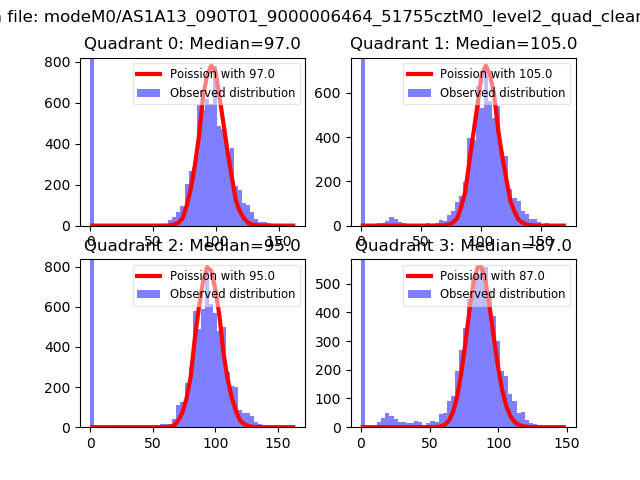 |
 |
| Quadrant-wise count rates Data is divided into 100 sec bins |
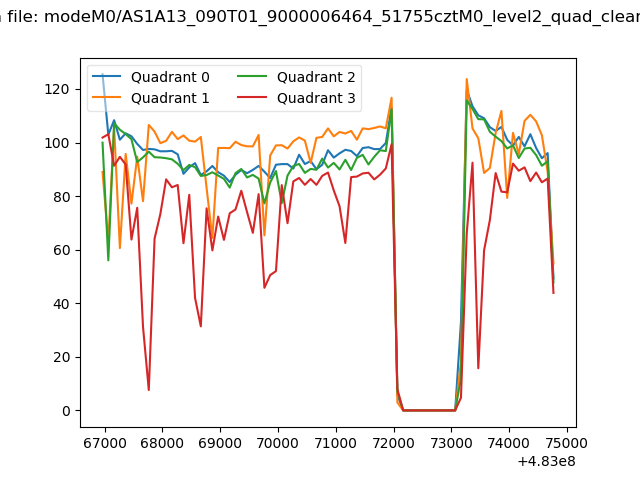 |
|
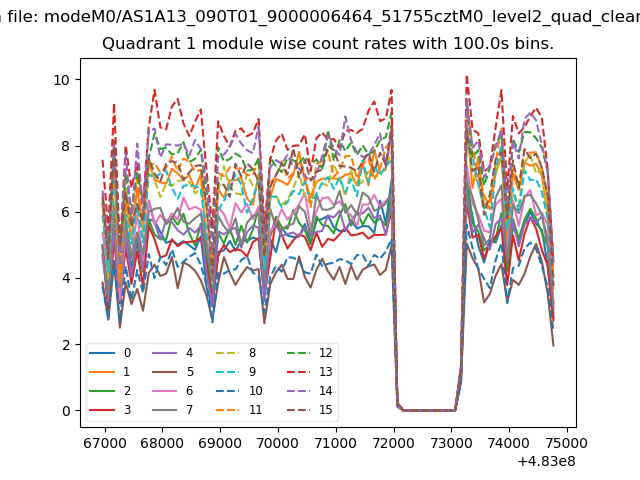
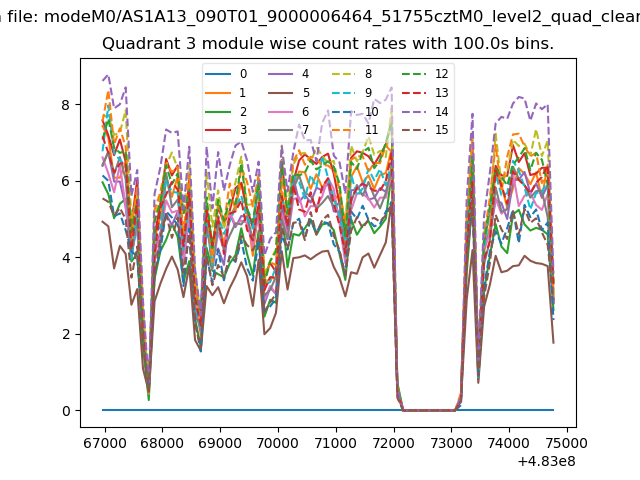
| Module-wise count rates for Quadrant A Data is divided into 100 sec bins |
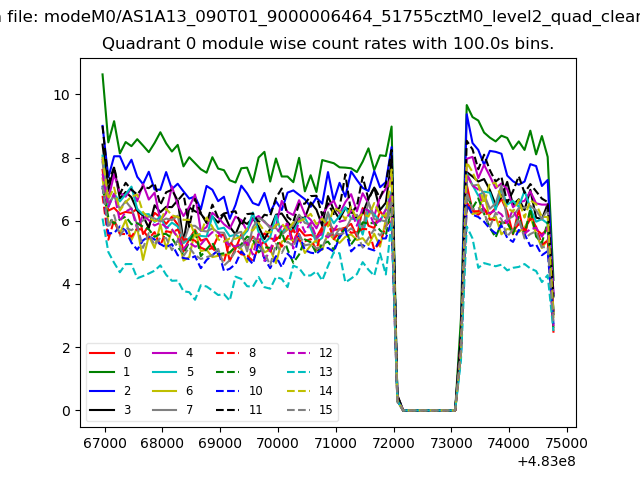 |
 |
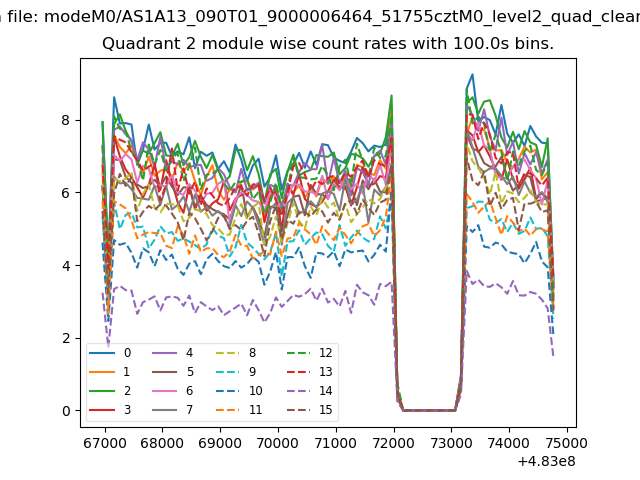
| Module-wise count rates for Quadrant B Data is divided into 100 sec bins |
 |
 |
| Module-wise count rates for Quadrant C Data is divided into 100 sec bins |
 |
 |
| Module-wise count rates for Quadrant D Data is divided into 100 sec bins |
 |
 |
| Parameter | Plot |
|---|---|
| CZT HV Monitor | 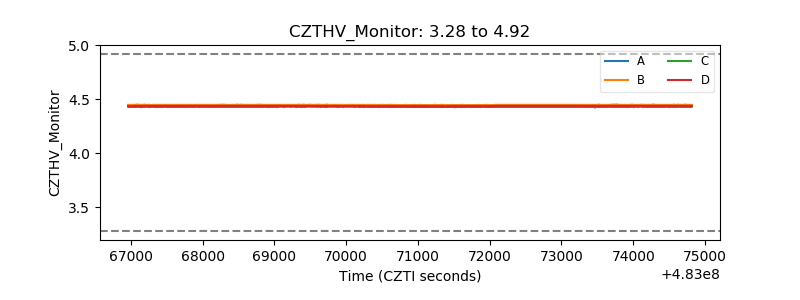 |
| D_VDD | 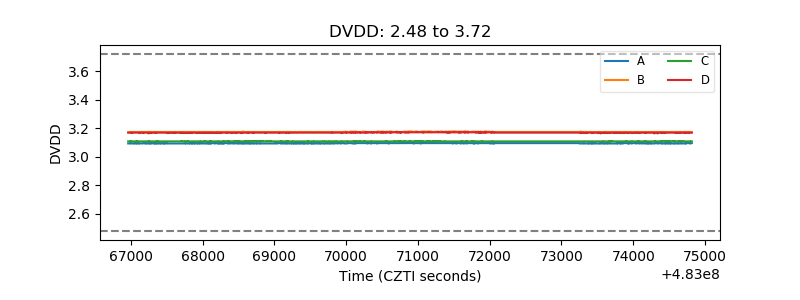 |
| Temperature 1 | 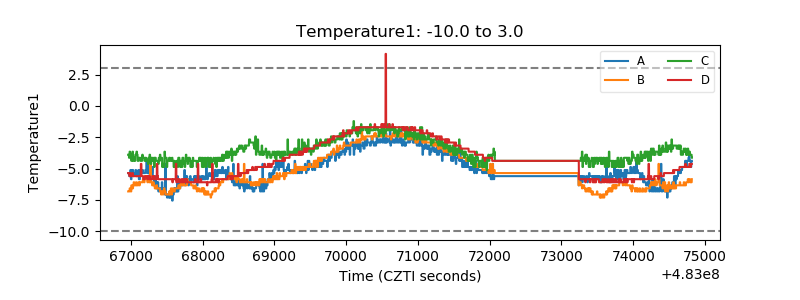 |
| Veto HV Monitor | 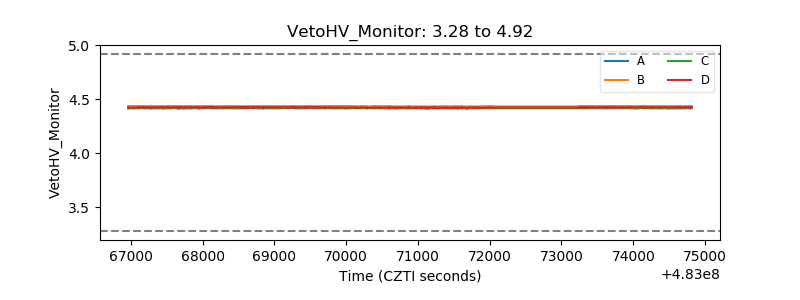 |
| Veto LLD | 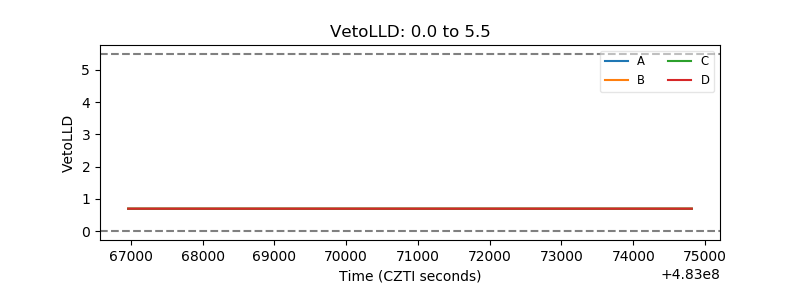 |
| Alpha Counter | 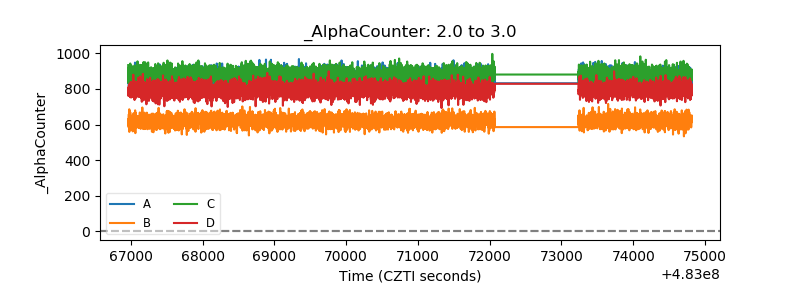 |
| _CPM_Rate | 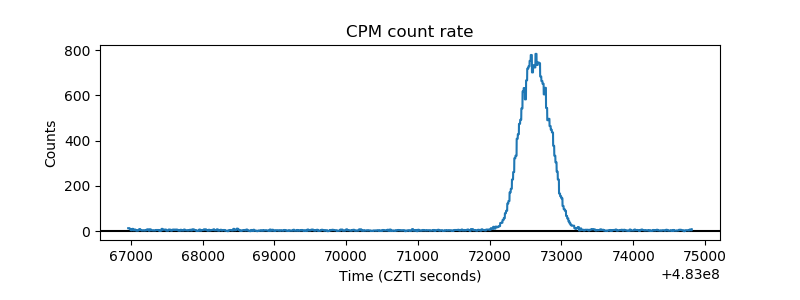 |
| CZT Counter | 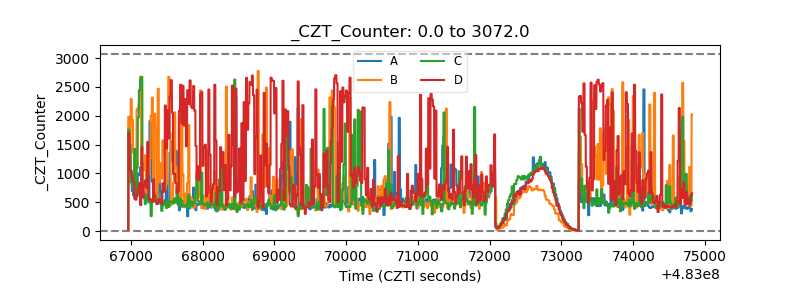 |
| +2.5 Volts monitor | 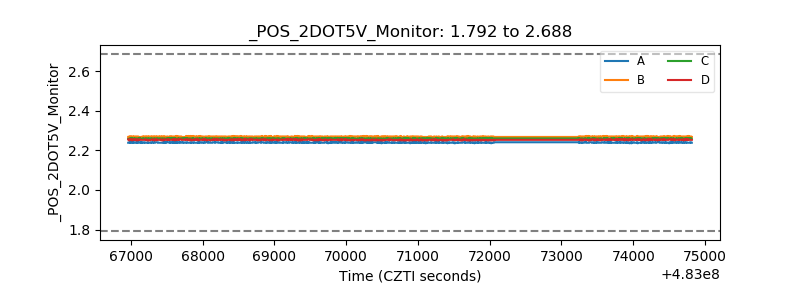 |
| +5 Volts monitor | 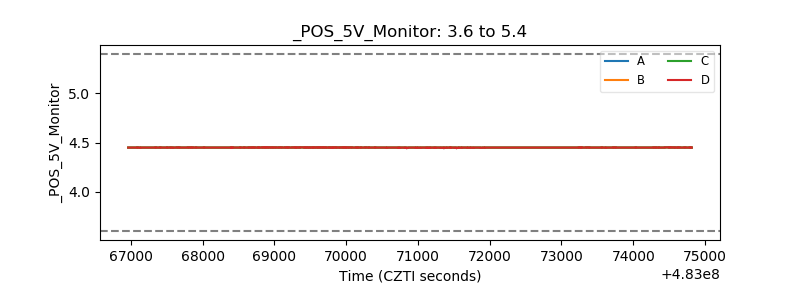 |
| _ROLL_ROT | 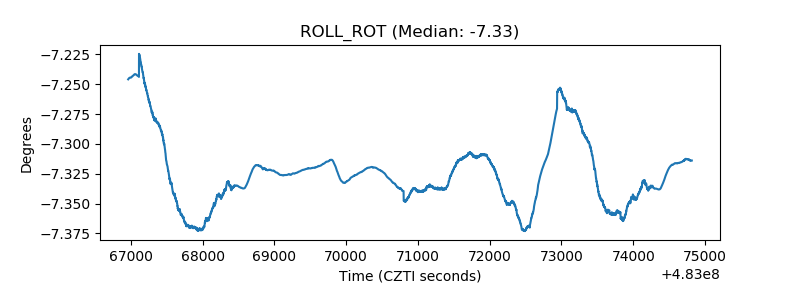 |
| _Roll_DEC | 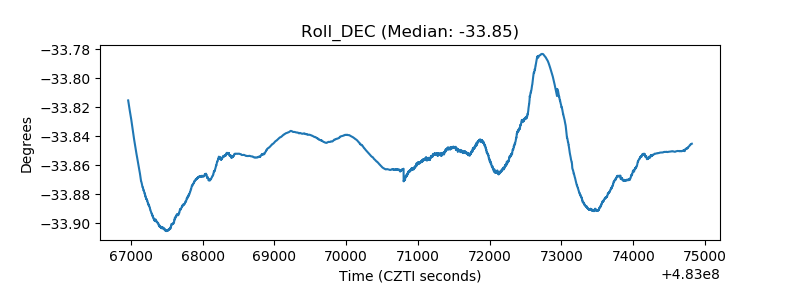 |
| _Roll_RA | 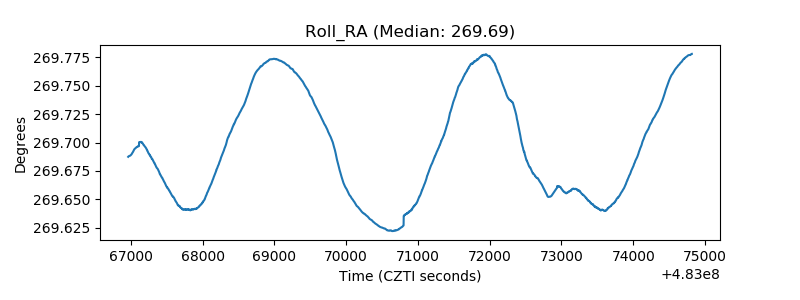 |
| Veto Counter | 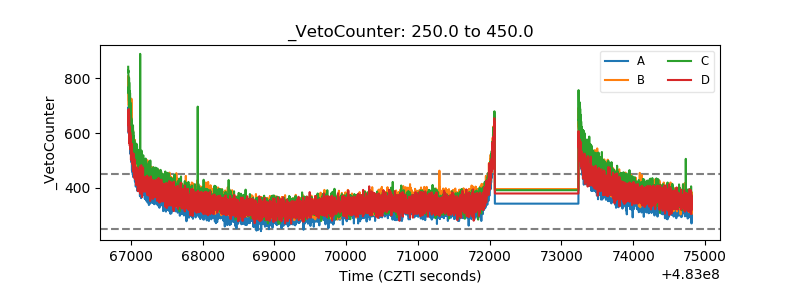 |