| Param | Original file | Final file |
|---|---|---|
| Filename | modeM0/AS1A13_090T01_9000006464_51756cztM0_level2.fits | modeM0/AS1A13_090T01_9000006464_51756cztM0_level2_quad_clean.evt |
| Size (bytes) | 628,660,800 | 89,663,040 |
| Size | 599.5 MB | 85.5 MB |
| Events in quadrant A | 3,513,569 | 636,999 |
| Events in quadrant B | 7,396,335 | 574,406 |
| Events in quadrant C | 5,119,037 | 561,600 |
| Events in quadrant D | 6,747,324 | 497,048 |
| Mode M9 | |||
|---|---|---|---|
| Quadrant | BADHDUFLAG | Total packets | Discarded packets |
| A | 0 | 12 | 0 |
| B | 0 | 12 | 0 |
| C | 0 | 12 | 0 |
| D | 0 | 12 | 0 |
| Mode SS | |||
|---|---|---|---|
| Quadrant | BADHDUFLAG | Total packets | Discarded packets |
| A | 0 | 128 | 0 |
| B | 0 | 128 | 0 |
| C | 0 | 128 | 0 |
| D | 0 | 128 | 0 |
| Mode M0 | |||
|---|---|---|---|
| Quadrant | BADHDUFLAG | Total packets | Discarded packets |
| A | 0 | 14775 | 2 |
| B | 0 | 26409 | 2 |
| C | 0 | 19455 | 2 |
| D | 0 | 24372 | 2 |
| Quadrant | Total seconds | Saturated seconds | Saturation percentage |
|---|---|---|---|
| A | 6380 | 52 | 0.815047% |
| B | 6380 | 1423 | 22.304075% |
| C | 6381 | 722 | 11.314841% |
| D | 6381 | 1108 | 17.364050% |
Noise dominated data is calculated using 1-second bins in cleaned event files. If a bin has >2000 counts, and if more than 50% of those come from <1% of pixels, then it is considered to be noise-dominated and hence unusable.
| Quadrant | # 1 sec bins | Bins with >0 counts | Bins with >2000 counts | High rate bins dominated by noise | Noise dominated (total time) | Noise dominated (detector-on time) | Marked lightcurve |
|---|---|---|---|---|---|---|---|
| A | 7555 | 6383 | 17 | 17 | 0.23% | 0.27% | 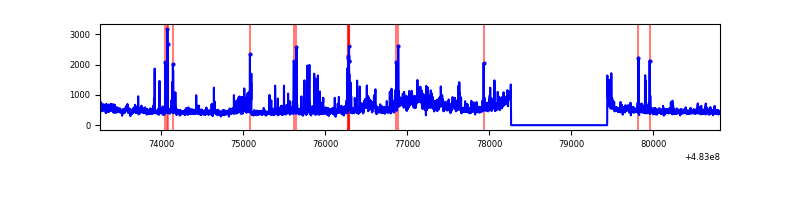 |
| B | 7555 | 6382 | 976 | 976 | 12.92% | 15.29% | 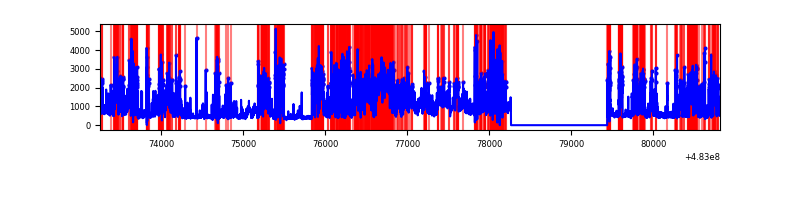 |
| C | 7556 | 6383 | 497 | 497 | 6.58% | 7.79% |  |
| D | 7556 | 6384 | 932 | 932 | 12.33% | 14.60% | 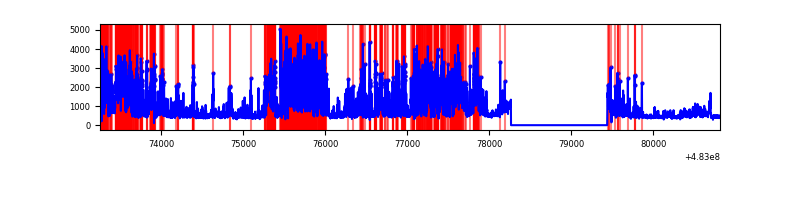 |
Top three noisy pixels from each quadrant. If the there are fewer than three noisy pixels in the level2.evt file, extra rows are filled as -1
| Pixel properties | Quadrant properties | ||||||
|---|---|---|---|---|---|---|---|
| Quadrant | DetID | PixID | Counts | Sigma | Mean | Median | Sigma |
| A | 12 | 3 | 191632 | 1091.49 | 709 | 693 | 174.9 |
| A | 4 | 3 | 87338 | 495.3 | 709 | 693 | 174.9 |
| A | 11 | 3 | 73501 | 416.2 | 709 | 693 | 174.9 |
| B | 4 | 206 | 3806058 | 27687.02 | 640 | 618 | 137.4 |
| B | 7 | 0 | 455448 | 3309.18 | 640 | 618 | 137.4 |
| B | 5 | 185 | 111085 | 803.72 | 640 | 618 | 137.4 |
| C | 15 | 230 | 1786143 | 9757.08 | 661 | 655 | 183.0 |
| C | 14 | 96 | 245581 | 1338.43 | 661 | 655 | 183.0 |
| C | 2 | 207 | 126482 | 687.6 | 661 | 655 | 183.0 |
| D | 11 | 129 | 3264054 | 18166.63 | 642 | 617 | 179.6 |
| D | 8 | 176 | 597612 | 3323.3 | 642 | 617 | 179.6 |
| D | 2 | 249 | 98443 | 544.57 | 642 | 617 | 179.6 |
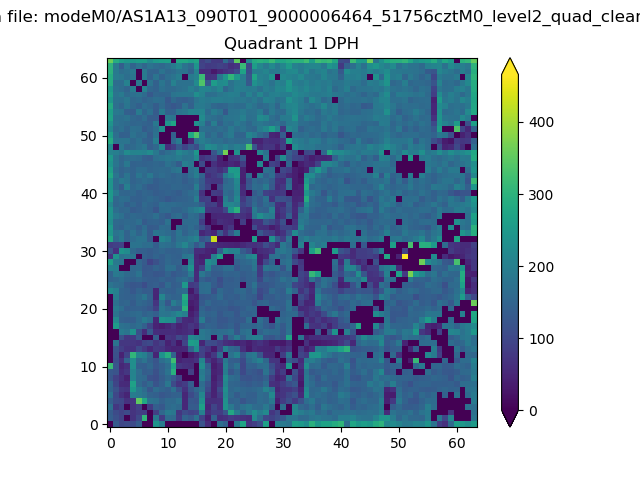
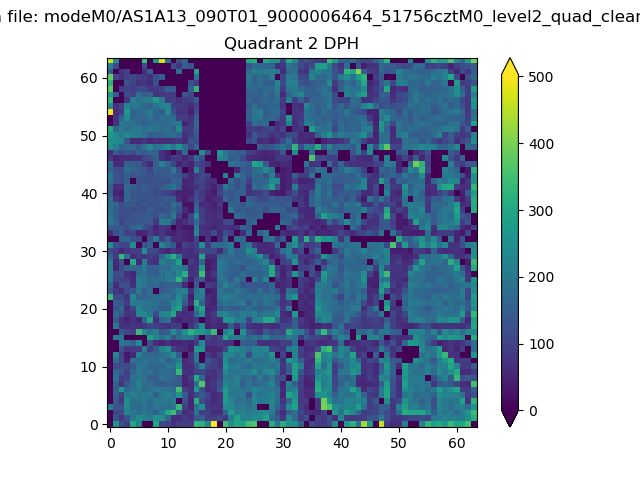
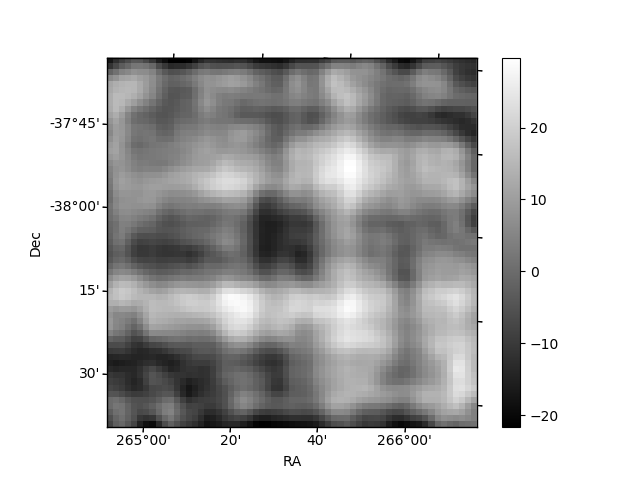
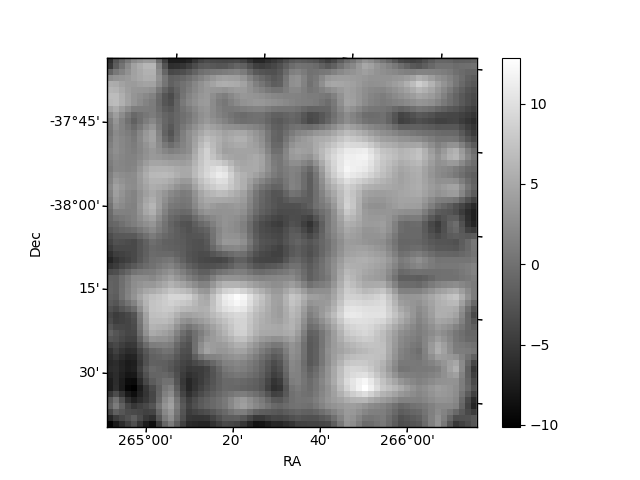
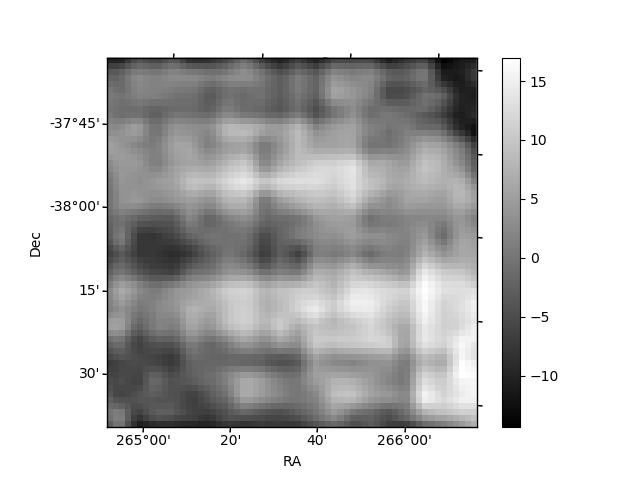
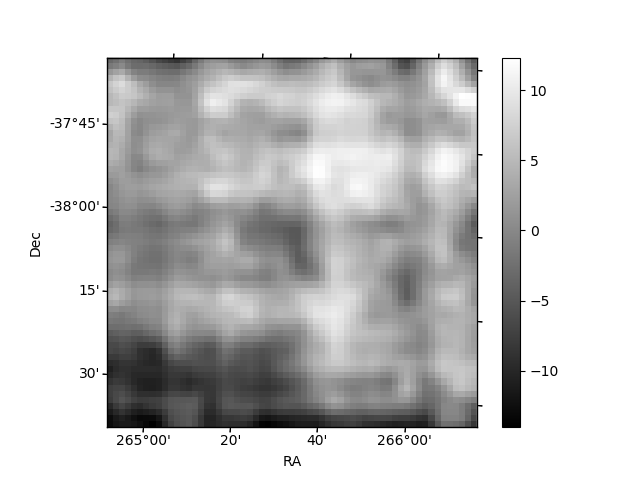
Histogram calculated using DETX and DETY for each event in the final _common_clean file
| Quadrant A | 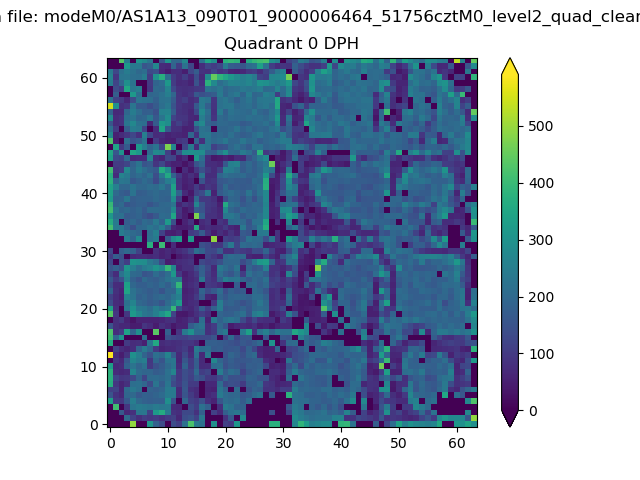 |
 |
Quadrant B |
|---|---|---|---|
| Quadrant D | 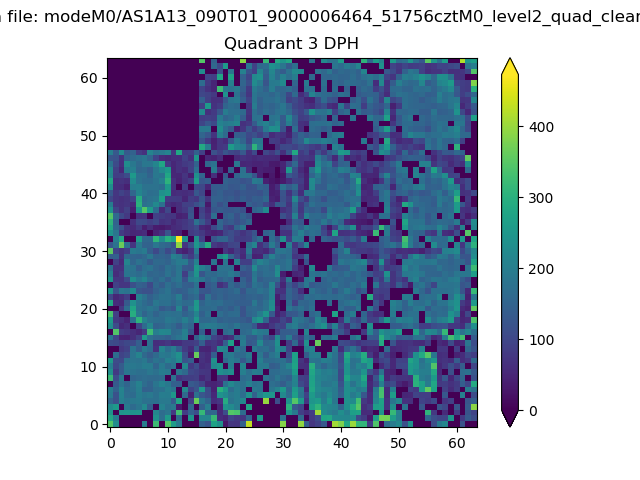 |
 |
Quadrant C |
| Plot type | Count rate plots | Images |
|---|---|---|
| Comparison with Poisson distribution Blue bars denote a histogram of data divided into 1 sec bins. Red curve is a Poisson curve with rate = median count rate of data. |
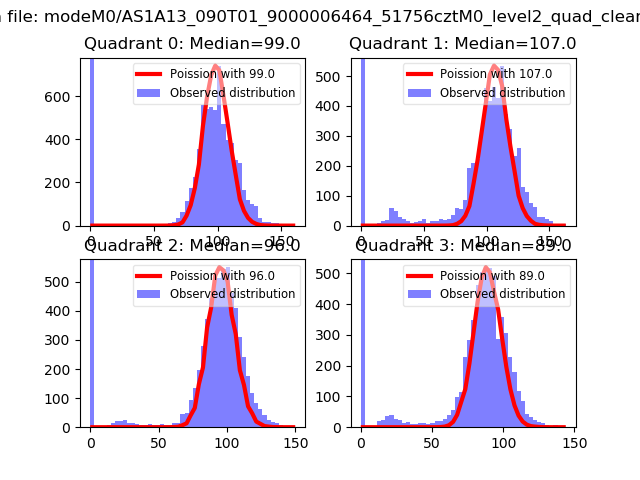 |
 |
| Quadrant-wise count rates Data is divided into 100 sec bins |
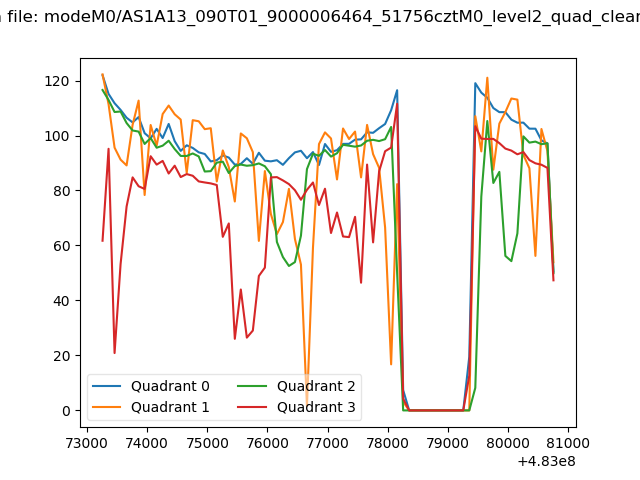 |
|
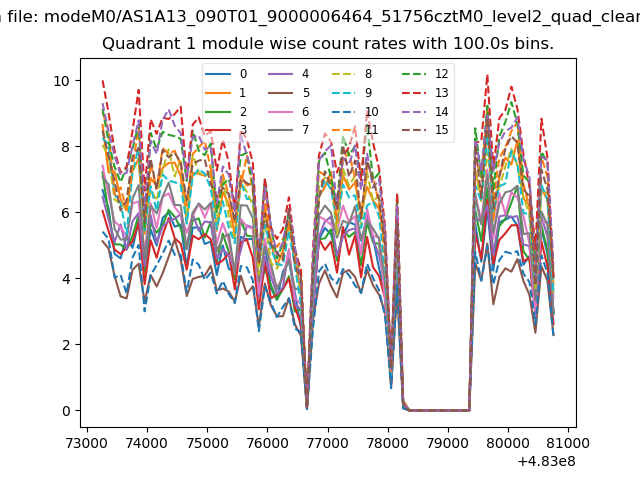
| Module-wise count rates for Quadrant A Data is divided into 100 sec bins |
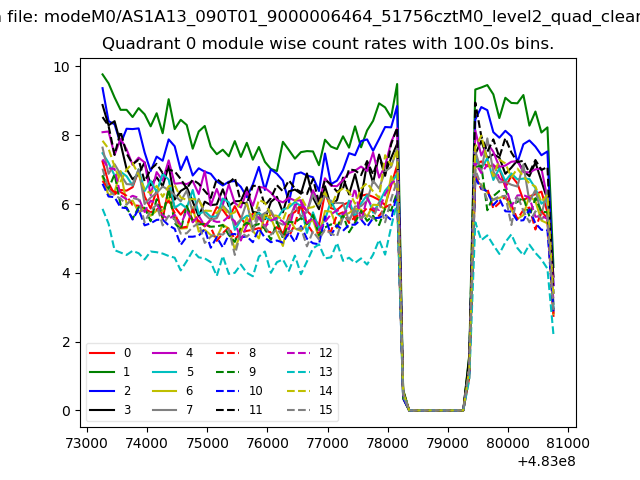 |
 |
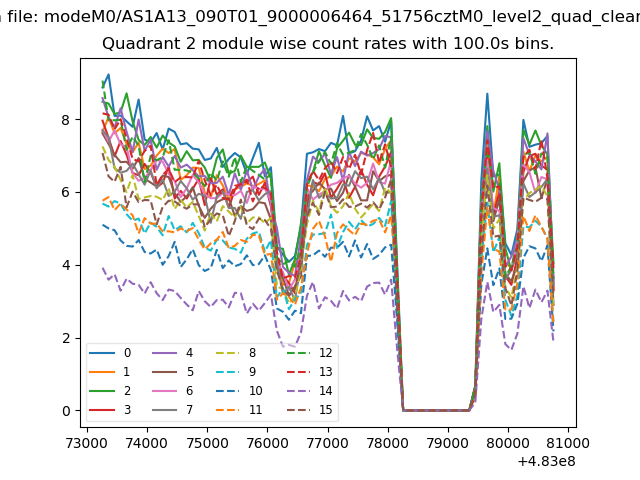
| Module-wise count rates for Quadrant B Data is divided into 100 sec bins |
 |
 |
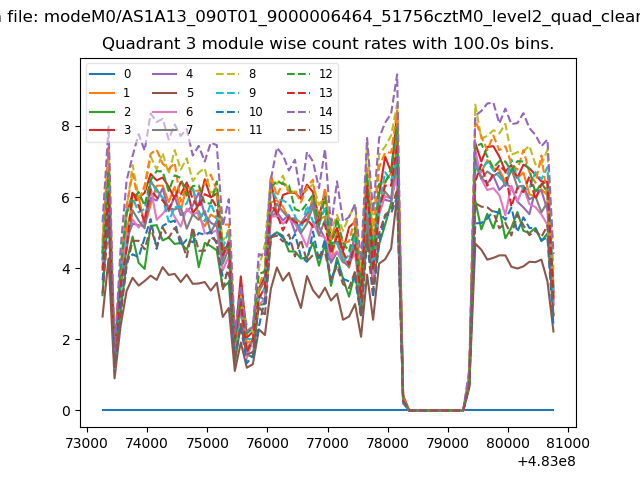
| Module-wise count rates for Quadrant C Data is divided into 100 sec bins |
 |
 |
| Module-wise count rates for Quadrant D Data is divided into 100 sec bins |
 |
 |
| Parameter | Plot |
|---|---|
| CZT HV Monitor | 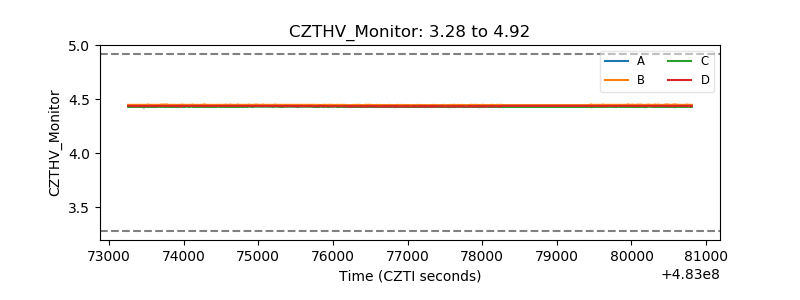 |
| D_VDD | 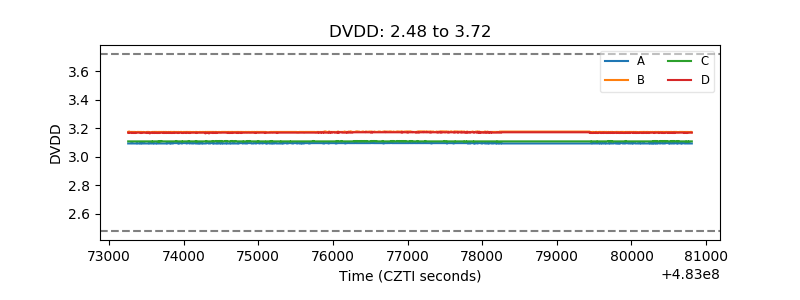 |
| Temperature 1 | 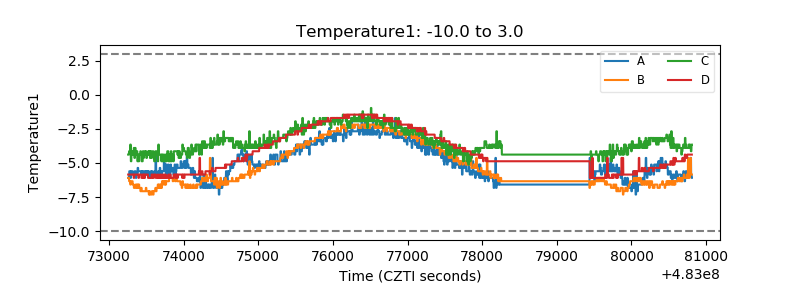 |
| Veto HV Monitor | 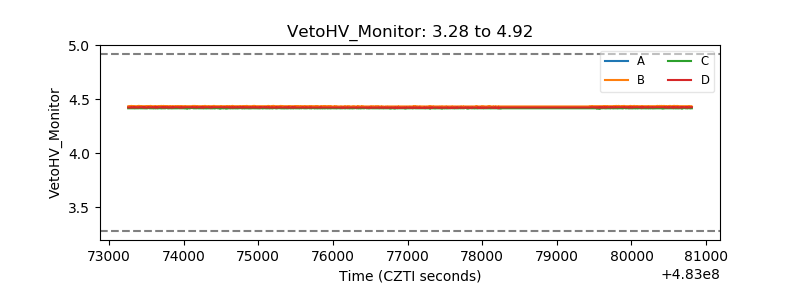 |
| Veto LLD | 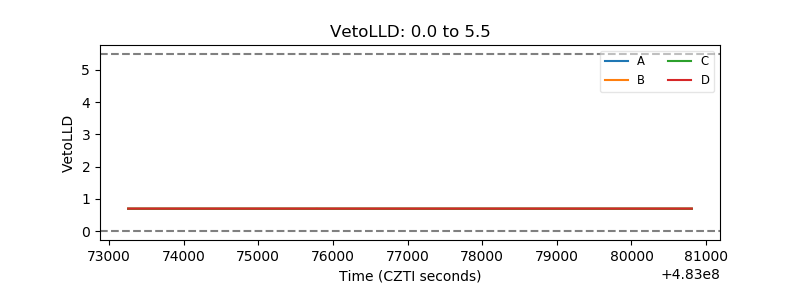 |
| Alpha Counter | 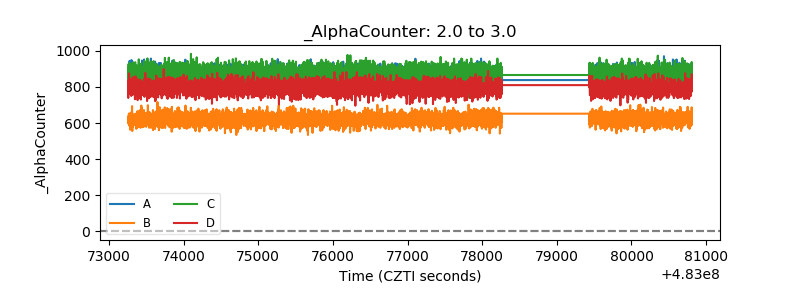 |
| _CPM_Rate | 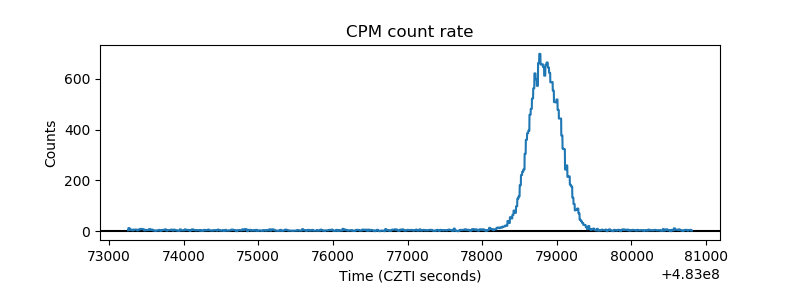 |
| CZT Counter | 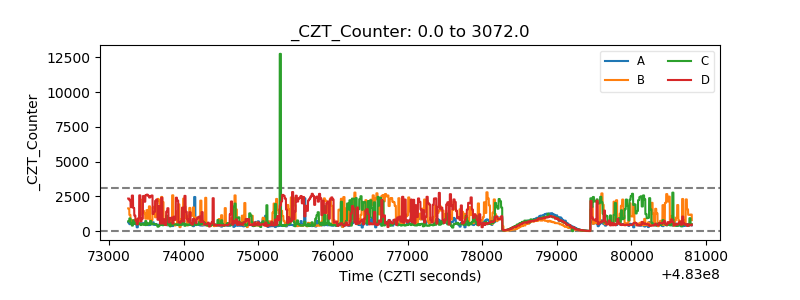 |
| +2.5 Volts monitor | 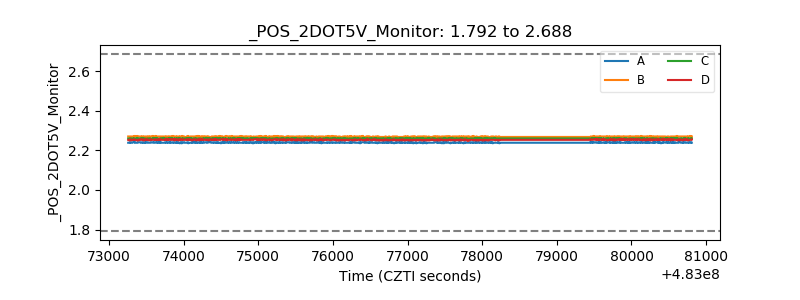 |
| +5 Volts monitor | 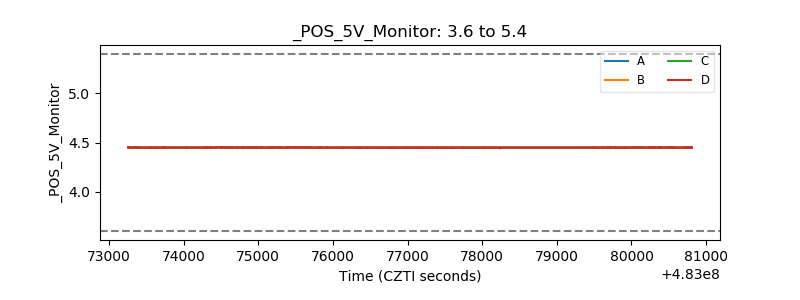 |
| _ROLL_ROT | 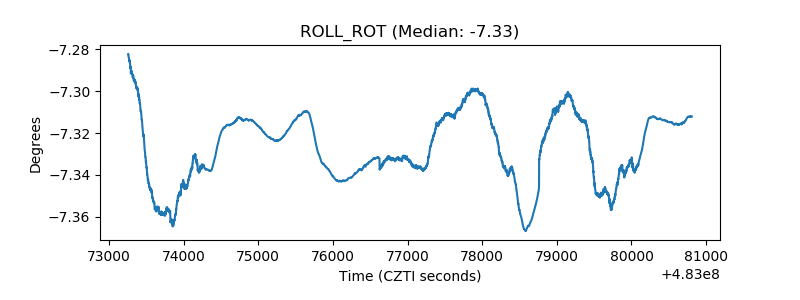 |
| _Roll_DEC | 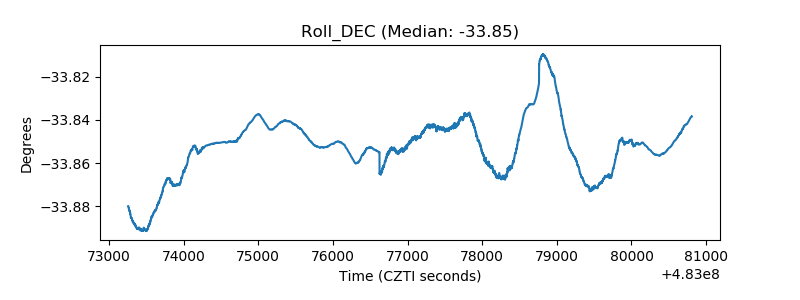 |
| _Roll_RA | 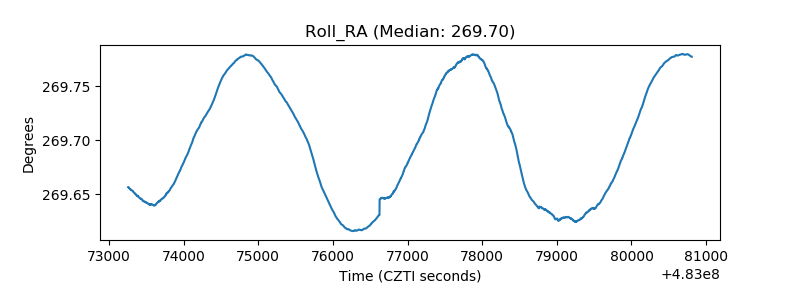 |
| Veto Counter | 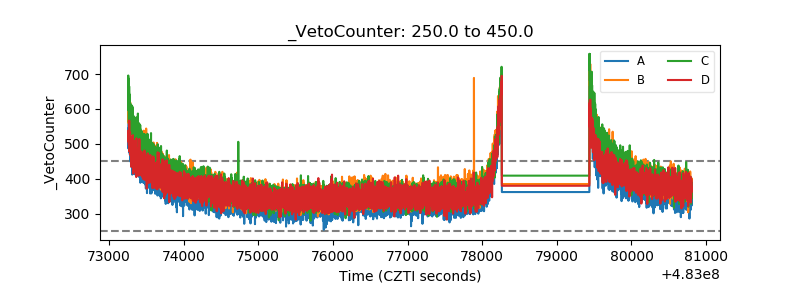 |