| Param | Original file | Final file |
|---|---|---|
| Filename | modeM0/AS1A13_090T01_9000006464_51757cztM0_level2.fits | modeM0/AS1A13_090T01_9000006464_51757cztM0_level2_quad_clean.evt |
| Size (bytes) | 616,184,640 | 91,923,840 |
| Size | 587.6 MB | 87.7 MB |
| Events in quadrant A | 4,692,287 | 620,130 |
| Events in quadrant B | 6,342,259 | 609,775 |
| Events in quadrant C | 5,552,672 | 557,595 |
| Events in quadrant D | 5,718,171 | 543,093 |
| Mode M9 | |||
|---|---|---|---|
| Quadrant | BADHDUFLAG | Total packets | Discarded packets |
| A | 0 | 15 | 0 |
| B | 0 | 16 | 0 |
| C | 0 | 16 | 0 |
| D | 0 | 16 | 0 |
| Mode SS | |||
|---|---|---|---|
| Quadrant | BADHDUFLAG | Total packets | Discarded packets |
| A | 0 | 130 | 0 |
| B | 0 | 130 | 0 |
| C | 0 | 130 | 0 |
| D | 0 | 130 | 0 |
| Mode M0 | |||
|---|---|---|---|
| Quadrant | BADHDUFLAG | Total packets | Discarded packets |
| A | 0 | 18409 | 4 |
| B | 0 | 23284 | 2 |
| C | 0 | 21011 | 2 |
| D | 0 | 21468 | 2 |
| Quadrant | Total seconds | Saturated seconds | Saturation percentage |
|---|---|---|---|
| A | 6497 | 311 | 4.786825% |
| B | 6497 | 1059 | 16.299831% |
| C | 6497 | 895 | 13.775589% |
| D | 6497 | 654 | 10.066184% |
Noise dominated data is calculated using 1-second bins in cleaned event files. If a bin has >2000 counts, and if more than 50% of those come from <1% of pixels, then it is considered to be noise-dominated and hence unusable.
| Quadrant | # 1 sec bins | Bins with >0 counts | Bins with >2000 counts | High rate bins dominated by noise | Noise dominated (total time) | Noise dominated (detector-on time) | Marked lightcurve |
|---|---|---|---|---|---|---|---|
| A | 7637 | 6498 | 189 | 189 | 2.47% | 2.91% | 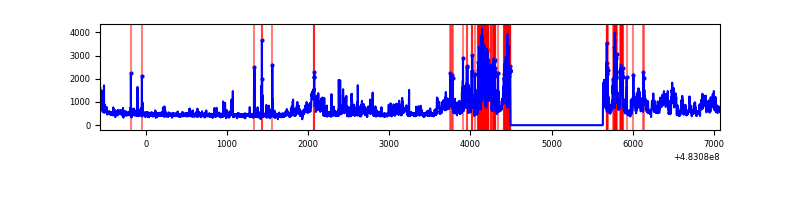 |
| B | 7637 | 6498 | 689 | 689 | 9.02% | 10.60% | 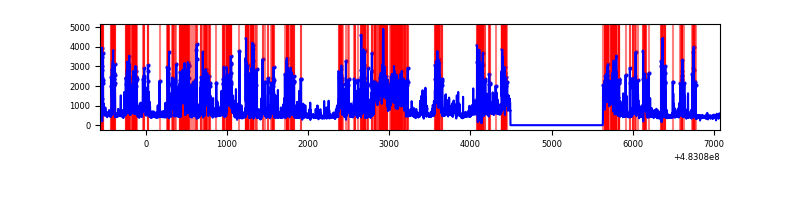 |
| C | 7637 | 6497 | 629 | 629 | 8.24% | 9.68% | 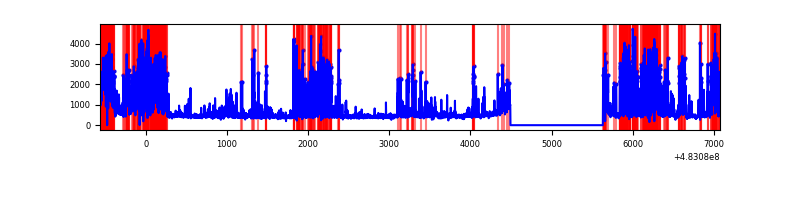 |
| D | 7637 | 6497 | 495 | 495 | 6.48% | 7.62% | 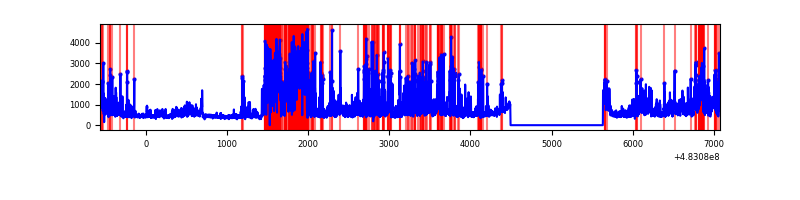 |
Top three noisy pixels from each quadrant. If the there are fewer than three noisy pixels in the level2.evt file, extra rows are filled as -1
| Pixel properties | Quadrant properties | ||||||
|---|---|---|---|---|---|---|---|
| Quadrant | DetID | PixID | Counts | Sigma | Mean | Median | Sigma |
| A | 12 | 3 | 865357 | 4980.7 | 710 | 693 | 173.6 |
| A | 15 | 174 | 571383 | 3287.33 | 710 | 693 | 173.6 |
| A | 12 | 194 | 104362 | 597.16 | 710 | 693 | 173.6 |
| B | 4 | 206 | 2744575 | 19003.92 | 674 | 649 | 144.4 |
| B | 7 | 0 | 411315 | 2844.19 | 674 | 649 | 144.4 |
| B | 9 | 223 | 68562 | 470.35 | 674 | 649 | 144.4 |
| C | 15 | 230 | 2272657 | 12381.31 | 667 | 661 | 183.5 |
| C | 13 | 3 | 151623 | 822.67 | 667 | 661 | 183.5 |
| C | 14 | 96 | 151071 | 819.66 | 667 | 661 | 183.5 |
| D | 11 | 129 | 2182884 | 11396.27 | 684 | 661 | 191.5 |
| D | 8 | 176 | 324250 | 1689.89 | 684 | 661 | 191.5 |
| D | 12 | 32 | 231608 | 1206.08 | 684 | 661 | 191.5 |
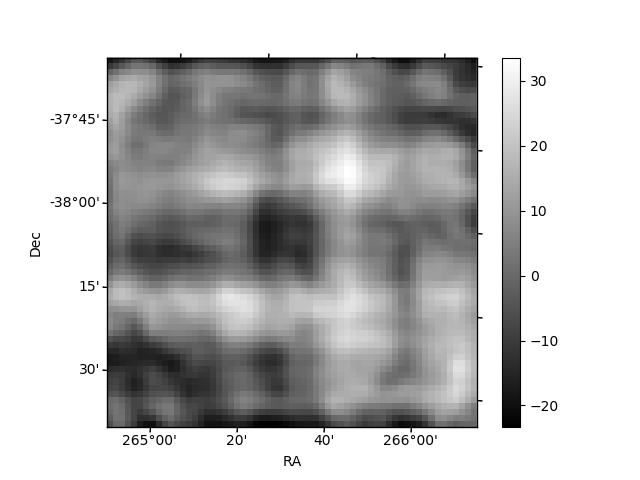
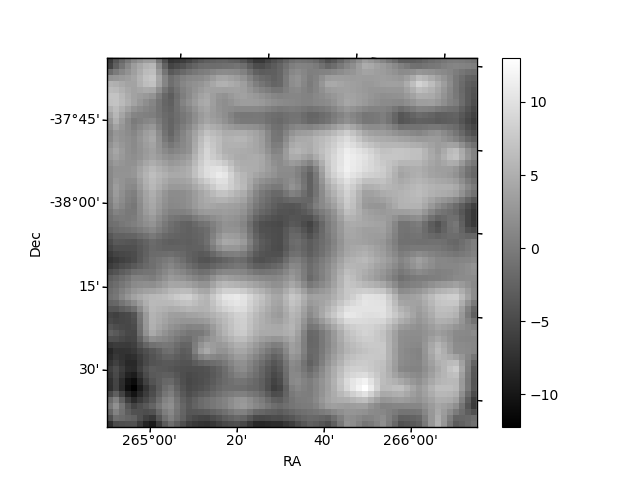
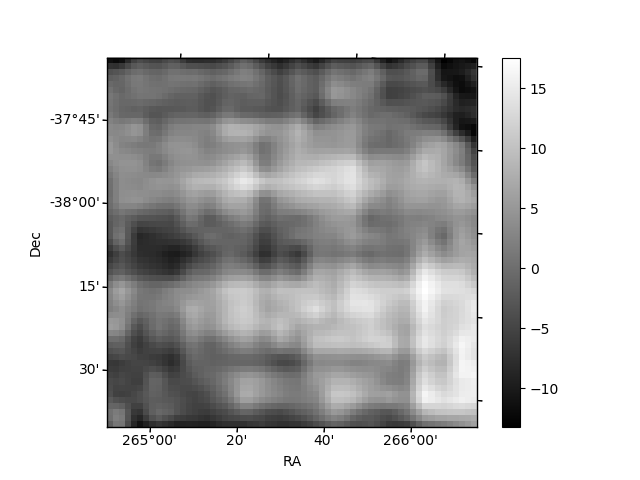
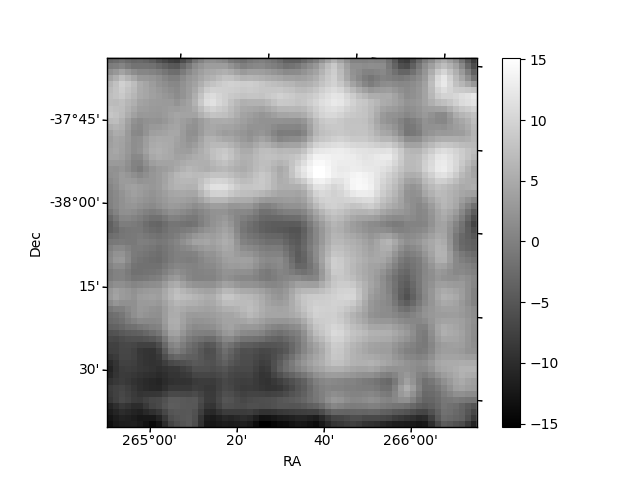
Histogram calculated using DETX and DETY for each event in the final _common_clean file
| Quadrant A | 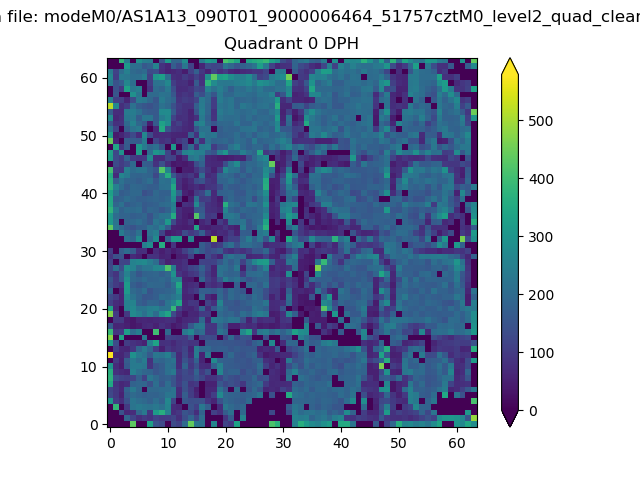 |
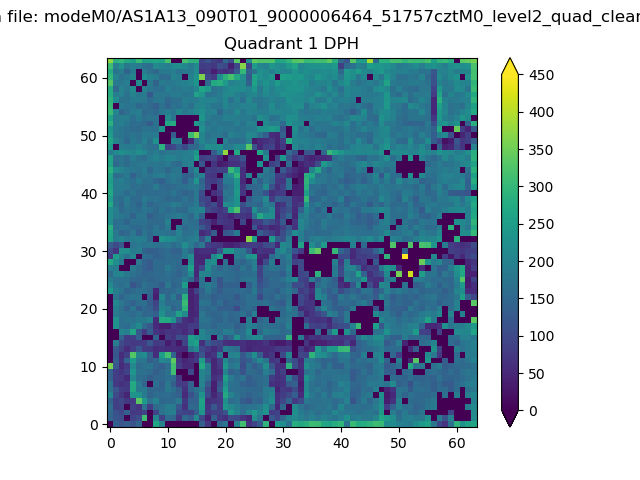 |
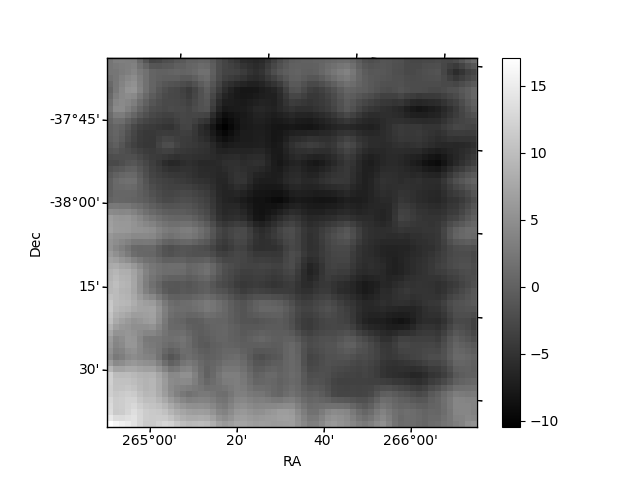
Quadrant B |
|---|---|---|---|
| Quadrant D | 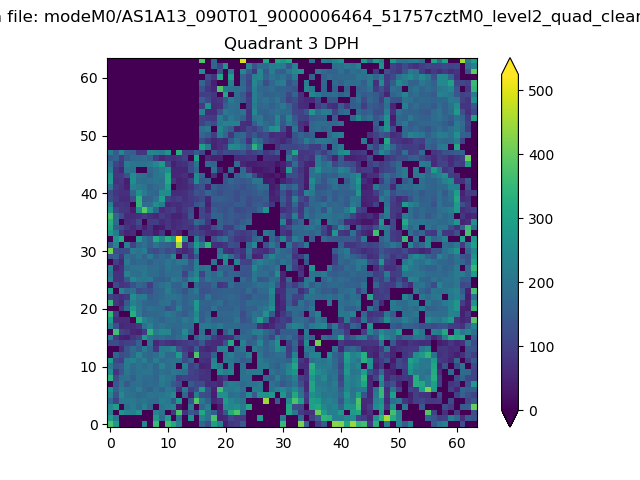 |
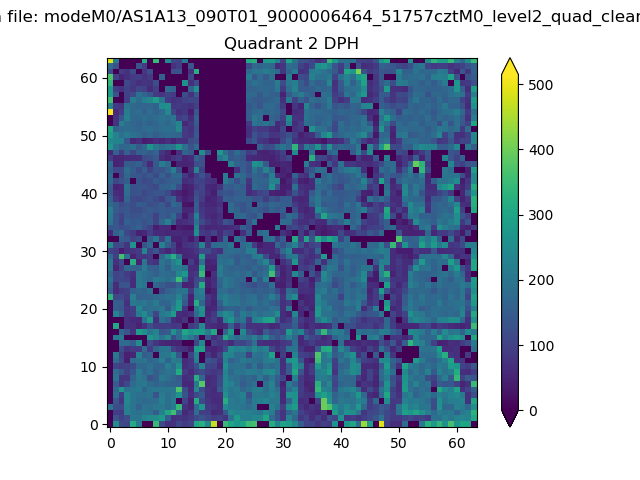 |
Quadrant C |
| Plot type | Count rate plots | Images |
|---|---|---|
| Comparison with Poisson distribution Blue bars denote a histogram of data divided into 1 sec bins. Red curve is a Poisson curve with rate = median count rate of data. |
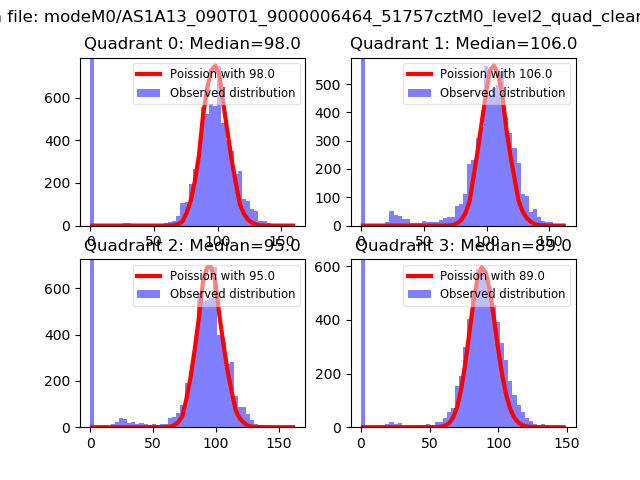 |
 |
| Quadrant-wise count rates Data is divided into 100 sec bins |
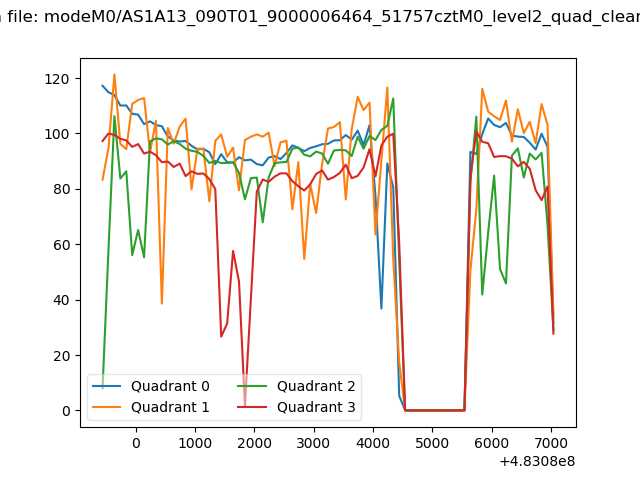 |
|
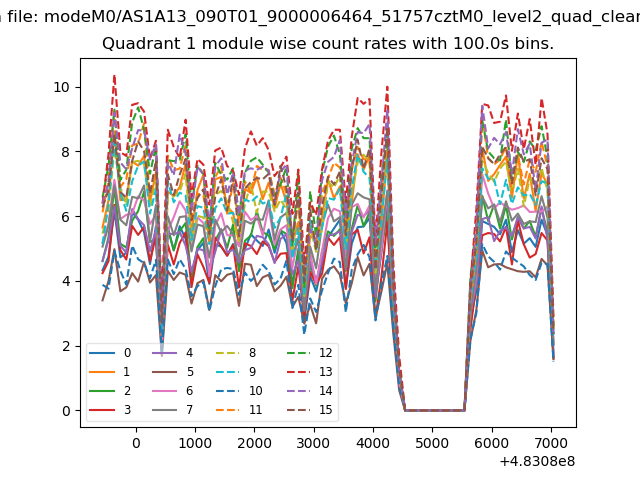
| Module-wise count rates for Quadrant A Data is divided into 100 sec bins |
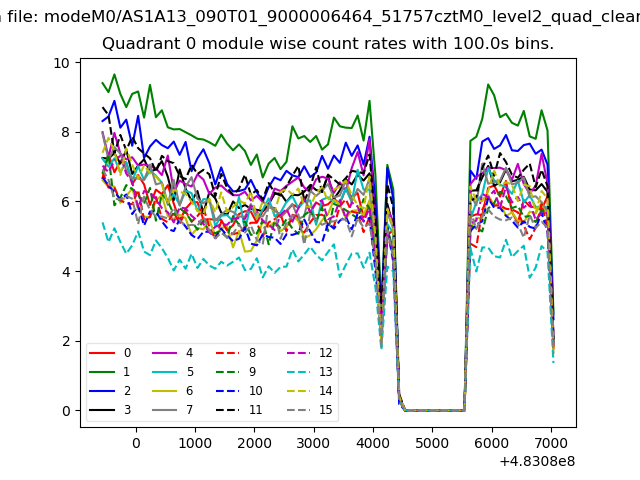 |
 |
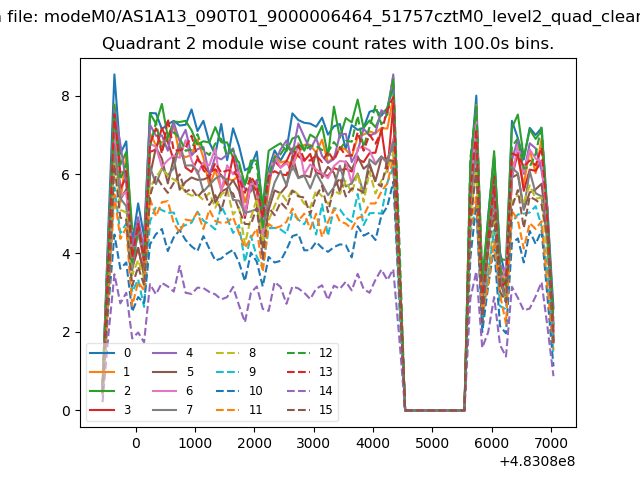
| Module-wise count rates for Quadrant B Data is divided into 100 sec bins |
 |
 |
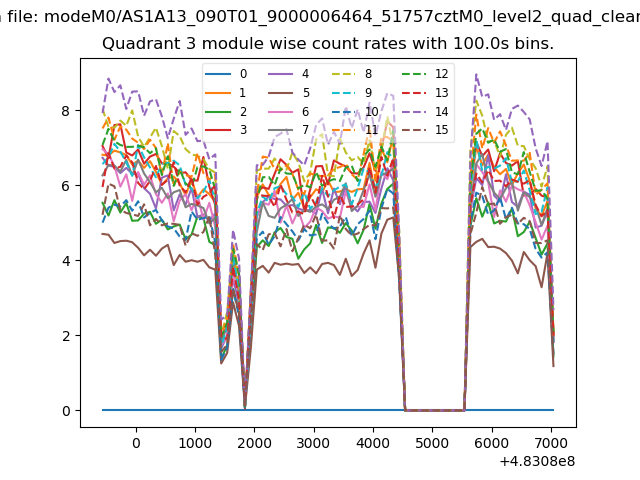
| Module-wise count rates for Quadrant C Data is divided into 100 sec bins |
 |
 |
| Module-wise count rates for Quadrant D Data is divided into 100 sec bins |
 |
 |
| Parameter | Plot |
|---|---|
| CZT HV Monitor | 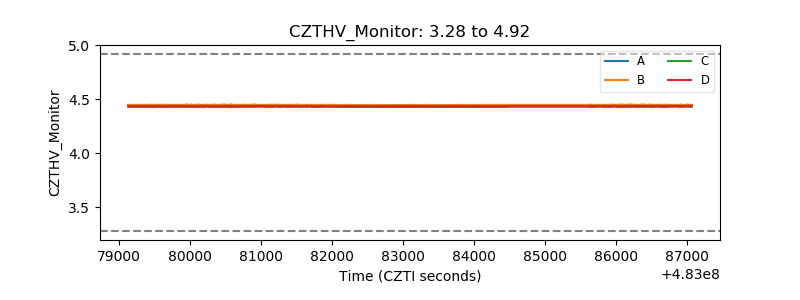 |
| D_VDD | 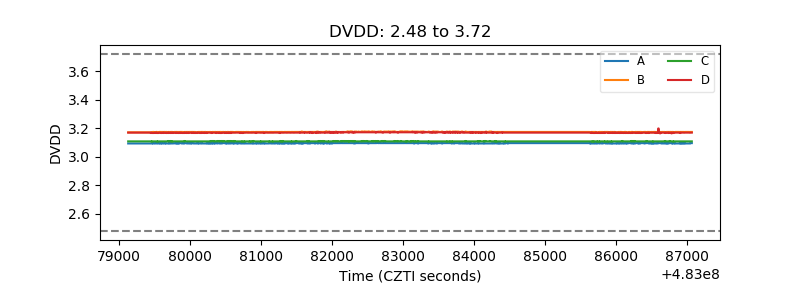 |
| Temperature 1 | 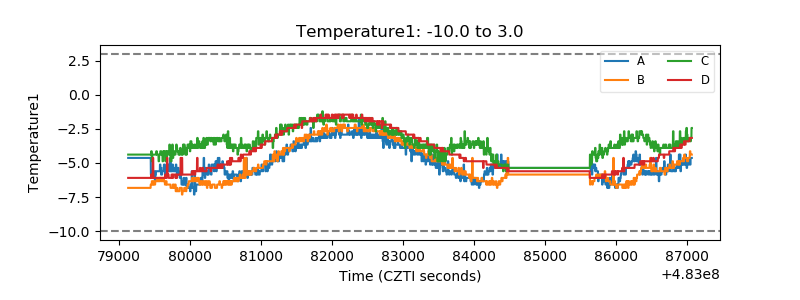 |
| Veto HV Monitor | 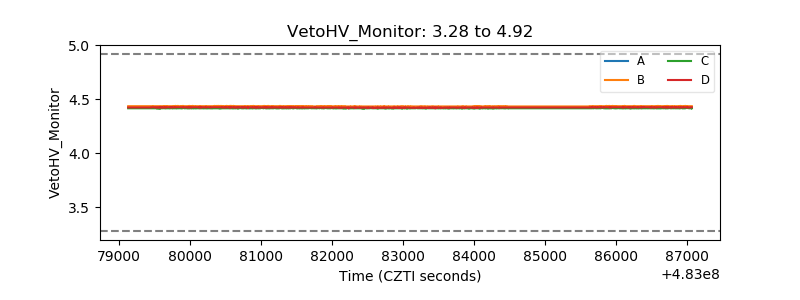 |
| Veto LLD | 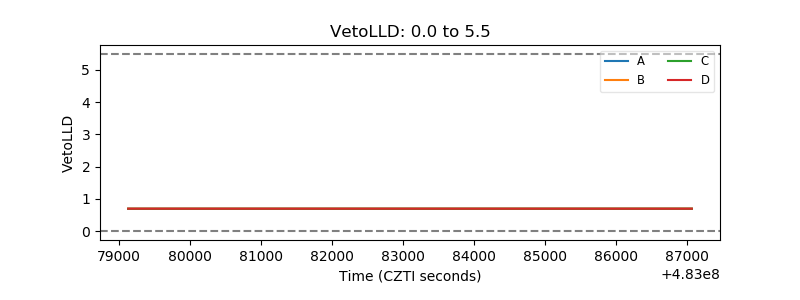 |
| Alpha Counter | 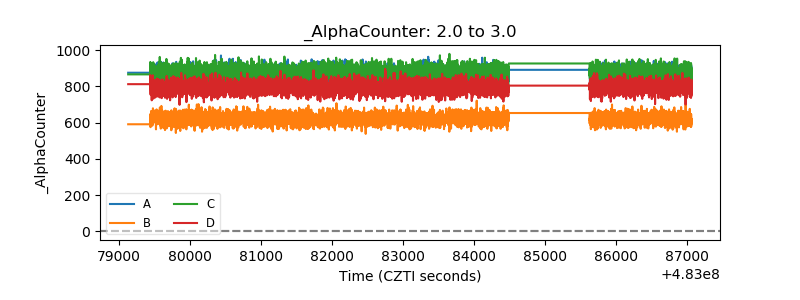 |
| _CPM_Rate | 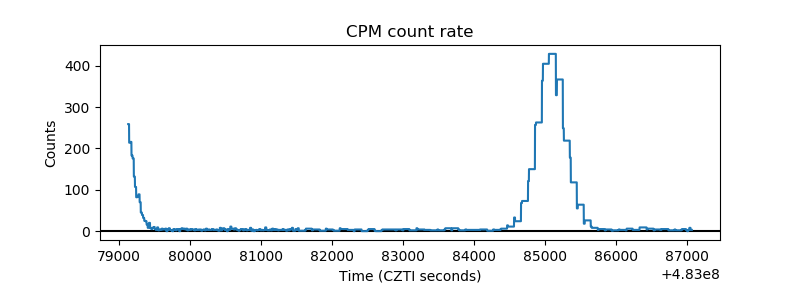 |
| CZT Counter | 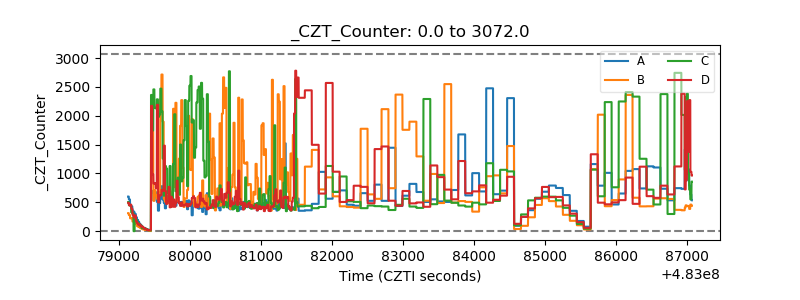 |
| +2.5 Volts monitor | 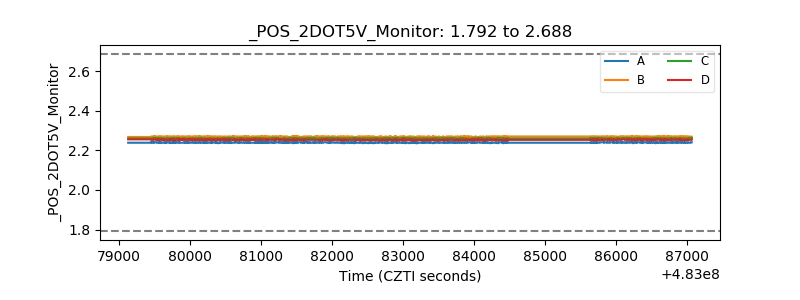 |
| +5 Volts monitor | 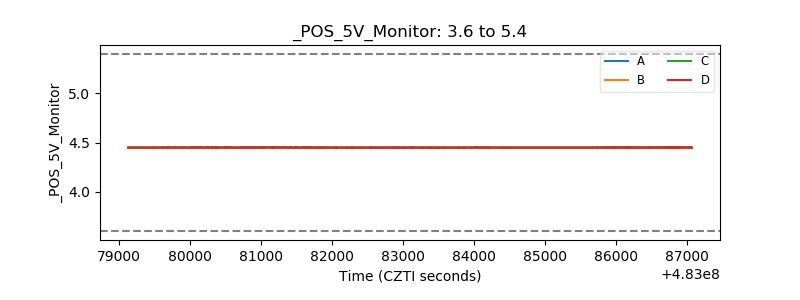 |
| _ROLL_ROT | 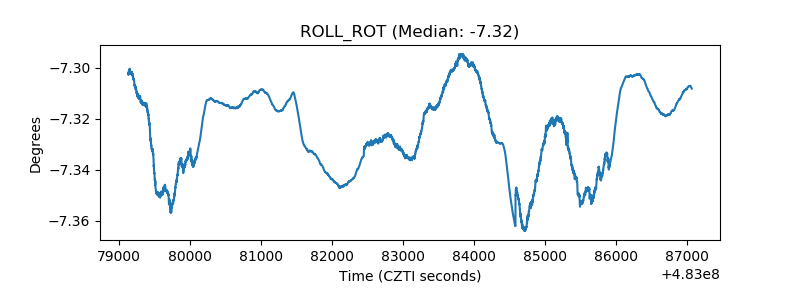 |
| _Roll_DEC | 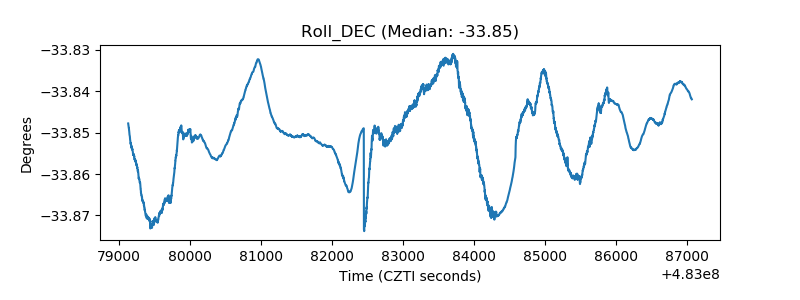 |
| _Roll_RA | 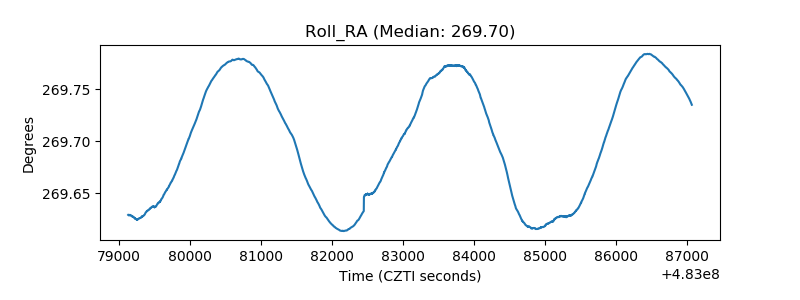 |
| Veto Counter | 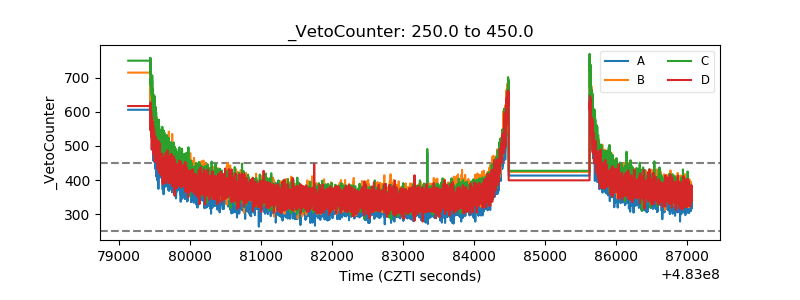 |