| Param | Original file | Final file |
|---|---|---|
| Filename | modeM0/AS1A13_090T01_9000006464_51760cztM0_level2.fits | modeM0/AS1A13_090T01_9000006464_51760cztM0_level2_quad_clean.evt |
| Size (bytes) | 787,786,560 | 94,936,320 |
| Size | 751.3 MB | 90.5 MB |
| Events in quadrant A | 5,186,367 | 674,473 |
| Events in quadrant B | 6,643,575 | 676,192 |
| Events in quadrant C | 3,895,357 | 691,305 |
| Events in quadrant D | 12,848,164 | 305,792 |
| Mode SS | |||
|---|---|---|---|
| Quadrant | BADHDUFLAG | Total packets | Discarded packets |
| A | 0 | 150 | 0 |
| B | 0 | 150 | 0 |
| C | 0 | 150 | 0 |
| D | 0 | 150 | 0 |
| Mode M0 | |||
|---|---|---|---|
| Quadrant | BADHDUFLAG | Total packets | Discarded packets |
| A | 0 | 20692 | 0 |
| B | 0 | 25019 | 0 |
| C | 0 | 17027 | 0 |
| D | 0 | 43478 | 0 |
| Quadrant | Total seconds | Saturated seconds | Saturation percentage |
|---|---|---|---|
| A | 7572 | 397 | 5.243001% |
| B | 7573 | 1085 | 14.327215% |
| C | 7573 | 133 | 1.756239% |
| D | 7573 | 4379 | 57.823848% |
Noise dominated data is calculated using 1-second bins in cleaned event files. If a bin has >2000 counts, and if more than 50% of those come from <1% of pixels, then it is considered to be noise-dominated and hence unusable.
| Quadrant | # 1 sec bins | Bins with >0 counts | Bins with >2000 counts | High rate bins dominated by noise | Noise dominated (total time) | Noise dominated (detector-on time) | Marked lightcurve |
|---|---|---|---|---|---|---|---|
| A | 7572 | 7572 | 59 | 59 | 0.78% | 0.78% | 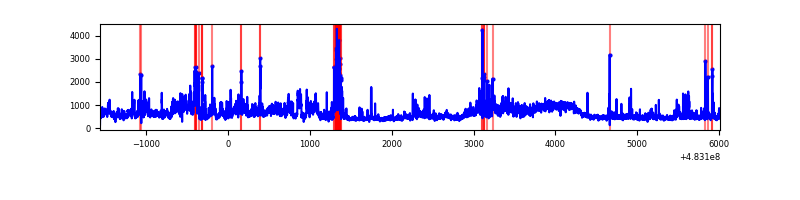 |
| B | 7573 | 7573 | 492 | 492 | 6.50% | 6.50% | 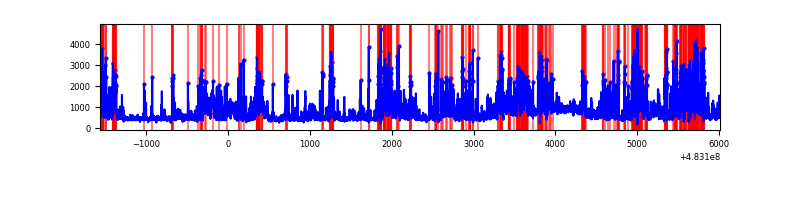 |
| C | 7573 | 7573 | 47 | 47 | 0.62% | 0.62% | 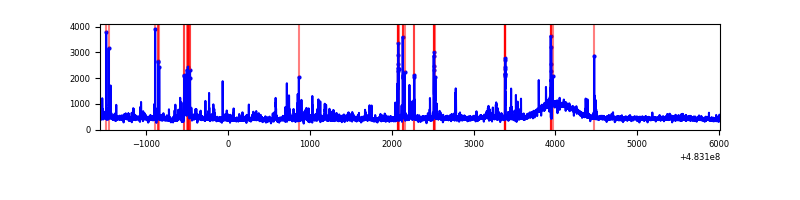 |
| D | 7573 | 7570 | 2953 | 2953 | 38.99% | 39.01% | 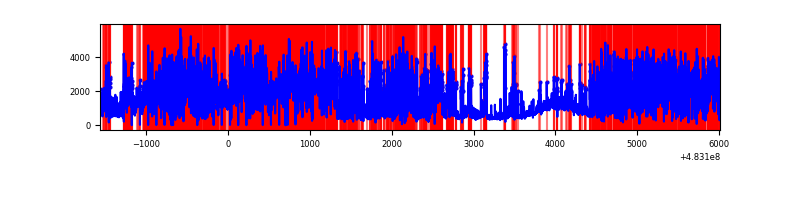 |
Top three noisy pixels from each quadrant. If the there are fewer than three noisy pixels in the level2.evt file, extra rows are filled as -1
| Pixel properties | Quadrant properties | ||||||
|---|---|---|---|---|---|---|---|
| Quadrant | DetID | PixID | Counts | Sigma | Mean | Median | Sigma |
| A | 3 | 14 | 948054 | 4540.17 | 858 | 836 | 208.6 |
| A | 12 | 3 | 258627 | 1235.63 | 858 | 836 | 208.6 |
| A | 13 | 248 | 125551 | 597.78 | 858 | 836 | 208.6 |
| B | 4 | 206 | 2401591 | 13370.26 | 818 | 788 | 179.6 |
| B | 1 | 223 | 262115 | 1455.35 | 818 | 788 | 179.6 |
| B | 0 | 216 | 137264 | 760.05 | 818 | 788 | 179.6 |
| C | 3 | 233 | 121880 | 528.48 | 841 | 837 | 229.0 |
| C | 0 | 192 | 120696 | 523.31 | 841 | 837 | 229.0 |
| C | 15 | 189 | 96696 | 418.53 | 841 | 837 | 229.0 |
| D | 11 | 129 | 9382547 | 61123.0 | 549 | 529 | 153.5 |
| D | 15 | 94 | 621107 | 4043.01 | 549 | 529 | 153.5 |
| D | 7 | 222 | 157964 | 1025.67 | 549 | 529 | 153.5 |
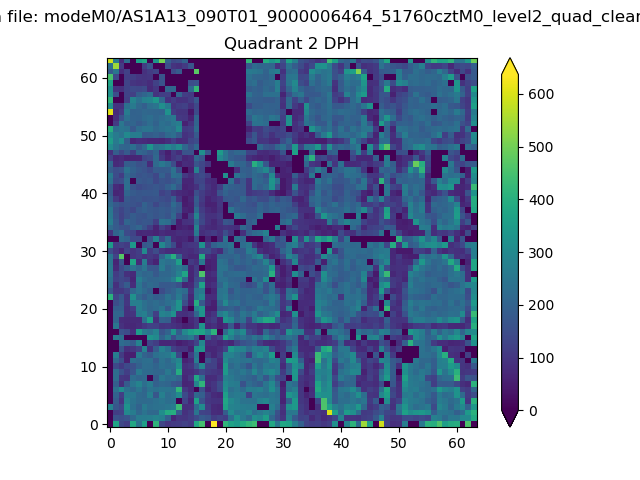
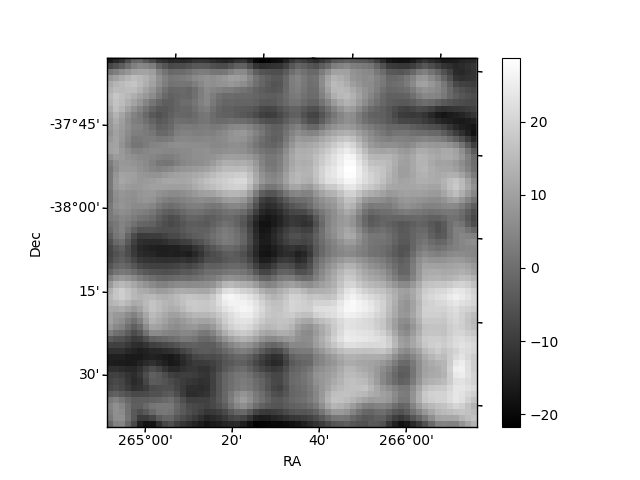
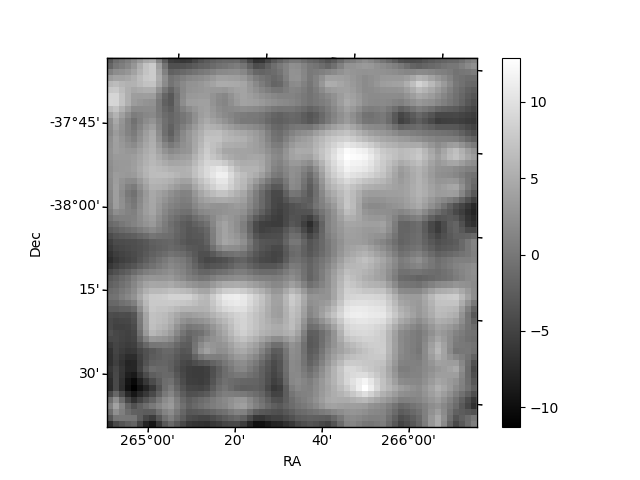
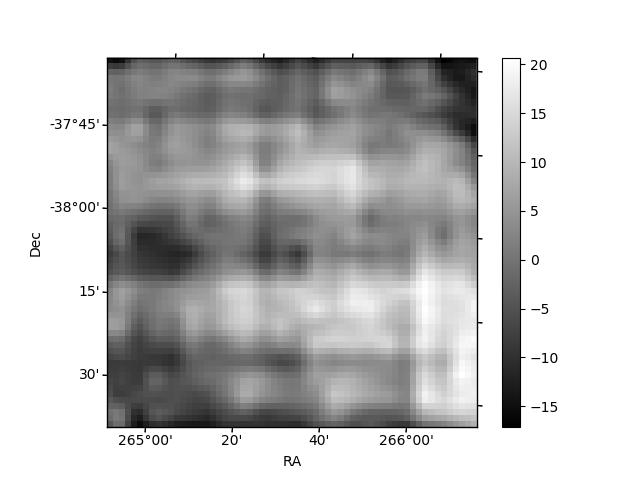
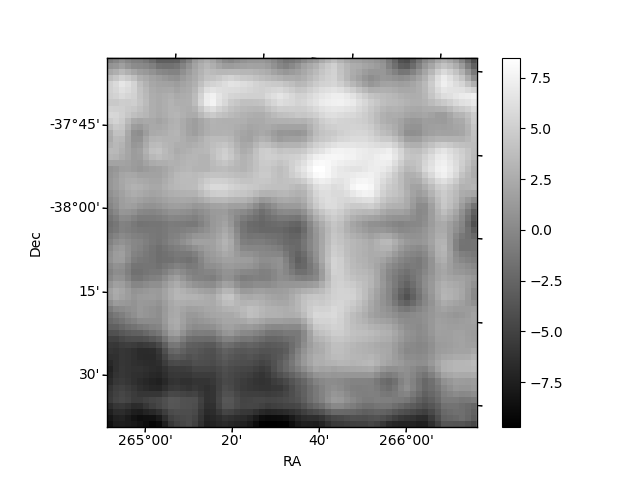
Histogram calculated using DETX and DETY for each event in the final _common_clean file
| Quadrant A | 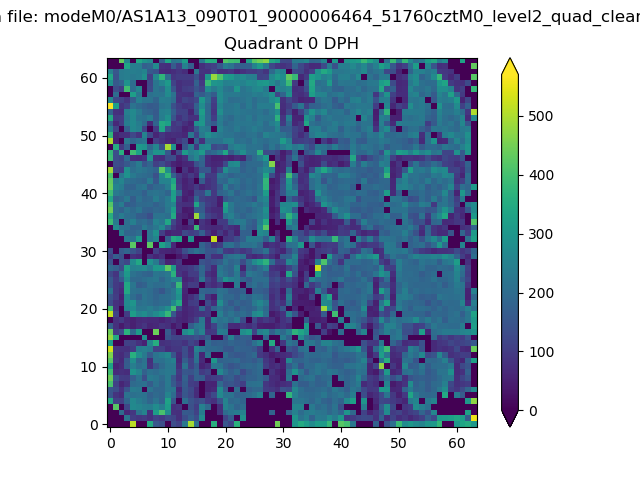 |
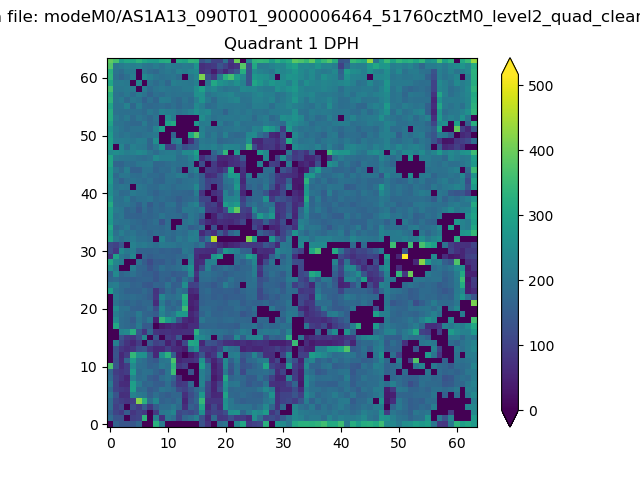 |
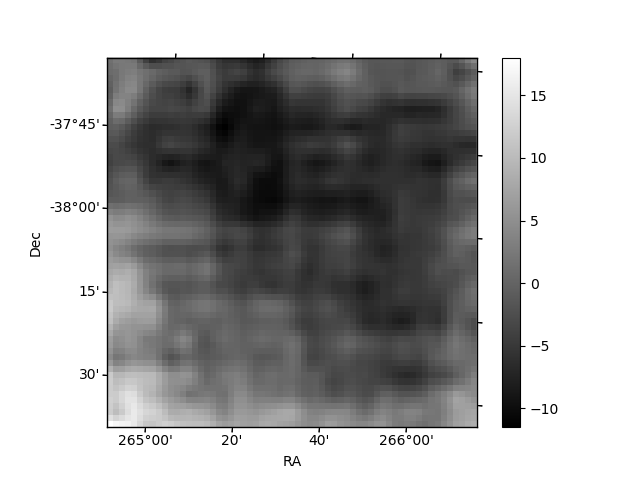
Quadrant B |
|---|---|---|---|
| Quadrant D | 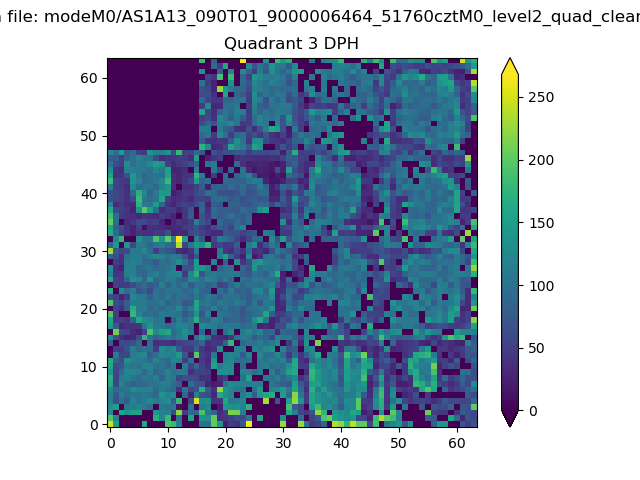 |
 |
Quadrant C |
| Plot type | Count rate plots | Images |
|---|---|---|
| Comparison with Poisson distribution Blue bars denote a histogram of data divided into 1 sec bins. Red curve is a Poisson curve with rate = median count rate of data. |
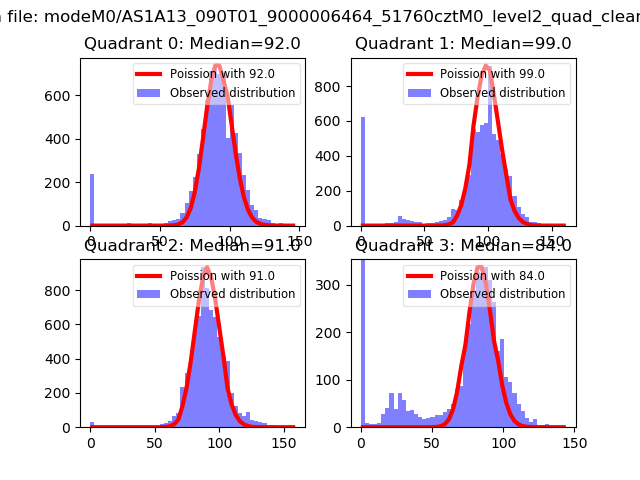 |
 |
| Quadrant-wise count rates Data is divided into 100 sec bins |
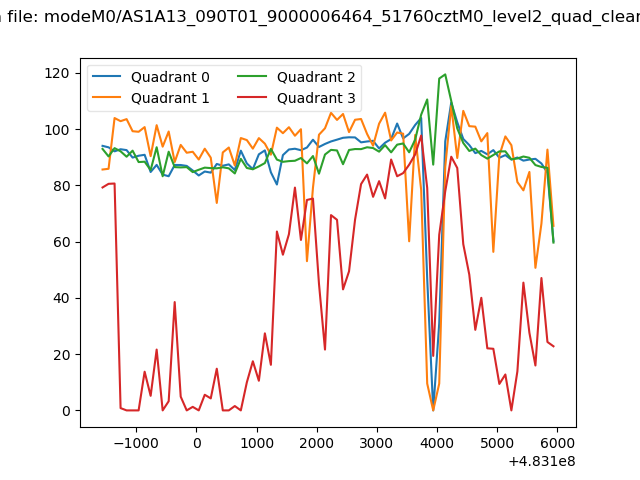 |
|
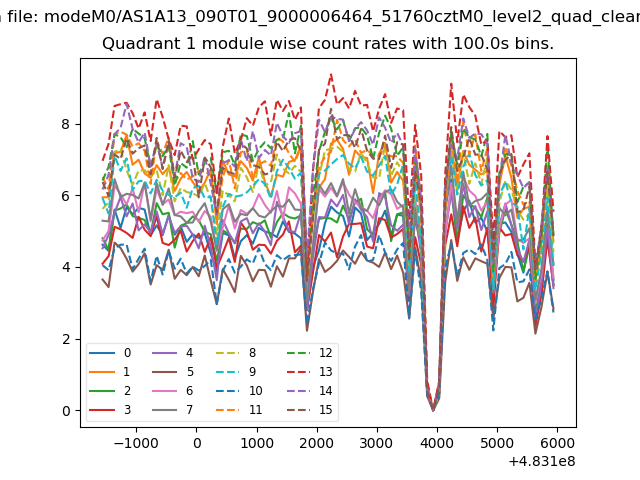
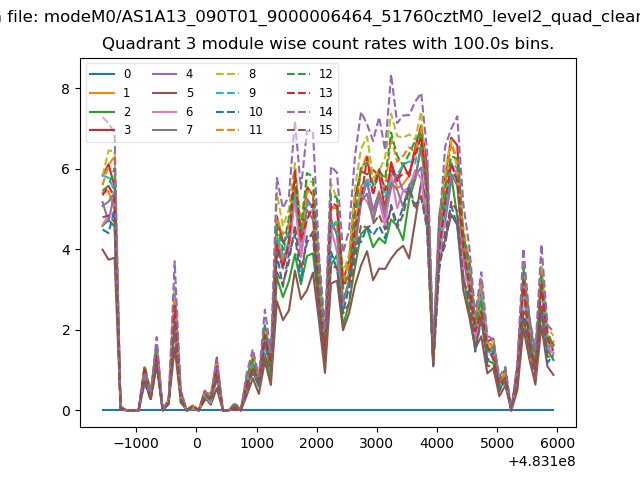
| Module-wise count rates for Quadrant A Data is divided into 100 sec bins |
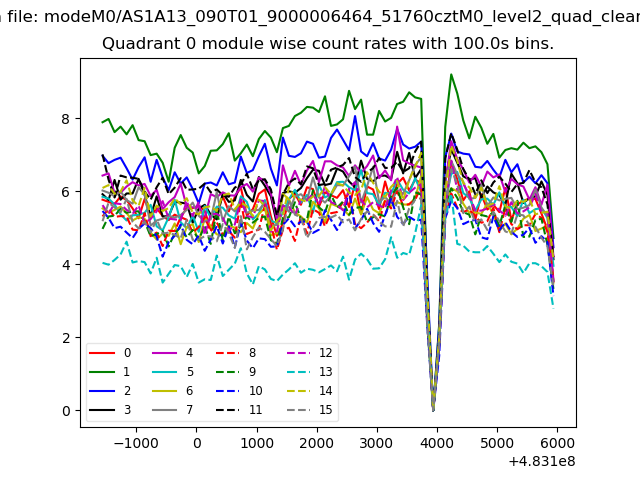 |
 |
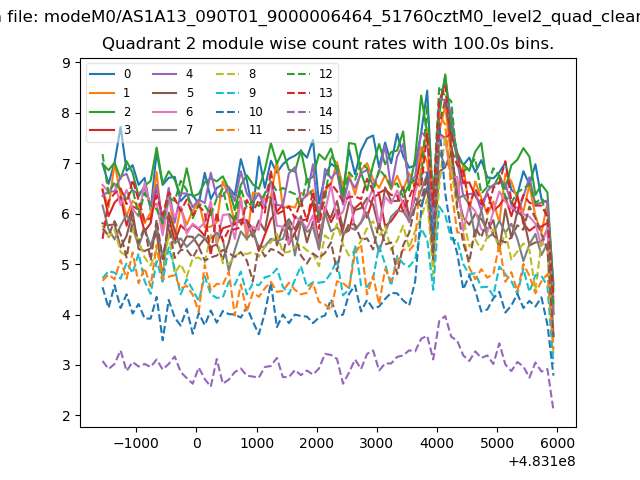
| Module-wise count rates for Quadrant B Data is divided into 100 sec bins |
 |
 |
| Module-wise count rates for Quadrant C Data is divided into 100 sec bins |
 |
 |
| Module-wise count rates for Quadrant D Data is divided into 100 sec bins |
 |
 |
| Parameter | Plot |
|---|---|
| CZT HV Monitor | 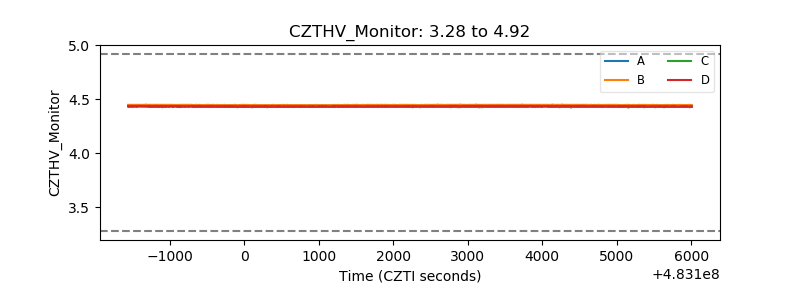 |
| D_VDD | 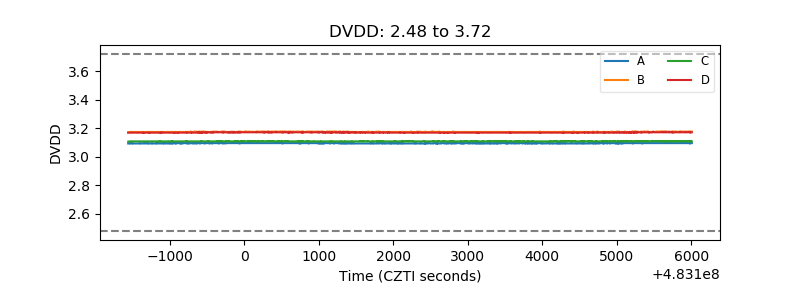 |
| Temperature 1 | 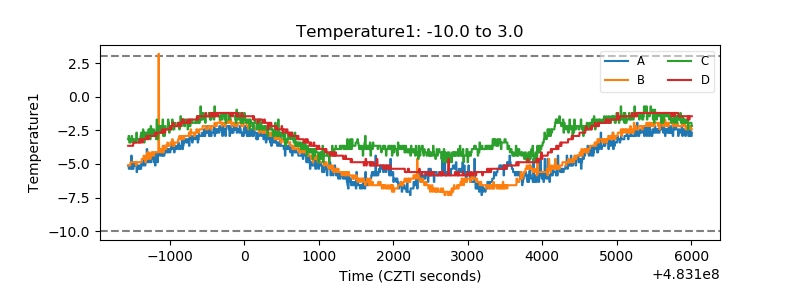 |
| Veto HV Monitor | 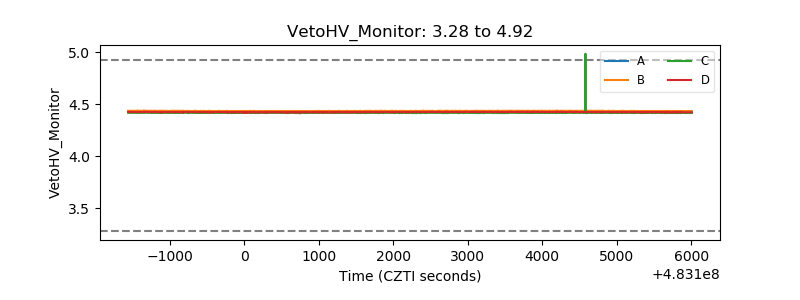 |
| Veto LLD | 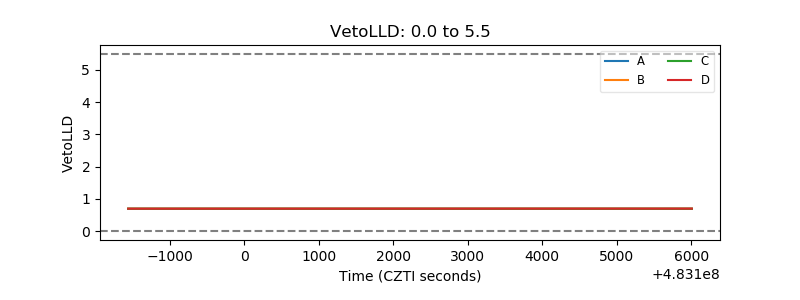 |
| Alpha Counter | 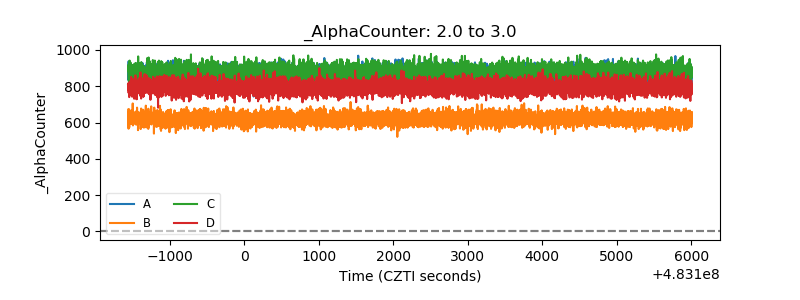 |
| _CPM_Rate | 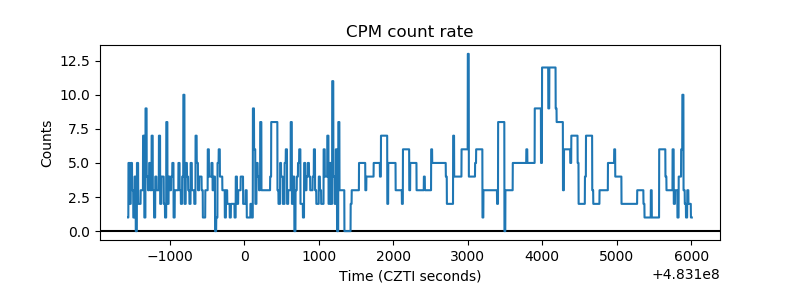 |
| CZT Counter | 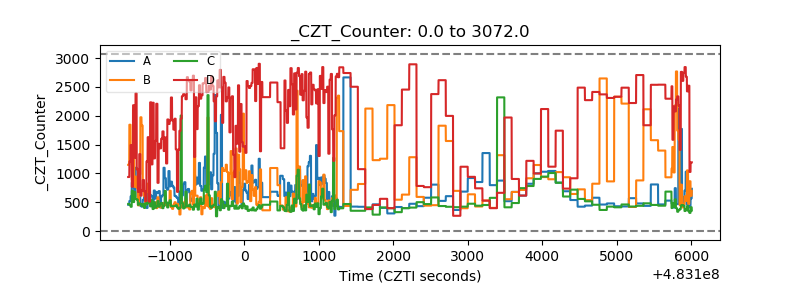 |
| +2.5 Volts monitor | 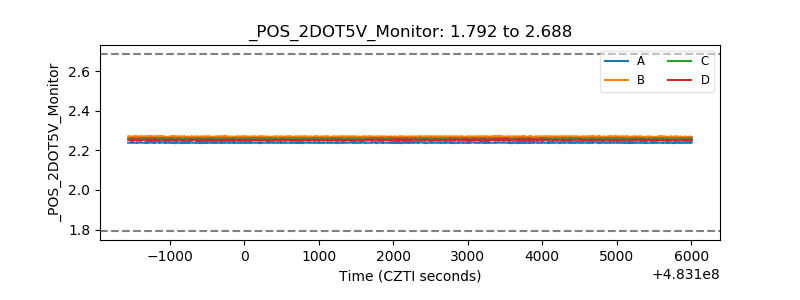 |
| +5 Volts monitor | 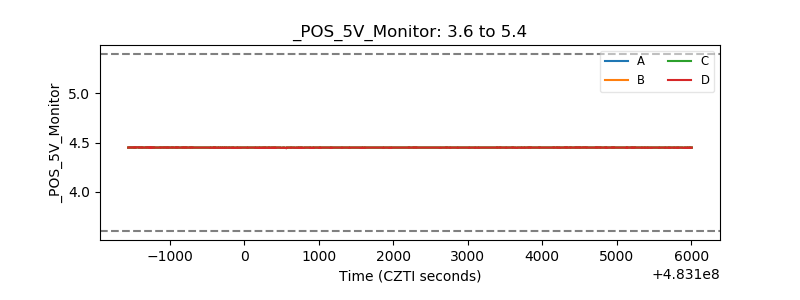 |
| _ROLL_ROT | 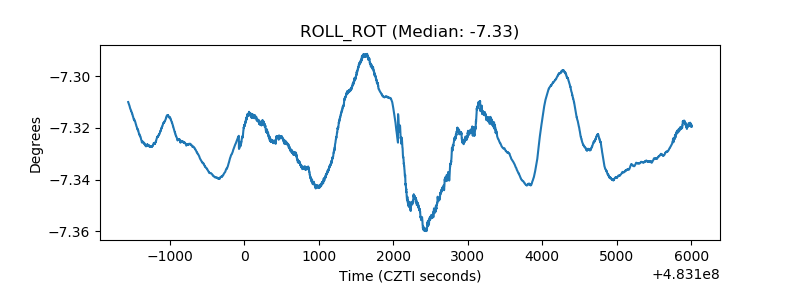 |
| _Roll_DEC | 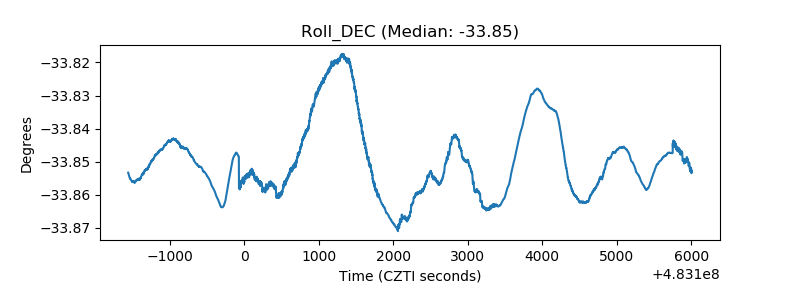 |
| _Roll_RA | 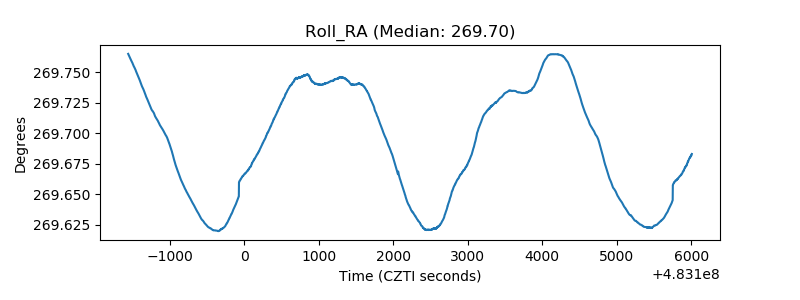 |
| Veto Counter | 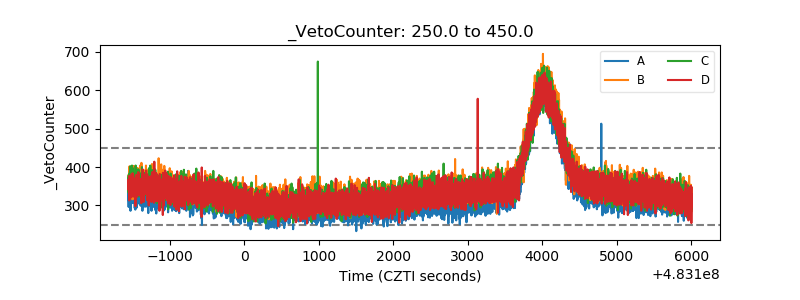 |